AVERAGE TEMPERATURE
Data aggiornamento scheda:
The indicator describes the trend of average temperatures in Italy. The increase in average temperatures recorded in Italy over the last thirty years is often greater than the global average on land. In 2025, the anomaly, compared to the 1991-2020 climatological average, in the average temperature in Italy (+1.03 °C) was greater than the global average on land (+0.85 °C). In Italy, 2025 was the fourth warmest year in the entire annual series since 1961. Since 2000, anomalies compared to the 1991-2020 climatological baseline have always been positive, with the exception of four years (2004, 2005, 2010, and 2013).
DISTRIBUTION OF FERTILIZERS FOR AGRICULTURAL USE (FERTILIZERS, SOIL IMPROVEMENTS AND CORRECTIVES)
Data aggiornamento scheda:
The indicator takes into account the fertilizers distributed in agriculture, i.e. the technical inputs used essentially for the growth of agricultural crops. It analyses their territorial and temporal distribution, for an overall representation of the environmental impact based on the quantities and types of fertilizers placed on the market.
In 2024, over 4 million tons of fertilizers were placed on the market.
44.7% is made up of mineral fertilizers (simple, compound, based on meso and microelements), which have always been the best-selling type, with the only exception in 2022 and despite a negative propensity in their long-term distribution (2000 - 2024).
Organic fertilizers (soil improvers and organic fertilizers) follow, with a sales figure of 35.3% and a reversal in the propensity in long-term distribution, positive until the previous year (2000 - 2023).
The most popular category The largest share of fertilizers sold is that of simple minerals, with over 1.2 million tons (29.7% of total fertilizers). Their sales volume has fluctuated for several years, but their slight increase (compared to 2023) is more significant than the simultaneous decline in soil improvers, leading to a reversal of the prevalence of soil improvers in the last two years (a drop of over 250,000 tons, for a sales volume in 2024 of approximately 1 million tons).
SEISMIC EVENTS
Data aggiornamento scheda:
The indicator describes the seismic events that occurred in the reference year in the Italian territory, based on the magnitudes recorded by the INGV National Seismic Network. In 2025, no seismic event reached Magnitude 5. Despite this, the earthquakes that affected the Campi Flegrei area, with Magnitude Md up to 4.6, characterized by very shallow hypocentres, caused damage, in particular to private construction. Earthquakes with a magnitude between 4 and 4.8 occurred in Italy and in a range of 100 km were a total of 20. Of these, 5 occurred in the Campi Flegrei area. The earthquake with the highest magnitude, equal to Mw 4.8, occurred off the Gargano coast without causing damage. The number of earthquakes with a magnitude equal to or greater than 2 that occurred in 2025 is comparable with that of the last 6 years. They were more concentrated, as usual, along the Apennine arc, the eastern Alpine arc and eastern Sicily.
NUMBER OF EMAS REGISTRATIONS
Data aggiornamento scheda:
As of 31 December 2025, the number of organisations active in the EMAS register, net of cancellations and suspensions, stands at 1,223, confirming the upward trend that began in 2018 (+26.7%). The total number of new EMAS certificates issued to organisations and enterprises is 2,425. The productive sectors demonstrating the highest participation rates fall into the following categories: Waste management and materials recovery, Services to buildings and landscape activities (which surpasses Energy supply), Specialised construction activities, and Wholesale trade (which overtakes Public administration). The lead held by regions in Central and Northern Italy is mirrored by measures enacted at the regional level in support of EMAS. Indeed, the most active regions are Lombardy, Tuscany, Emilia-Romagna, and Lazio. Regarding EMAS registrations by organisation size, the situation remains substantially stable compared to recent years, with a balanced distribution across small, medium, and large enterprises.
TOURIST INTENSITY
Data aggiornamento scheda:
The indicator monitors the tourism pressure exerted on the territory both in terms of magnitude, expressed by tourist arrivals, and the pressure borne by the territory, represented by tourist overnight stays. In 2025, national values show a marked increase: the arrivals-to-resident population ratio rises to 2.7, while the overnight stays-to-resident population ratio reaches 9.1, further exceeding pre-pandemic levels. Some regions and autonomous provinces record particularly high values: Valle d'Aosta registers 13.0 arrivals and 36.9 overnight stays per resident, while the Autonomous Province of Bolzano reaches 16.7 and 70.6, respectively. These figures highlight particularly intense and geographically concentrated tourism pressure.
RATIO BETWEEN FINAL ENERGY CONSUMPTION AND TOTAL ENERGY CONSUMPTION
Data aggiornamento scheda:
The ratio of final energy consumption to gross domestic energy consumption measures the overall efficiency of energy conversion from primary sources. The difference between these two measures corresponds to losses in conversion processes (such as electricity generation and oil refining), internal consumption by electricity generation plants, and losses in distribution. The percentage rate highlights the share of energy reaching the end user compared to the total energy fed into the system. This ratio for Italy stands at 81.3% in 2024, with a total energy volume of 113.7 Mtoe. This percentage value is consistently above the European Union (EU27) average, which in 2024 recorded a ratio of 74.0% out of a total of 939.3 Mtoe.
PRODUCTION OF WASTE FROM ECONOMIC ACTIVITIES
Data aggiornamento scheda:
In 2024, the overall production of Waste from Economic Activities generated by the national production system (industrial, commercial, artisanal, and service activities, as well as waste treatment and environmental remediation) will show significant growth, reaching over 172 million tonnes (+4.6% compared to 2023, corresponding to almost 7.6 million tonnes).
Non-hazardous Waste from Economic Activities, which represents 93.7% of total waste produced, shows an increase of almost 7 million tonnes (+4.5%), while hazardous waste, on the other hand, increases by 612 thousand tonnes (+6.0%).
With regard to the construction sector, the incentives provided by the Government for the renovation of buildings aimed at energy requalification continued. These construction/renovation works, together with construction sites for infrastructure and public works and residential and commercial buildings, also supported by funding provided by the National Recovery and Resilience Plan (PNRR), have generated increased quantities of construction and demolition waste.
SUSTAINABLE FOREST MANAGEMENT CERTIFICATION
Data aggiornamento scheda:
Anthropogenic pressure on forest ecosystems in recent decades, due in part to the increased use of woody biomass for bioenergy and as a technical and construction material, has led to the degradation of many natural and semi-natural systems, particularly in tropical areas. These phenomena are often associated with the unsustainable and/or illegal exploitation of forest resources. The harvesting, processing, and transportation of wood and its derivatives can generate significant negative impacts on the environment, local/global economics, and even society. Over the last twenty years, attention has been focused on the sustainable use of forest biomass, encouraging concrete actions and effective tools aimed at preventing such impacts and mitigating their effects. These positive initiatives have involved policymakers, private companies, associations, and private citizens. Forest certification was created as a tool to prevent negative impacts and threats to national and international forestry heritage through the adoption of appropriate practices, based on careful planning and monitoring of the use and management of woody biomass.
In Italy, as of December 31, 2025, the forest area certified according to the Programme for Endorsement of Forest Certification schemes (PEFC™) scheme is equal to 1,124,507 hectares (with a 6% increase compared to 2024); while the area certified according to the Forest Stewardship Council® (FSC®) scheme amounts to 155,751 hectares (35% more than the previous year).
CLASSIFICATION OF BATHING WATER
Data aggiornamento scheda:
The quality of bathing water is essential for safeguarding the health of citizens and also plays an important role in protecting the natural environment and the economic aspects of the tourism sector. For this reason, specific monitoring is carried out throughout the bathing season. For the 2025 bathing season, over 36,505 sea and lake water samples were collected and analyzed from a total of over 6,900 km of bathing coastline. A total of 5,535 sampling points, representative of an entire bathing area, were collected. The monitoring results guarantee the suitability of the water for bathing during the season and are used at the end of the season to classify the water. The classification was based on the results of the monitoring conducted during the 2025 bathing season and those of the three previous seasons (2022, 2023, and 2024). At the national level, most waters are classified as excellent (90%), however, critical issues remain due to the presence of waters classified as poor (1%) and unclassifiable (1%), for which it is not possible to express a quality assessment. At the regional level, the percentage of waters classified as excellent is the highest, exceeding 90% in 10 regions.
MATERIAL FOOTPRINT
Data aggiornamento scheda:
The indicator quantifies the extraction of natural resources—biomass, metal ores, non-metallic minerals, and fossil fuels—globally, driven by final consumption and investments by households, businesses, and public administration in Italy. Italy has structurally reduced its material footprint, going from 17.8 to 11 tonnes per capita between 2008 and 2025, lower than the EU average (14.3 tonnes per capita). This result highlights significant progress in terms of efficiency and circularity. However, to ensure this competitive advantage is sustainable, the decoupling between economic growth and resource consumption must be consolidated.
NATURA 2000 NETWORK
Data aggiornamento scheda:
The Natura 2000 Network, established under the Habitats and Birds Directives (known as the Nature Directives), consists of 2,649 sites in Italy, covering a total area, net of overlaps, of 5,844,888 hectares on land, equal to 19.4% of the national territory, and a marine area of 2,344,963 hectares, equal to 6.5% of the waters under national jurisdiction (territorial waters and EPZ) (2025 data, transmitted to the Commission in January 2026). The Network is fundamental for the implementation of the Nature Directives, but it is also important in relation to the targets of the European and National Biodiversity Strategies for 2030 (EBS2030 and NBS2030), which call for expanding protected zones to at least 30% of the land surface and 30% of marine waters; in addition to the N2000 Network sites, all areas subject to protection, including National and Regional Parks and all other protected areas, contribute to this target. In the Italian regions and autonomous provinces, the Network has a heterogeneous extension, with percentages of protected regional territories and waters ranging from 12% (Emilia-Romagna) to 36% (Abruzzo) on land and from less than 1% (Marche) to 31% (Puglia) at sea.
IMPACT OF TOURISM ON WASTE GENERATION
Data aggiornamento scheda:
The indicator measures the pressure exerted by tourist flows on Italy’s waste management system and is used as a proxy for monitoring Goal 12 of the 2030 Agenda, specifically SDG indicator 12.b.1.
The expanded methodology provides a more comprehensive and realistic estimate of the equivalent tourist population. In addition to officially recorded nights spent in tourist accommodation establishments, it includes nights spent in free accommodation—such as second homes and the homes of relatives or friends—as well as same-day visits.
In 2024, the indicator reached 16.2 kg per equivalent inhabitant, an increase of approximately 0.5 kg compared with 2023 and more than 5 kg above the value calculated using the “conventional” equivalent population, which amounted to 10.8 kg per equivalent inhabitant.
Second homes remained the main component accounting for this difference, adding 4.3 kg, followed by same-day visits, which added 1.2 kg. The result confirms the increasing pressure of tourism on municipal cleansing and waste management services, particularly in highly seasonal destinations, and strengthens the need for waste prevention and collection policies tailored to emerging patterns of tourism use.
AMMONIA EMISSIONS FROM AGRICULTURE
Data aggiornamento scheda:
The indicator describes ammonia (NH₃) emissions to the atmosphere from the agricultural sector, mainly resulting from livestock management and fertilizer use. It also assesses the sector's contribution to total national ammonia emissions and progress towards emission reduction targets.
In 2024, the agricultural sector emitted 323.5 kt of NH₃, accounting for 90.8% of total national ammonia emissions. With a 24% reduction compared with 2005, the sector is making a decisive contribution to achieving the emission reduction target.
The trend in NH₃ emissions is consistent with the reduction commitments established under the Gothenburg Protocol and the National Emission Ceilings (NEC) Directive.
INTERNAL FLOW
Data aggiornamento scheda:
The indicator Internal flow provides the annual estimate, expressed in mm, of the quantity of renewable water resource that is naturally produced in a given area as a result of rainfall. The indicator is calculated for each year from 1951 to 2025.
In 2025 the value of the indicator at national level is 423.8 mm, corresponding to 128 billion cubic metres. The average value of the indicator compared to the national territory of the last thirty climatological years 1991–2020 is 442.6 mm, corresponding to 133.7 billion cubic meters, while the long-term average 1951–2025 (so-called LTAA‒ Long-Term Annual Average ) is 457.2 mm, corresponding to 138.1 billion cubic meters.
2025 was characterized by a negative anomaly of the renewable water resource both compared to the long-term average (–7.4%) and compared to the last thirty climatological years (–4.3%). The gap increases if the data is compared with the value of the indicator estimated in 2024, equal to 524.2 mm (–19.2%). At a national level, the availability of renewable water resources continues to show a statistically significant negative trend from 1951 to today.
FOREST ECOSYSTEM AREAS AFFECTED BY WILDFIRES: STATUS AND CHANGES
Data aggiornamento scheda:
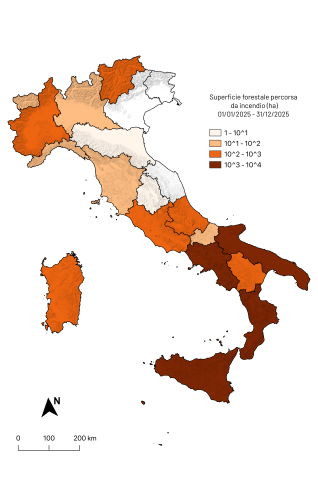
The indicator examines the series of forest areas affected by large fires on a national, regional and protected area scale in the period between 2018 and 2025.
The distribution and extension of these surfaces generally shows significant interannual variability. 2025, in particular, was a year seriously affected by an extension of the forest areas affected by fires, greater than the previous year. Furthermore, the forest area burned is only lower than that burned in 2021, 2022 and 2023.
In 2025, the most affected regions were: Sicily (3,967 hectares - ha), Calabria (2,892 ha) and Campania (1,835 ha), which together represent 71% of the forest area at national level affected by fire.
The forest classes most affected are evergreen broad-leaved trees (e. g. Holm oak forests and tall scrub), followed by deciduous broad-leaved trees (e. g. Oak and beech forests) and decidedly less so by conifers (e. g. Pine forests, fir forests and larch forests).
The linear regression analysis of the national forest cover data series affected by fire does not show an increasing trend, although the length of the series does not allow medium and long-term evaluations. On the contrary, a statistically significant positive trend was observed for the regions of Puglia, Basilicata and Calabria.
TOURIST FLOWS BY MODE OF TRANSPORT
Data aggiornamento scheda:
In 2024, inbound tourist flows at national borders continued to grow, reaching 88.6 million foreign visitors, compared with 85.7 million in 2023, an increase of 3.4%.
Air travel overtook road transport as the main mode of entry in 2024, accounting for 50.6% of inbound flows, while the share entering through road border crossings continued to decline, falling to 45.9%. Rail and sea arrivals remained marginal, accounting for 1.5% and 1.9%, respectively.
For trips made by residents in Italy within the country—the domestic component—passenger cars remained by far the dominant mode and increased their share further. In 2024, cars accounted for 72.6% of domestic trips, compared with 69.5% in 2023, while the share of rail travel declined to 12.4%, from 13.5% in 2023.
Overall, the modal structure confirms that the shift towards lower-impact modes of transport remains limited.
FINAL ELECTRICITY CONSUMPTION BY ECONOMIC SECTOR
Data aggiornamento scheda:
Final electricity consumption grew constantly from 1990 to 2008 and then decreased due to the economic crisis. Following the effects of the SARS-CoV-2 pandemic, consumption in 2020 decreased by 5.7% compared to the previous year with a rebound of 6.2% in 2021 followed by a decrease in subsequent years. In 2024 there is a decrease of 2.8% compared to 2021, reaching a value of 24.4 Mtoe. The share of consumption in industry has fallen from 51.7% in 1990 to 37.6% in 2024, that of the tertiary and residential sectors has increased from 43.2% to 56.9%, that of agriculture and fishing has changed very little, going from 2% to around 2.4%, while that of transport, with some fluctuations, remains around 3%.
CONSUMPTION FOOTPRINT
Data aggiornamento scheda:
The indicator quantifies the environmental impact of Italian consumption through 16 indicators based on the life cycle (LCA). In the period 2010-2024, the national consumption footprint index recorded a reduction of 8% (dropping from 100 to 92), compared to a 6% increase in the EU-27 average. However, analyzing the trend per inhabitant, Italy's single score, despite having dropped from approximately 0.98 pt to 0.91 pt, remains constantly higher than the European average (which went from 0.82 pt to 0.85 pt), highlighting an environmental pressure per capita that is still high compared to the community context. The objective is to monitor the decoupling between consumption and impacts to fall within planetary limits.
PERCENTAGE OF PREPARATION FOR REUSE AND RECYCLING
Data aggiornamento scheda:
In 2024, the preparing for re-use and recycling rate, calculated using Method 4 and excluding C&D waste from households, stood at 52.3%, thus exceeding the target set for 2020 (50%).
GREENHOUSE GAS EMISSION INTENSITY FROM ENERGY CONSUMPTION
Data aggiornamento scheda:
The indicator consists of the ratio between atmospheric emissions of greenhouse gases and final energy consumption by sector. The average value of emission intensities shows a difference between the sectors in relation to the different diffusion of renewable sources. Overall, emission intensity for final uses decreased by 29.8% from 1990 to 2024. The data shows that policies for the decarbonisation of energy consumption have produced appreciable results in the sectors of electricity production and in the manufacturing industry. On the contrary, the transport sector, decidedly less centralized than the sectors mentioned, represents the real "hard core" and the main challenge for the coming years.
EXPENSES FOR RESEARCH AND DEVELOPMENT IN THE INDUSTRY SECTOR
Data aggiornamento scheda:
The indicator reports the evolution of intramural Research and Development (R&D) expenditure by industrial enterprises in Italy. In 2023, intramural R&D expenditure reached EUR 12.19 billion, an increase of 7% compared with 2022, exceeding the pre-pandemic peak recorded in 2019. Almost all expenditure (99%) continued to be generated by the manufacturing sector, while mining and quarrying, energy supply, and waste management activities together accounted for the remaining 1%. Over the period 2012–2023, total investment increased by 46.1%. At the European level, R&D expenditure amounted to approximately 1.38% of GDP in 2024 (1.37% in 2023), leaving Italy below both the euro area average and its main European industrial competitors.
QUANTITY OF SEPARATELY COLLECTED MUNICIPAL WASTE
Data aggiornamento scheda:
In 2024, the separate collection rate was 67.7% of national municipal waste generation, increasing by 1.1 percentage points compared with 2023 and remaining above the target set by legislation for 2012 (65%).
FINAL SECTORAL AND TOTAL ENERGY INTENSITIES
Data aggiornamento scheda:
The energy intensity indicator expresses the relationship between energy consumption (whether gross or final) and the Gross Domestic Product (GDP) expressed at chain-linked market prices. This parameter represents a fundamental measure of the energy efficiency of an entire economic system, indicating how much energy is consumed to generate a unit of wealth. The analysis of the Italian time series between 1995 and 2024 reveals a progressive and structural decoupling between economic growth and energy consumption. In the face of economic fluctuations, the Italian productive and civil system has recorded a clear increase in efficiency, significantly reducing the quantity of energy necessary to produce national wealth, driven above all by the technological transformation of the industrial and civil sectors.
The internal comparison within the European Union highlights that Italy's primary and final energy intensity is lower than the European average due to the historical shortage of primary energy sources (which has favored the creation of economical behaviors and infrastructures in the use of energy and a production structure that is not excessively energy-intensive), the strong taxation (which has increased the cost of energy sources to end users beyond the values of other countries), the lower per capita income, and the relatively mild climate. According to an increasing ranking of gross energy intensity values, Italy ranks 7th among the countries of the European Union.
CONSERVATION STATUS OF SPECIES UNDER THE HABITATS DIRECTIVE 92/43/EEC
Data aggiornamento scheda:
The indicator illustrates the trends and conservation status of the over 340 Italian species protected by the Habitats Directive 92/43/EEC and is based on the results of the last three Italian reports pursuant to art. 17, coordinated by ISPRA on behalf of MASE and transmitted to the European Commission in 2013, 2019 and 2025. The data from the latest report (referring to the period 2019-2024 and delivered in 2025) are presented in detail, in which the 346 species of community interest present in our territory and in our seas were evaluated (226 animal species and 120 plant species), creating 344 distribution maps and 580 reporting sheets (one for each species in each biogeographical region of presence).
The results show that in 2025, 29% of species are in poor conservation status (SC) and 20% are in bad conservation status, meaning they are in worrying conditions and at risk of extinction. Terrestrial and freshwater fauna is the group with the highest percentage of species in bad SC (22%), followed by terrestrial flora (16%) and marine species (11%).
Comparing the results of the V Report with the previous ones (III Report-2013, IV Report-2019) no improvements in the SC emerge for most species, even if there was an increase in knowledge for marine species. The percentages of change in the SC of the species between IV and V Report show 74% of the assessments in which the SC of the species remains unchanged, 10% in which the SC improves, 11% of assessments in which the SC worsens and a remaining 5% in which the assessments in the two reports are not comparable.
The data presented confirm the urgency of implementing the actions envisaged by the EU Regulation 2024/1991 for the Restoration of Nature and by the European and National Strategies for Biodiversity to 2030, whose targets provide that at least 30% of species and habitats in unfavorable SC improve their status by 2030 or show at least an improvement trend.
QUANTITY OF MUNICIPAL WASTE DISPOSED OF IN LANDFILL AND NUMBER OF LANDFILLS
Data aggiornamento scheda:
In 2024, the total amount of municipal waste disposed of in landfills amounted to over 4.4 million tonnes, and the number of operational landfills is equal to 102 plants. There was a reduction, compared to 2023, in the total quantity of urban waste disposed of in landfill equal to 3.7% (-170 thousand tons), and in the number of operational sites equal to 8.9% (-10 facilities).
GREENHOUSE GAS EMISSIONS (CO 2, CH 4, N 2 O, HFCS, PFCS, SF 6): SECTORAL DISAGGREGATION
Data aggiornamento scheda:
The indicator represents the historical series of national greenhouse gas emissions from 1990 to 2024, by sector of origin. The analysis of the data shows, in 2024, a significant reduction in emissions compared to 1990 (-30.2%), explained by the economic recession which has slowed down consumption in recent years but also by a greater use of renewable energy, with a consequent reduction in CO emissions 2 of the energy sector (-30.2% compared to 1990).
GREENHOUSE GAS EMISSIONS (CO 2, CH 4, N 2 O, HFCS, PFCS, SF 6 ): TRENDS AND PROJECTIONS
Data aggiornamento scheda:
The indicator represents the projections of national greenhouse gas emissions up to 2055, considering the scenario based on current policies as of 12/31/2022, therefore including those of the PNRR and the scenario with the additional policies and measures defined by the Integrated National Energy and Climate Plan (PNIEC). The scenario was calculated starting from the latest consolidated historical data relating to 2024, as well as from the expected evolution of the main macroeconomic drivers according to the indications provided to the European Commission. The information available for 2025, as well as the data relating to the first months of 2026, were also taken into consideration. The expected reductions in total greenhouse gas emissions (including LULUCF) estimated for 2030, compared to 1990, in the scenario with current policies and in the scenario with additional policies are equal to -44% and -55% respectively.
FARMLAND BIRD INDEX (FBI) - MONITORING OF BIRDS IN AGRICOLTURAL AREAS
Data aggiornamento scheda:
Farmland birds represent effective indicators of environmental quality due to their sensitivity to habitat changes and the feasibility of monitoring their populations using standardized methodologies on a large scale. Owing to these characteristics, the Farmland Bird Index is adopted by the European Commission as a context indicator of the Common Agricultural Policy to assess the state of biodiversity in agroecosystems and the effectiveness of conservation and rural land management measures.
The national indicator, calculated on the basis of the trend of 28 species typical of farmland environments over the 2000-2025 period, highlights an overall decline of 33.49%, with 71% of the considered species in decrease. The indicator relating to species typical of mountain grasslands (FBIpm), calculated on the trend of 13 species, also shows a reduction of 29.90%, with 46% of the species in decline. The results reveal a persistent deterioration of biodiversity associated with Italian farmland environments and the need to strengthen the conservation measures provided for by national and European biodiversity strategies.
GREENHOUSE GAS EMISSIONS (CO 2, CH 4, N 2 O, HFCS, PFCS, SF 6 ): PER CAPITA AND GDP
Data aggiornamento scheda:
The indicator represents, over the period 1990 - 2024, the trend in greenhouse gas emissions in Italy per inhabitant and compared to GDP. There is a decrease for both, accentuated by the growth of population and GDP, which therefore highlights a decoupling between determinants and pressures.
WETLANDS OF INTERNATIONAL IMPORTANCE
Data aggiornamento scheda:
To date, there are 63 Italian wetlands included in the official list of sites of the Ramsar Convention, recognized by the Ramsar Secretariat as wetlands of international importance, covering a total of 81,091 hectares. Overall, the 66 Italian Ramsar sites (63 designated by the Convention Secretariat and 3 in the process of designation) are distributed across 15 regions. The regions with the largest and most numerous areas are Emilia-Romagna (10 sites, with an area equal to 23,112 ha), Tuscany (11 sites with an area equal to 20,755 ha), and Sardinia (9 sites, with an area equal to 13,308 ha). The level of implementation of protection and management instruments for these areas, necessary to ensure the conservation of habitats, flora, and fauna linked to aquatic ecosystems, is not sufficiently known.