Marina Vitullo
The indicator represents the historical series of national greenhouse gas emissions from 1990 to 2024, by sector of origin. The analysis of the data shows, in 2024, a significant reduction in emissions compared to 1990 (-30.2%), explained by the economic recession which has slowed down consumption in recent years but also by a greater use of renewable energy, with a consequent reduction in CO emissions 2 of the energy sector (-30.2% compared to 1990).
Greenhouse gas emissions are largely due to carbon dioxide (CO2) emissions, connected, as far as human activities are concerned, mainly to the use of fossil fuels. Also contributing to the greenhouse effect are methane (CH4), whose emissions are mainly linked to livestock farming in agriculture, waste disposal and losses in the energy sector, and nitrous oxide (N2O) deriving mainly from agricultural activities and the energy sector, including transport. The general contribution to the greenhouse effect of F-gases or fluorinated gases (HFCs, PFCs, SF6, NF3) is lower than the aforementioned pollutants and their presence essentially derives from industrial and refrigeration activities. Greenhouse gas emissions are calculated using the IPCC methodology and are all indicated in terms of tonnes of CO2 equivalent by applying the Global Warming Potential (GWP) coefficients of each compound.
The indicator, which represents an estimate of national emissions of greenhouse pollutants and the related sectoral breakdown, has the purpose of verifying the trend in emissions and the achievement of the objectives identified within the United Nations Framework Convention on Climate Change and the Paris Agreement.
United Nations Framework Convention on Climate Change (UNFCCC) 1992
Kyoto Protocol 1997
Law 65/1994 Law 120/2002
CIPE Resolution 123/2002
Law 316/2004 (conversion into law, with amendments, of legislative decree no. 273/2004, containing urgent provisions for the application of Directive 2003/87/EC on the trading of greenhouse gas emission quotas in the European Community)
Legislative Decree 51/2008 “Effort Sharing” Decision 406/2009/EC
Legislative Decree 30/2013 EU Regulation 525/2013
Legislative Decree 111/2015 Paris Agreement 2015
Law 79/2016 EU Regulation 842/2018
EU Regulation 1999/2018 EU Directive 2001/2018
With Law 65/1994, Italy ratified the United Nations Framework Convention on Climate Change (UNFCCC), born in the context of the "Rio Earth Summit" in 1992. The Convention aims to stabilize the concentration of greenhouse gases in the atmosphere at a planetary level at such a level that human activities cannot modify the climate system. The Kyoto Protocol signed in 1997, ratified by Law 120/2002, in force since 2005, constituted the first implementing instrument of the Convention. Italy had a commitment to reduce overall national greenhouse gas emissions by 6.5% compared to 1990, within the period 2008-2012. In Italy, the monitoring of climate-changing gas emissions is guaranteed by ISPRA, through Legislative Decree no. 51 of 7 March 2008 and Legislative Decree no. 30 of 13 March 2013 which provide for the establishment of National System relating to the inventory of greenhouse gas emissions. For the years 2013-2020, the Doha Amendment to the Kyoto Protocol was adopted on 8 December 2012. The EU and its Member States committed to this second phase of the Kyoto Protocol and agreed to reduce collective emissions by 20% below 1990 or other base year levels. A new global agreement was reached in Paris in December 2015, for the period after 2020. The agreement aims to strengthen the global response to the threat of climate change by keeping the global temperature increase well below 2°C above pre-industrial levels, pursuing efforts to limit the temperature increase to 1.5°C; the Paris Agreement entered into force on 4 November 2016. Law 79/2016, ratification and execution of the Doha Amendment to the Kyoto Protocol, defines a national low-carbon development strategy, establishes the national system for policies and measures and projections, defines the monitoring and communication of greenhouse gas emissions and information on climate change. At European level, the objectives for reducing overall greenhouse gas emissions for 2020 have been set by the European Regulation (525/2013), relating to the European Union's Greenhouse Gas Emissions Monitoring Mechanism, and for 2030 by the 2030 Climate-Energy Framework. In particular, the European Union and its member states, within the framework of the United Nations Framework Convention on Climate Change Change, UNFCCC), of the Kyoto Protocol and subsequently under the Doha Amendment to the Kyoto Protocol of 2012 and the Paris Agreement of 2015, have agreed to reduce their collective emissions by 20% by 2020 and 40% by 2030, compared to 1990 levels. In December 2020 the Union's binding climate target for 2030 has been updated and now consists of a net domestic reduction in greenhouse gas emissions (emissions net of removals) of at least 55% compared to 1990 levels by 2030.
ISPRA, 2024. Greenhouse gas emissions in Italy. Reduction objectives for 2030. Reports 399/2024.
ISPRA, Italian Greenhouse Gas Inventory 1990-2024, National Inventory Report 2026.
ISPRA, Quality Assurance/Quality Control Plan for the Italian Emission Inventory, Year 2026.
None
None
ISPRA
ISPRA data from the National Inventory of Atmospheric Emissions https://emissioni. sina. isprambiente. it/interno-nazionale/ were used.
National
1990-2024
The estimate of emissions is carried out as part of the creation of the inventory of atmospheric emissions through the use of appropriate emission factors and/or estimation models. In the graphs and tables, greenhouse gas emissions are expressed as follows: CO2, million tonnes (Mt); CH4 and N2O, thousands of tonnes (kt); F-gas, ton (t). Greenhouse gas emissions are then converted into terms of CO2 equivalent by multiplying the gas emissions by the Global Warming Potential (GWP), global warming potential, in each species in relation to the carbon dioxide potential. As regards greenhouse gases, the reference methodology is that indicated by the IPCC - Intergovernmental Panel on Climate Change (; 2006 IPCC Guidelines for National Greenhouse Gas Inventories; 2019 IPCC refinement to the 2006 IPCC Guidelines for National Greenhouse Gas Inventories). For the description of the estimation methodology, reference is made to the National Inventory Document – NID (https://www. isprambiente. gov. it/it/pubblicazioni/rapporti/italian-greenhouse-gas-inventory-1990-2024-national-inventory-document-2026).
Total greenhouse gas emissions, equal to 362.6 million tonnes of CO2 equivalent, in 2024 show a decrease of 30.2% compared to 1990 and, although exceeding the European target set for 2020, it must be strengthened to reach the new targets for 2030 (Table 2 and Figure 1).
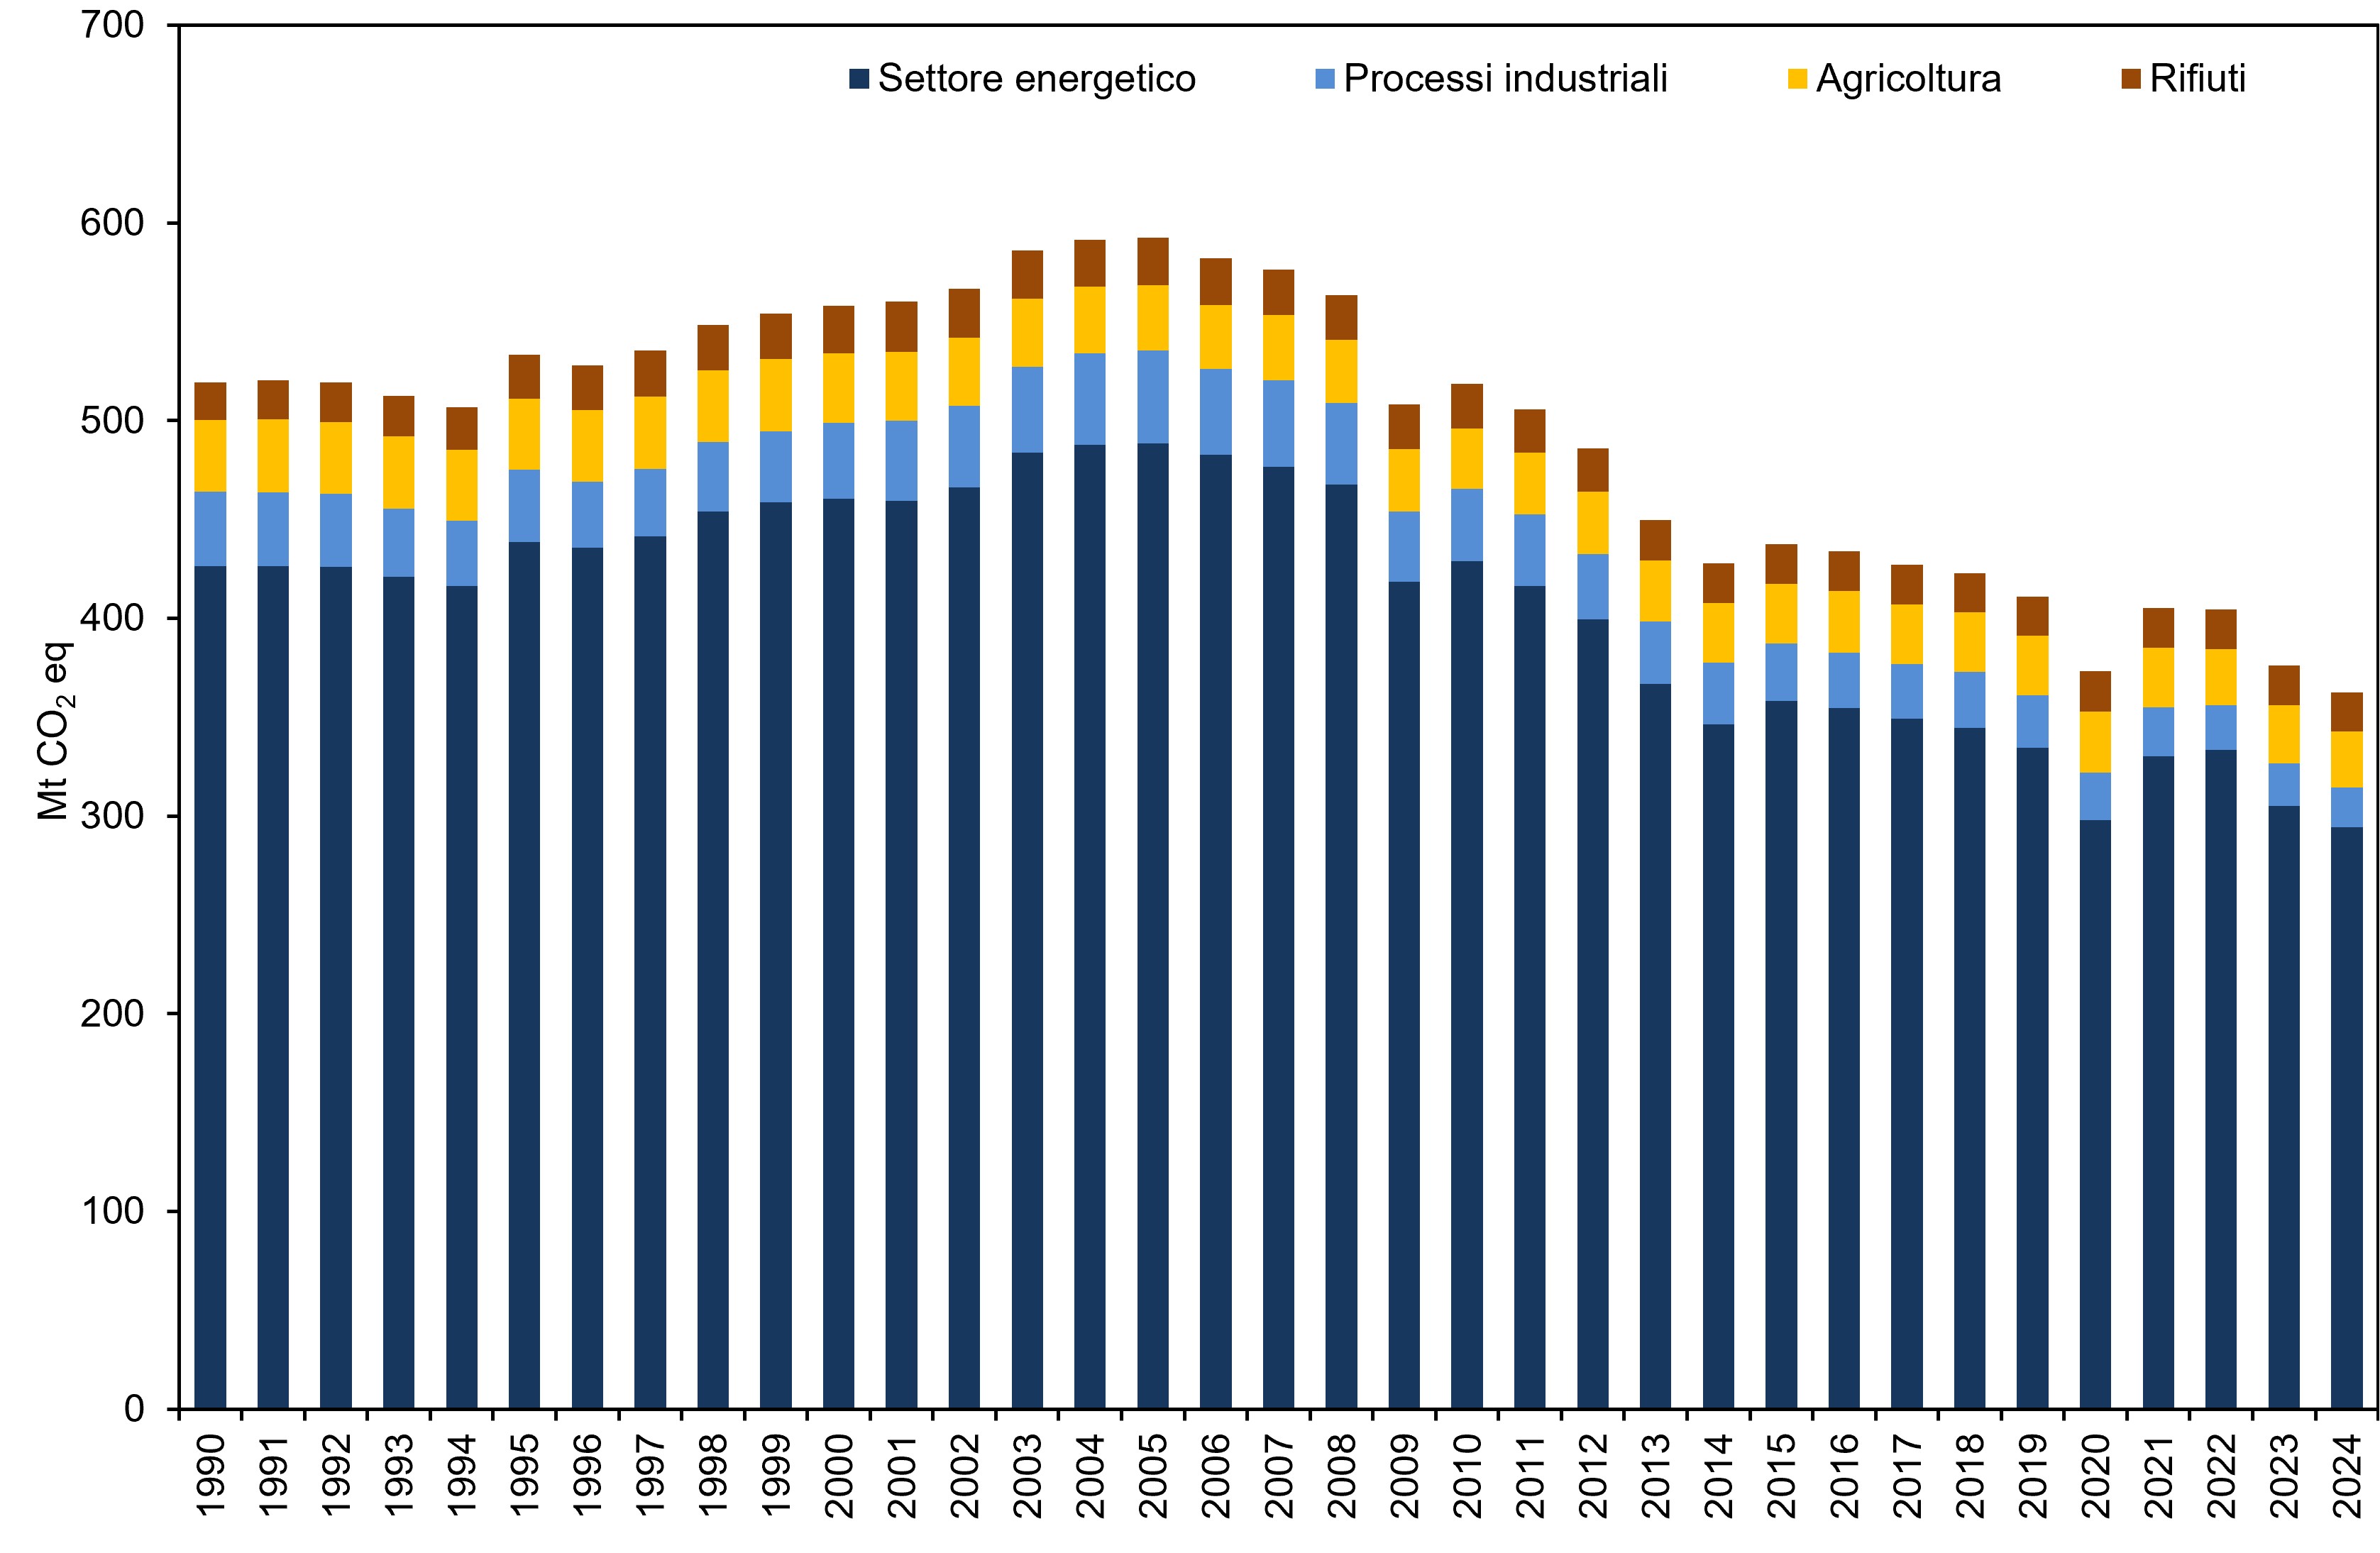
Total greenhouse gas emissions in the period 1990-2024 go from 519.2 to 362.6 million tonnes of CO2 equivalent. The trend is mainly determined by the energy sector and therefore by CO2 emissions which represent 81.2% of the total in 2024) (Table 3 and Figure 1); a decrease is also recorded for methane and nitrous oxide, while F-gases have shown growth since 1990 (Table 2).
| Data |
|---|
Headline
Table 1. National CO₂ emissions by sector Data source
ISPRA Note
Emission values have been updated in line with the annual update of the national emission inventory. |
Headline
Table 3. National greenhouse gas emissions in CO₂ equivalent, by gas and sector Data source
ISPRA Note
Emission values have been updated in line with the annual update of the national emission inventory. |
Thumbnail
Headline
Figure 1. National greenhouse gas emissions, expressed as CO₂ equivalent, by IPCC sector Data source
ISPRA Note
Emission values have been updated in line with the annual update of the national emission inventory. |
Thumbnail
Headline
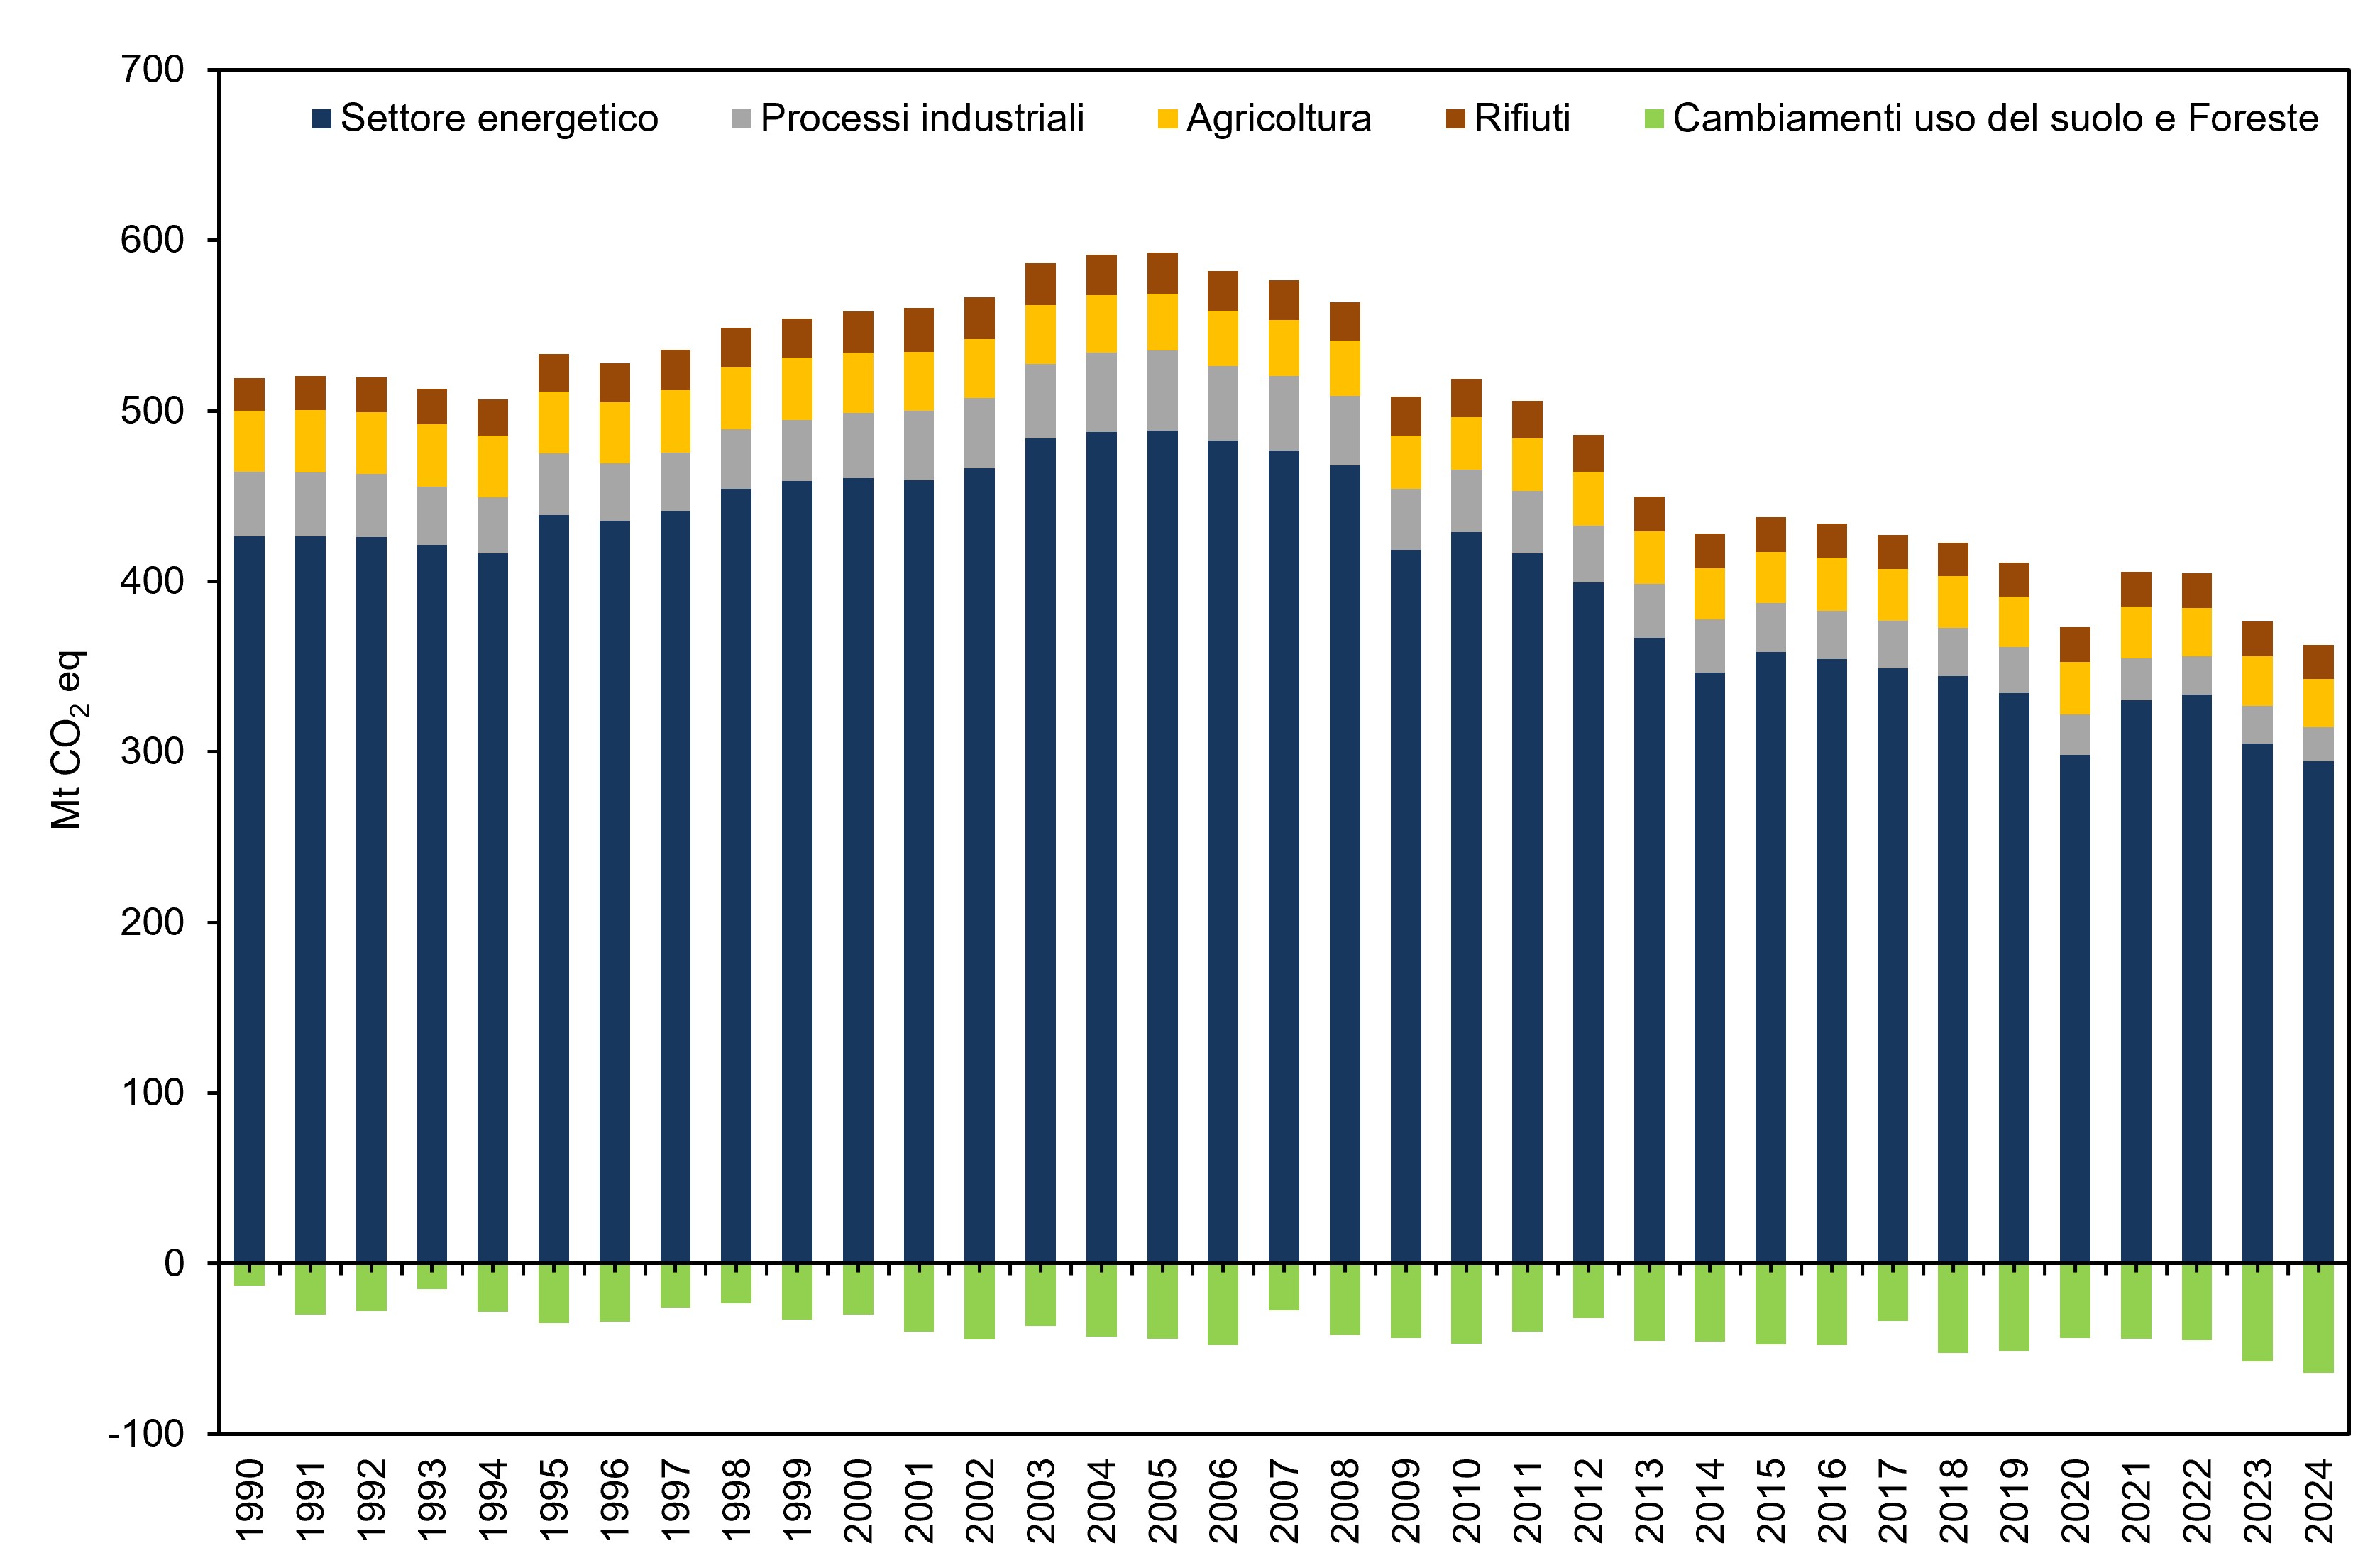
Figure 2: National greenhouse gas emissions, expressed as CO₂ equivalent, by IPCC sector (including LULUCF) Data source
ISPRA Note
Emission values have been updated in line with the annual update of the national emission inventory. |
Thumbnail
Headline
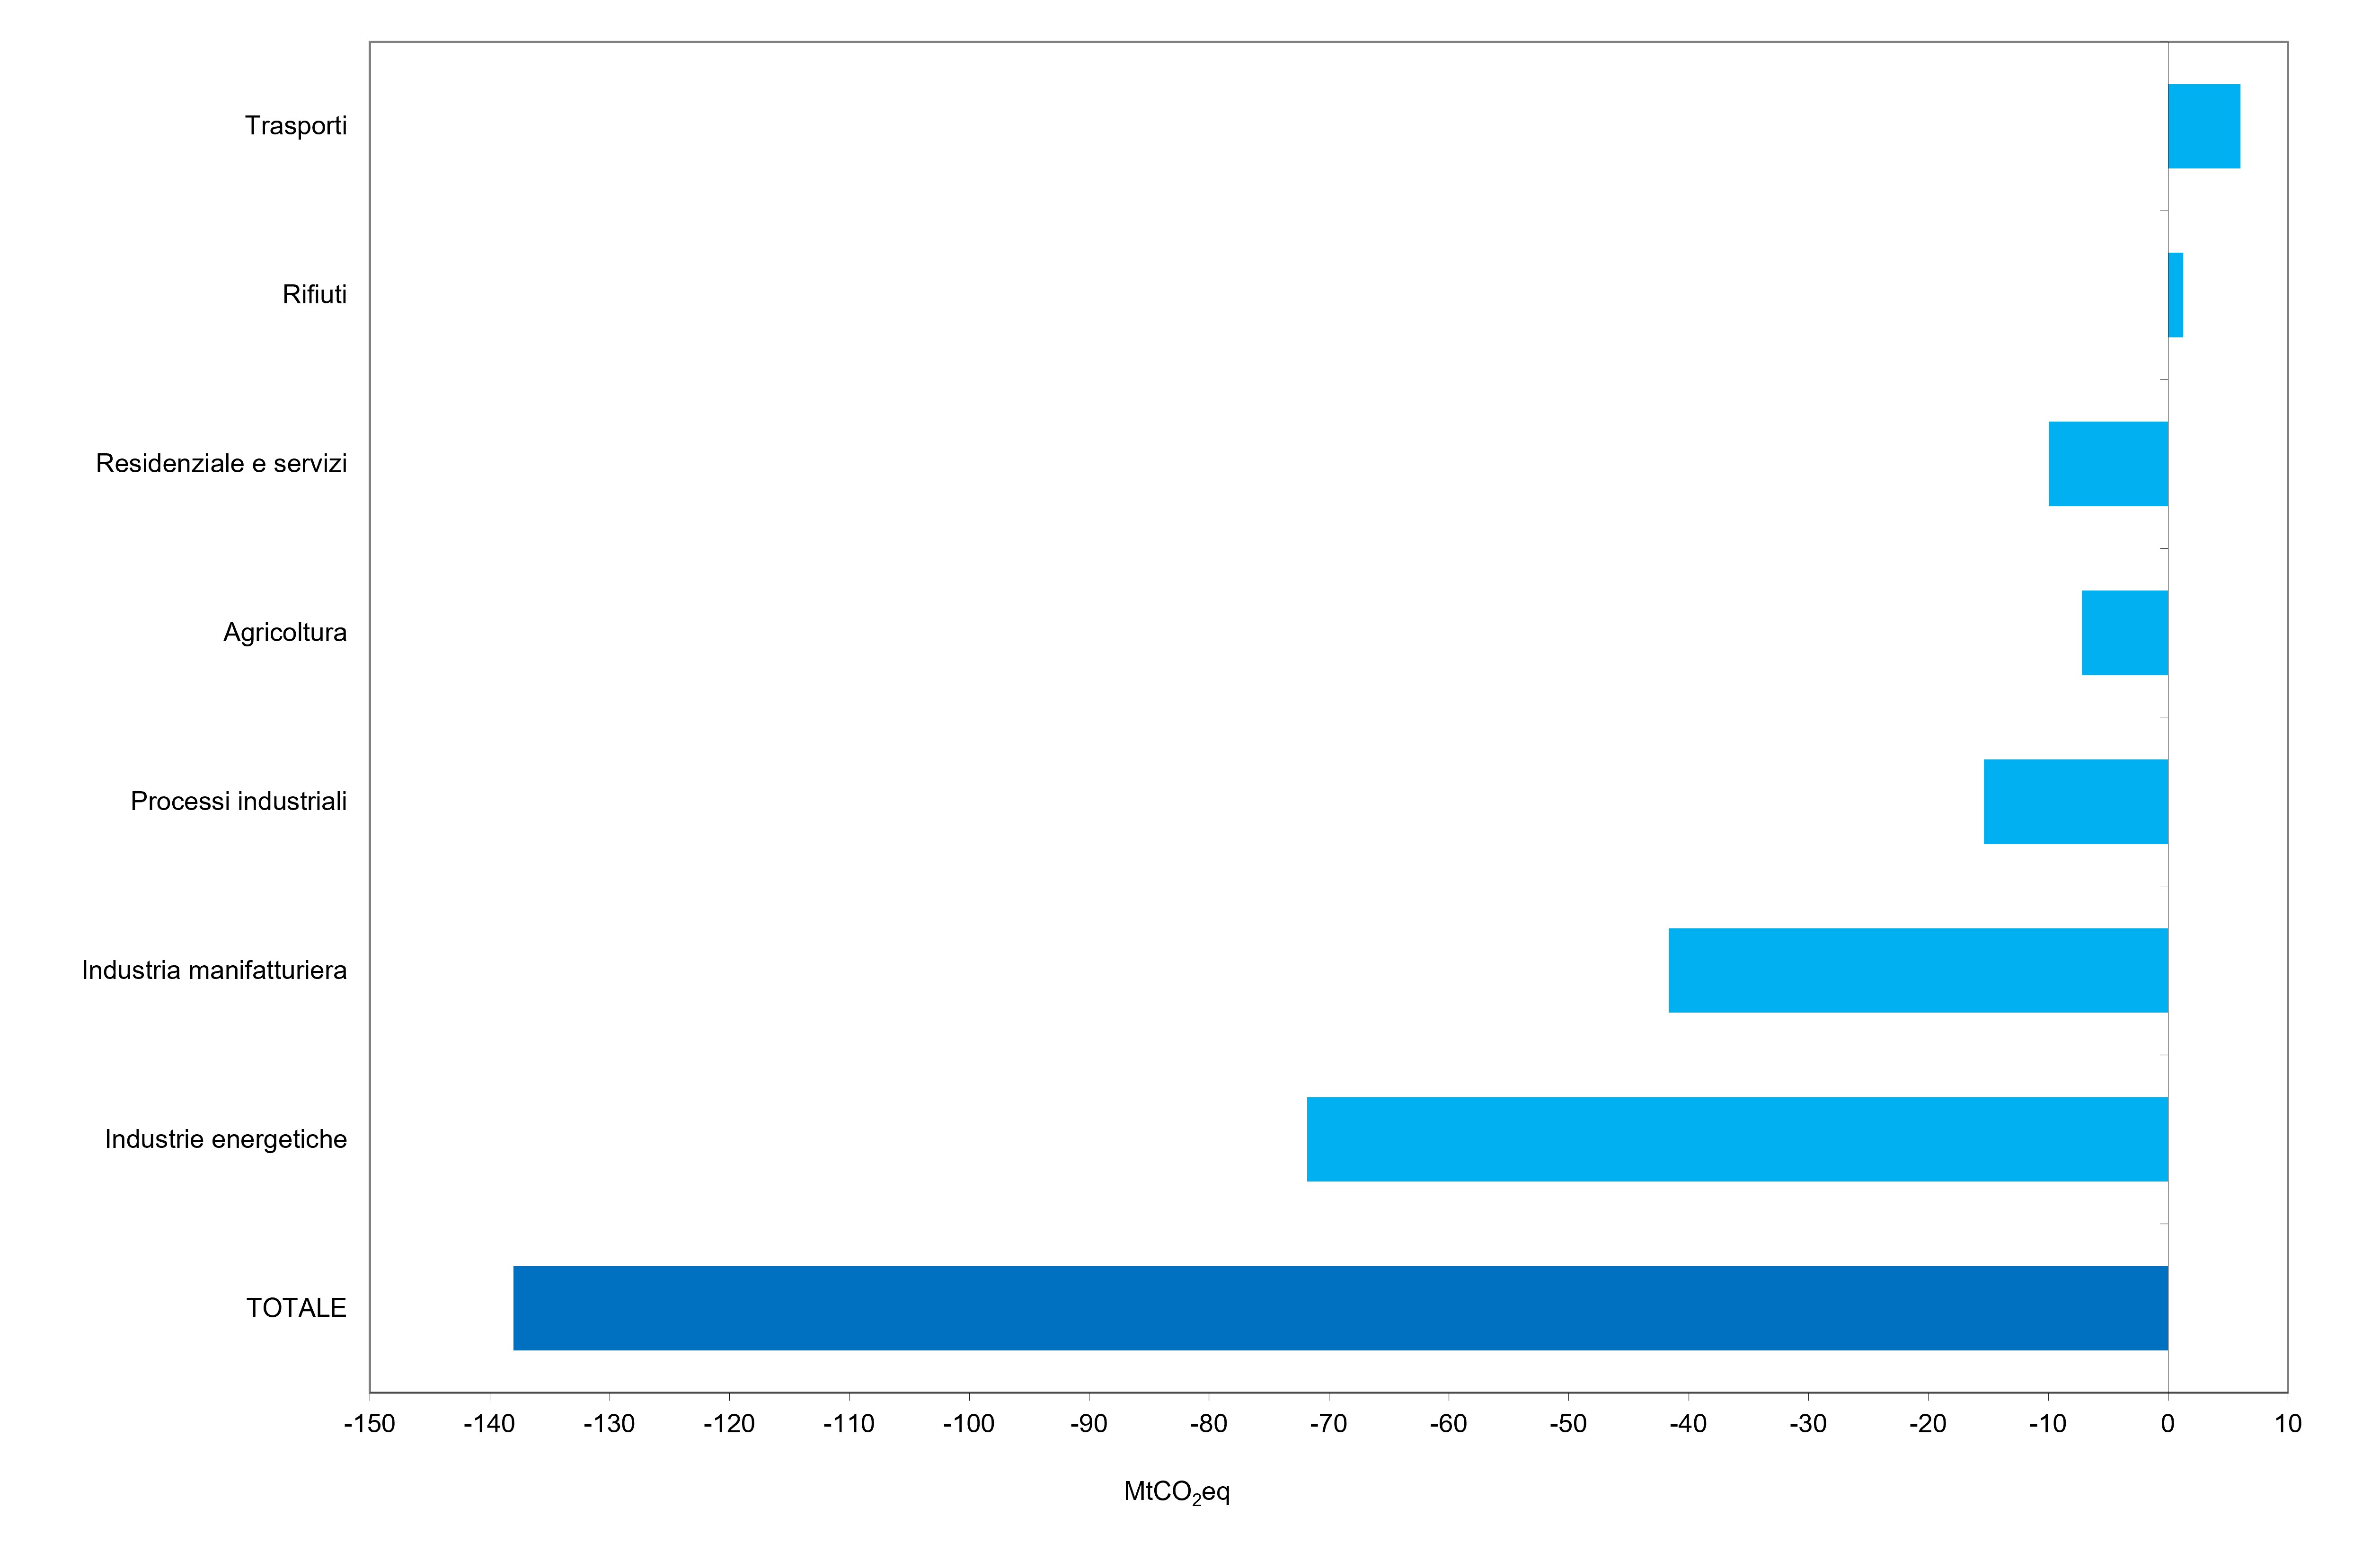
Figura 4: Variazioni 1990-2024 delle emissioni nazionali di gas-serra per settore Data source
ISPRA Note
I valori di emissione sono stati aggiornati coerentemente con l'aggiornamento annuale dell'inventario nazionale delle emissioni. |
Headline
Table 2. National greenhouse gas emissions, expressed as CO₂ equivalent, by gasa Data source
ISPRA Data legend
LULUCF: Land use, land-use change and forestry; CO₂: carbon dioxide; CH₄: methane; N₂O: nitrous oxide; F-gases: fluorinated gases Note
Emission values have been updated in line with the annual update of the national emission inventory. |
Thumbnail
Headline
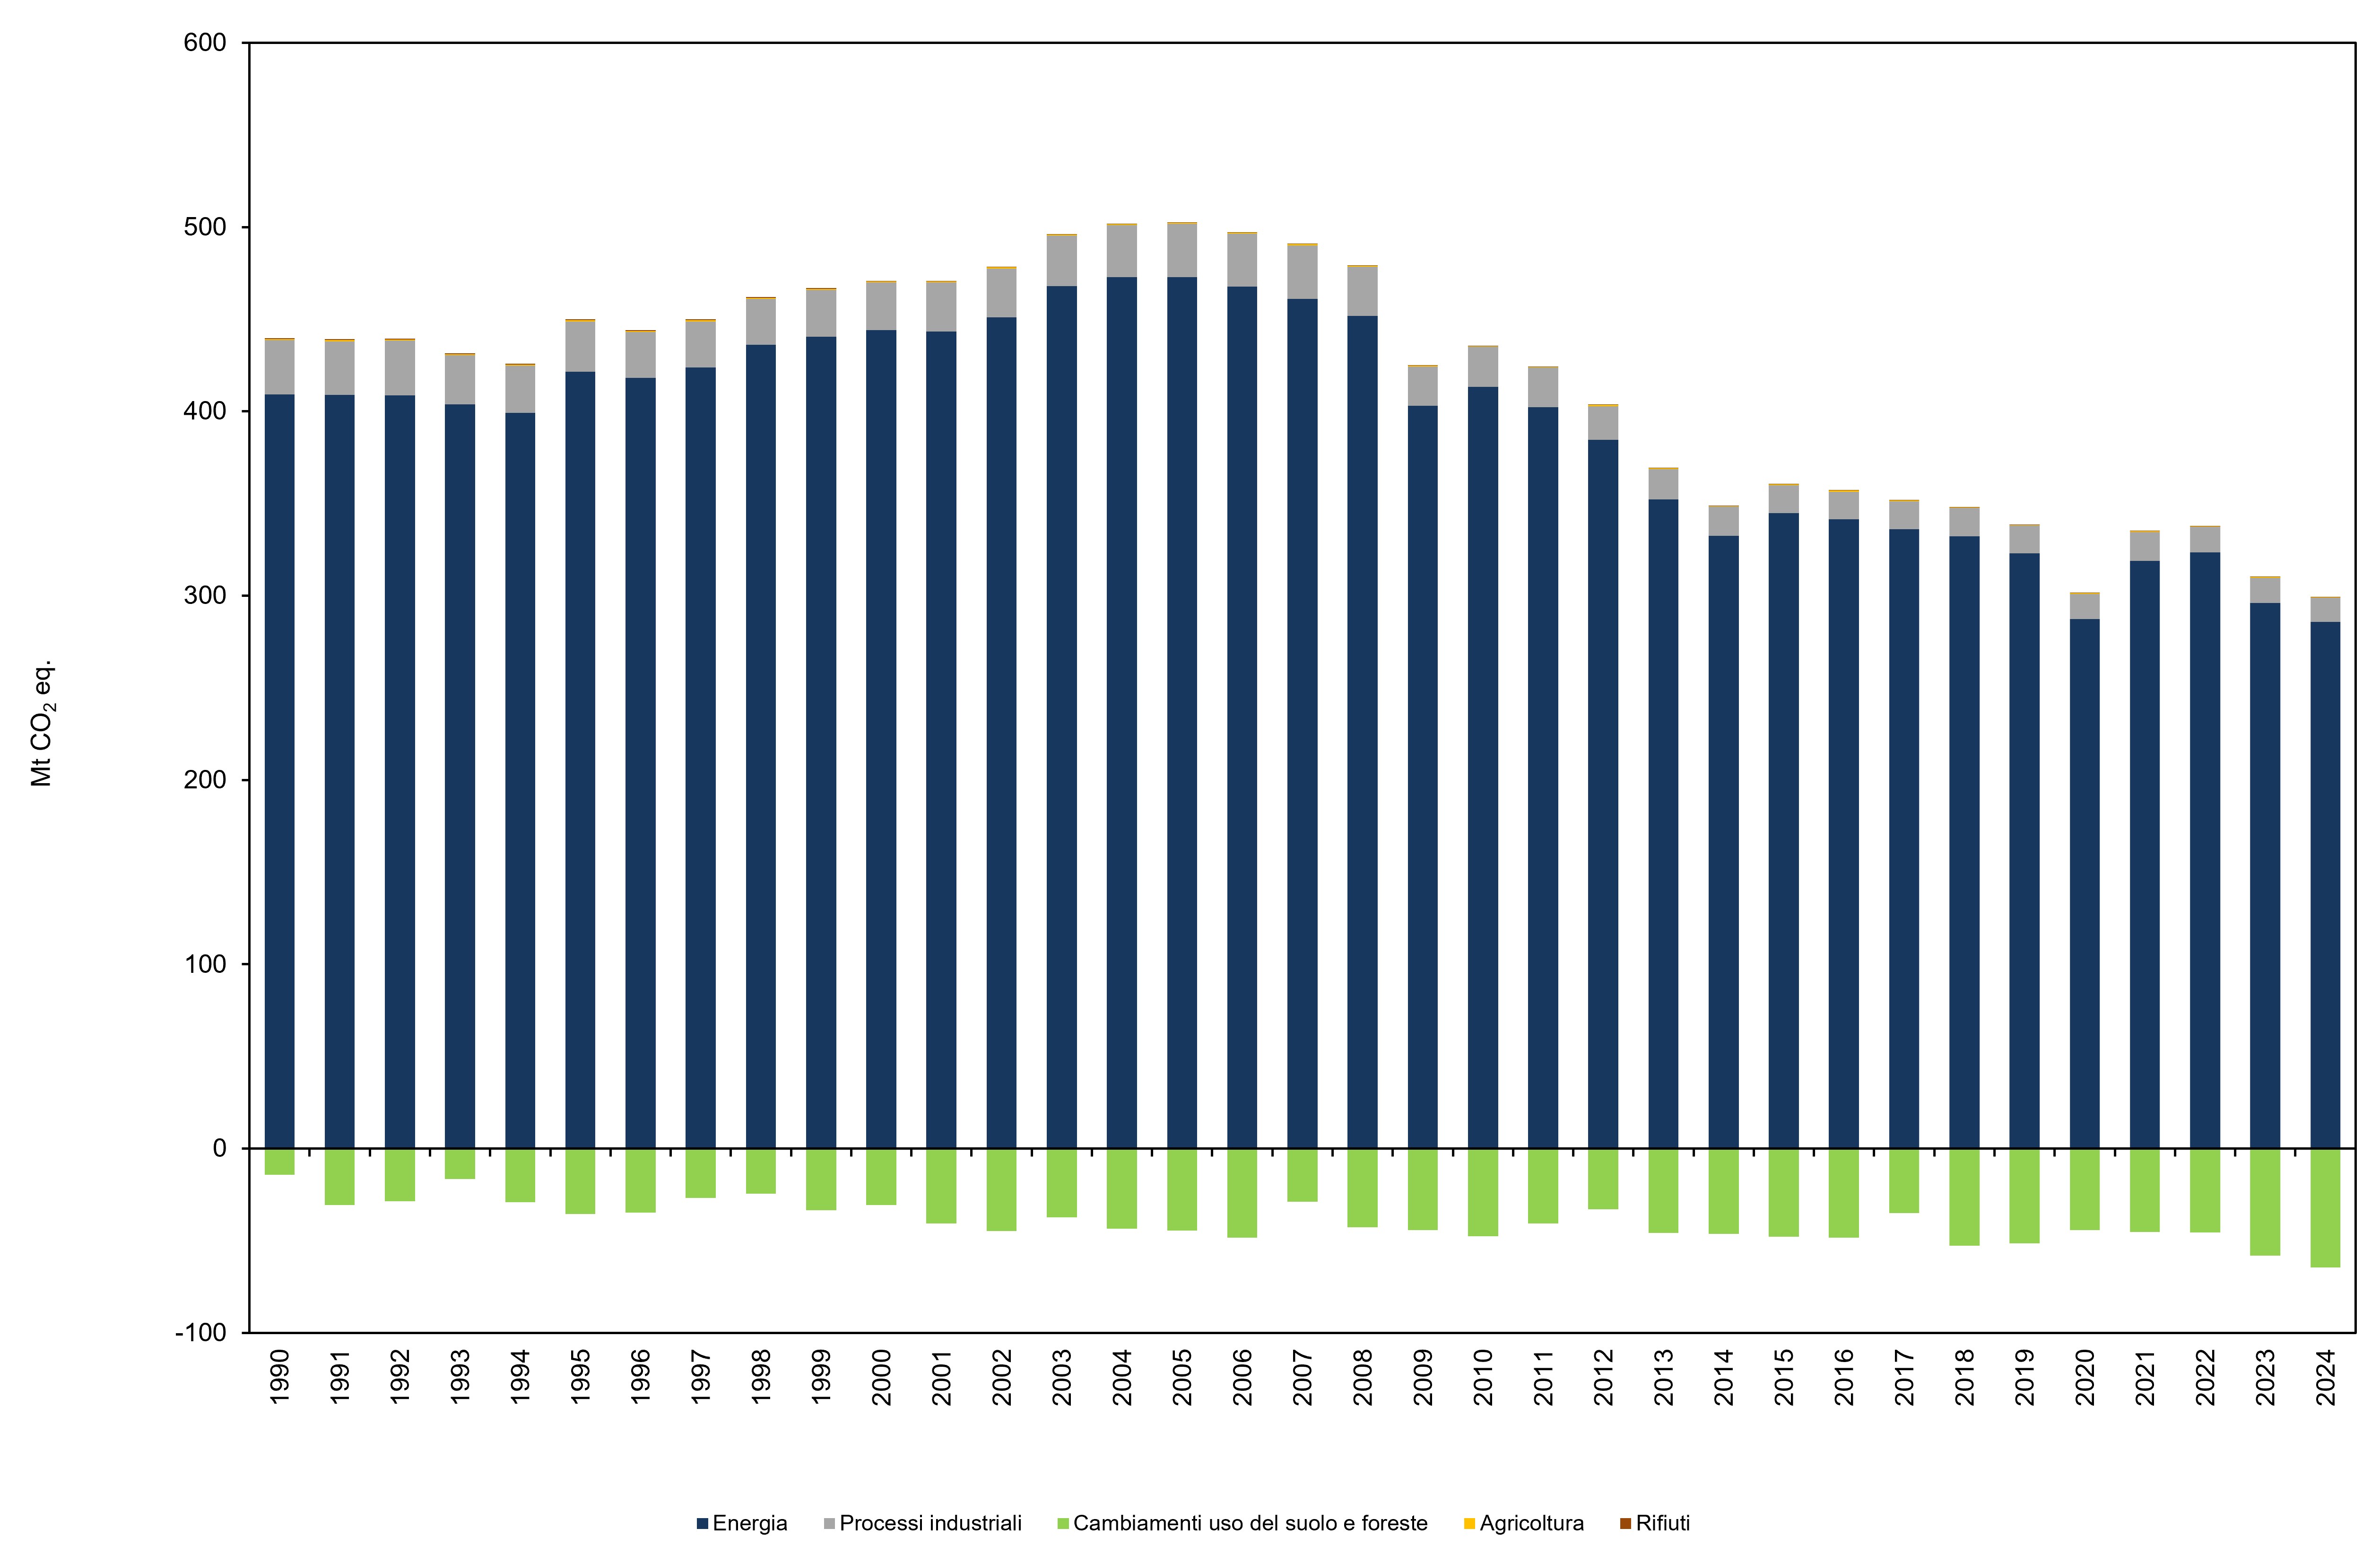
Figure 3. National CO₂ emissions by IPCC sector Data source
ISPRA Note
Emission values have been updated in line with the annual update of the national emission inventory. |
The emission data reported constitute the official reference source for verifying the commitments undertaken at an international level, due to ISPRA's role as responsible for the annual creation of the national inventory of atmospheric emissions. To ensure the coherence and comparability of the inventory, the annual update of emissions involves the revision of the entire historical series on the basis of greater information and the most recent methodological developments. The data presented is based on sectoral disaggregation with reference to the IPCC Guidelines for National Greenhouse Gas Inventories. Emissions are presented both for single gas and in aggregate, expressed in terms of CO2 equivalent, reporting them both at total level and disaggregated at IPCC sector level. The percentage compositions of the substances that make up greenhouse gases do not undergo profound variations over the entire period 1990-2024. This is especially true for carbon dioxide and methane, which in 2024 weigh respectively 82.4% and 11.8% of the total, while nitrous oxide and F-gases weigh approximately 3.8% and 2% of the total greenhouse gases respectively). Carbon dioxide emissions, which characterize the overall trend of greenhouse gases, showed an increasing trend until 2007 and then decreased in the following years with a marked reduction in 2009 (Table 1, Figure 3). CH4 emissions without LULUCF (Land Use, Land-Use Change and Forestry) have decreased overall by 21.8% since 1990, while N2O emissions by 39% (Table 2). As regards F-gas emissions, strong growth has been noted since 1997; since the end of the 1990s, these compounds have predominantly consisted of HFCs (Tables 2 and 3). Greenhouse gas emissions are mainly attributable to the energy sector (in 2024 the weight on the total is equal to 81.2%). In 2024, greenhouse gas emissions from industrial processes and the waste sector will account for 5.5% of the total, while the agriculture sector will contribute 7.7% to the total (Table 3, Figure 1). As can be seen from Table 3, the largest contributions for CH4 emissions come from agriculture and waste, while for N2O from the agricultural sector. Considering also the estimates and absorptions from the LULUCF sector in the national totals, total greenhouse gas emissions decrease by 30.2% from 1990 to 2024 (Table 2 and Figure 2). In this case it must be considered that the trend of the carbon stock, in the period 1990-2024, is strongly conditioned by the reduction in absorption of greenhouse gases connected to the surfaces covered annually by fires.