Angelo Santini, Fabio Tatti
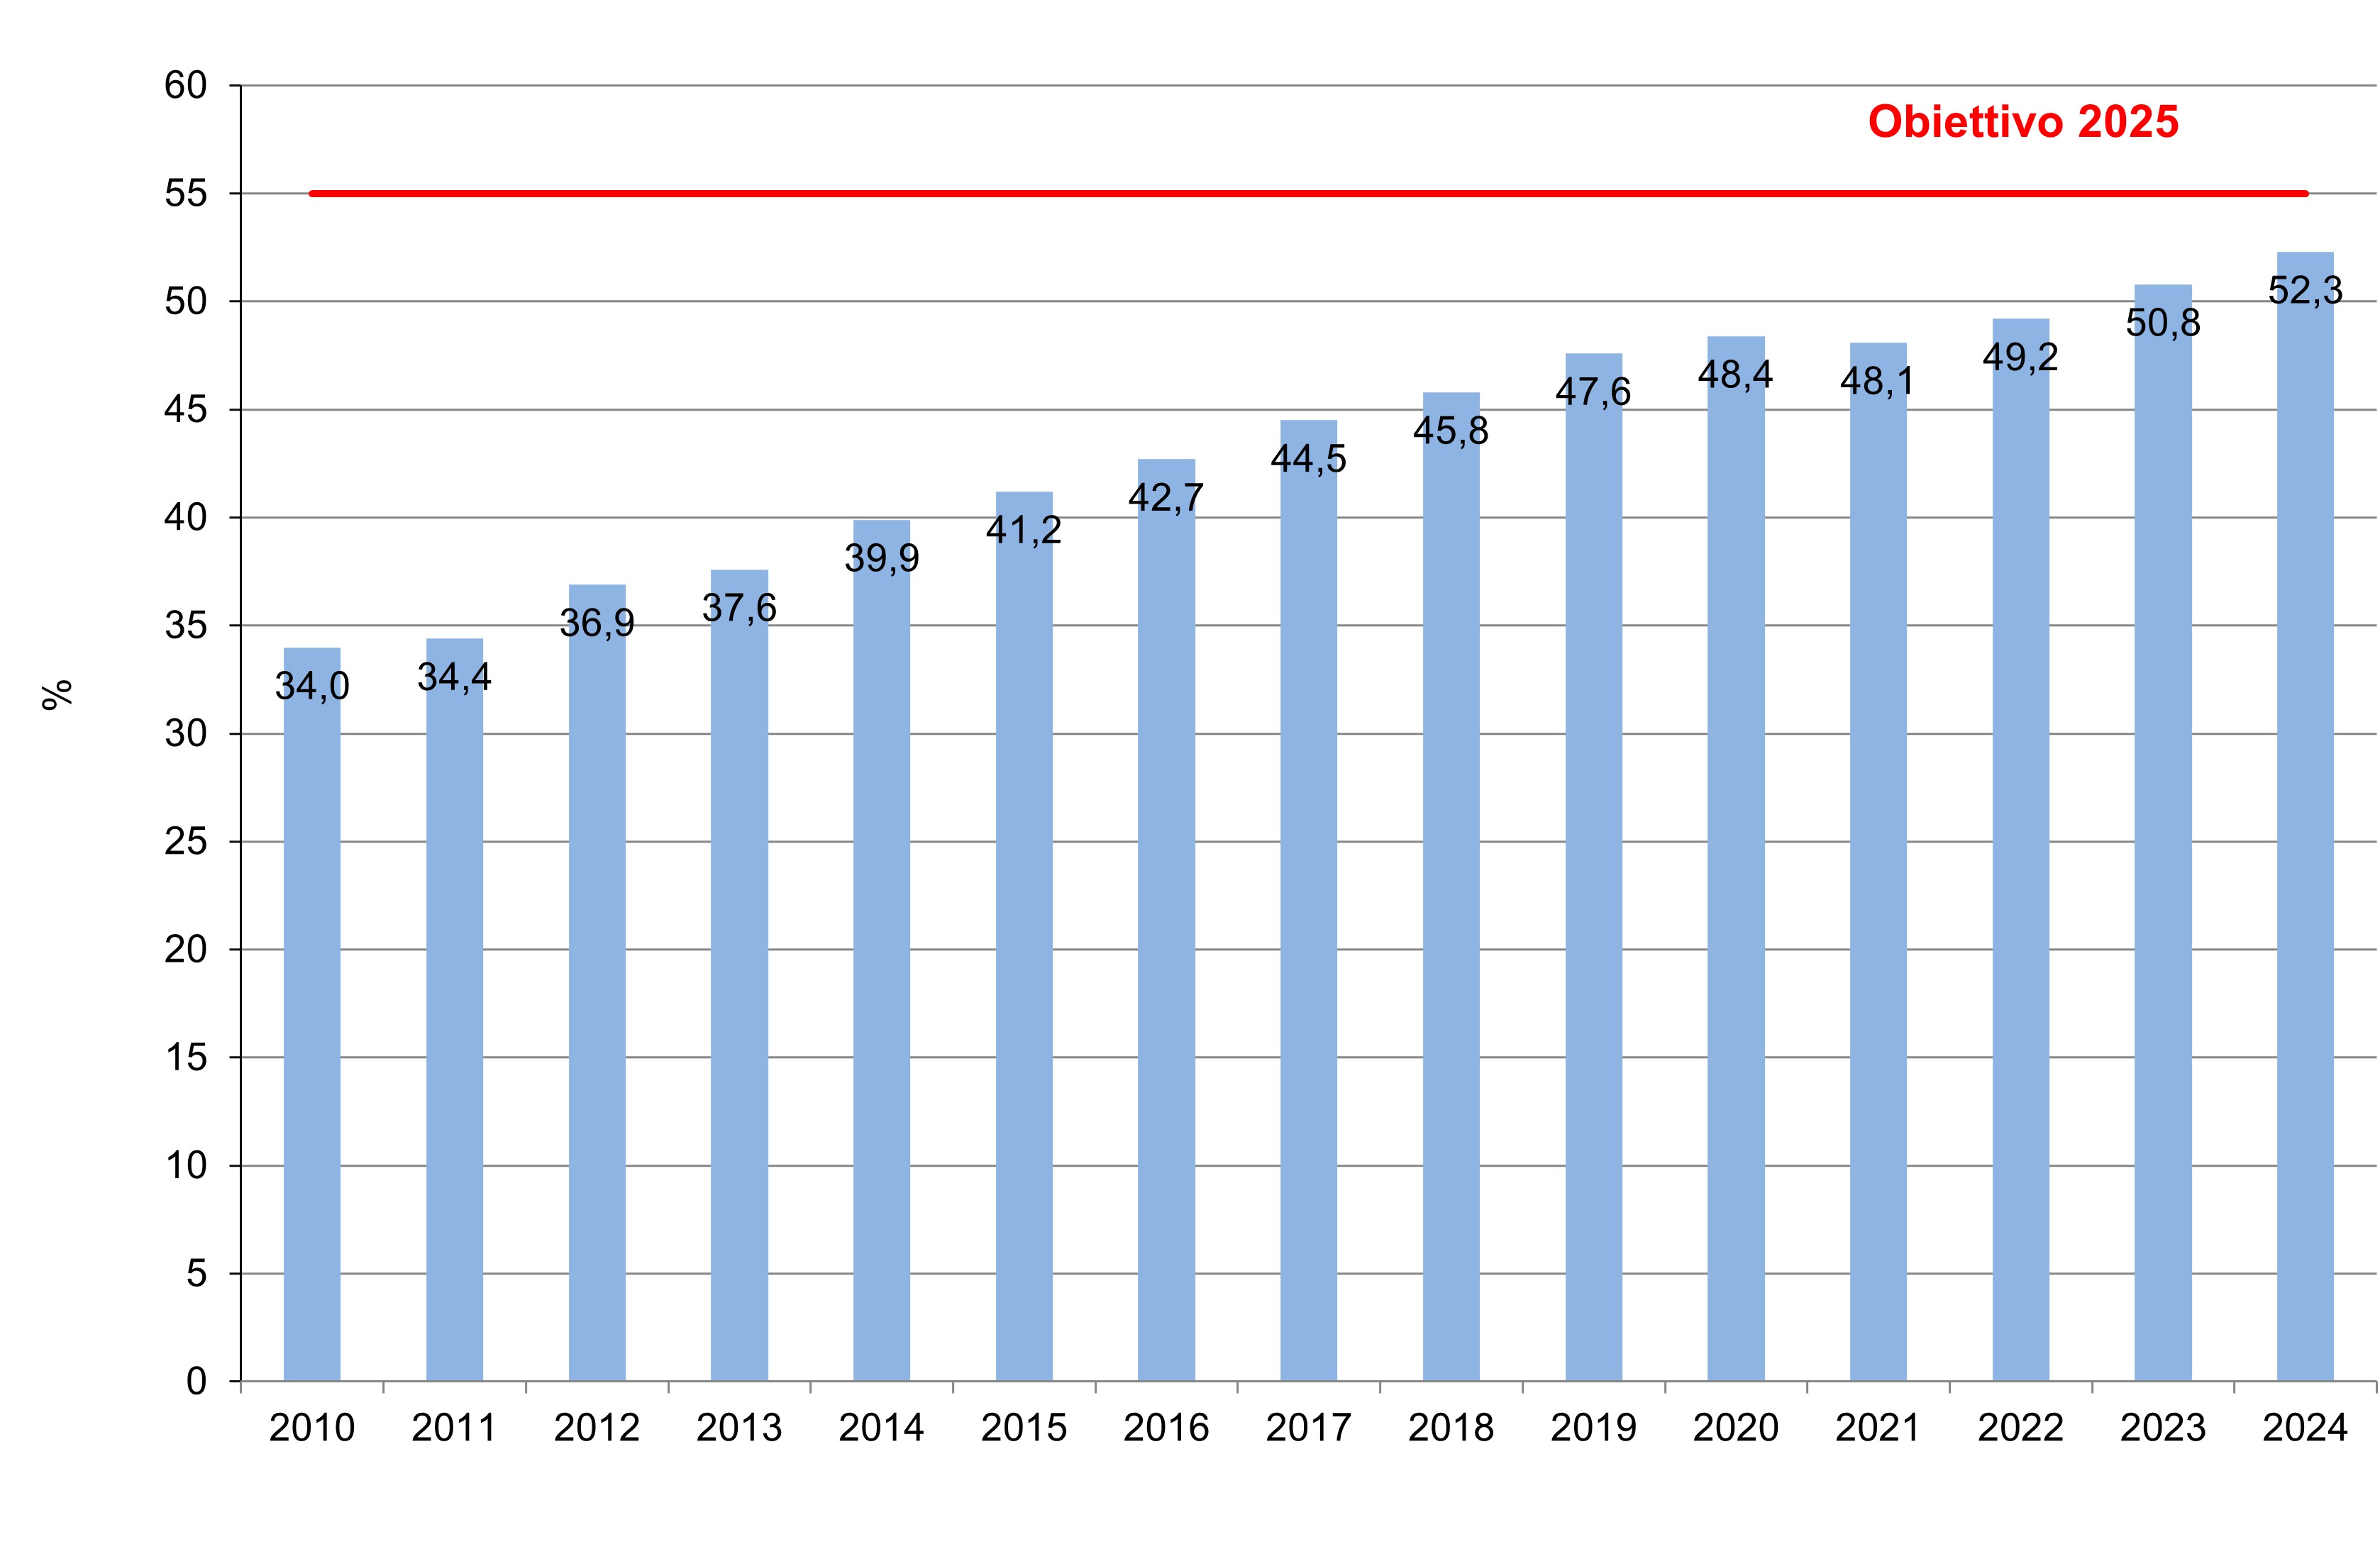
In 2024, the preparing for re-use and recycling rate, calculated using Method 4 and excluding C&D waste from households, stood at 52.3%, thus exceeding the target set for 2020 (50%).
The indicator measures the ratio between the quantities of municipal waste prepared for re-use or recycled in a given year and the quantities generated in the same year, according to calculation Method 4 established by Commission Decision 2011/753/EU.
To verify achievement of the statutory target for the preparing for re-use and recycling of municipal waste.
Directive 2008/98/EC, transposed into Italian law by Legislative Decree No. 205/2010, which introduced recycling targets into Article 181 of Legislative Decree No. 152/2006, initially set a target for the preparing for re-use and recycling of municipal waste of 50% by weight to be achieved by 2020. Pursuant to Article 11(2) of the Waste Framework Directive, this target applies at least to “paper, metal, plastic and glass from households and possibly from other origins, insofar as these waste streams are similar to waste from households”.
With the adoption of Directive (EU) 2018/851, additional targets for preparing for re-use and recycling were introduced, to be achieved by 2025 (55%), 2030 (60%) and 2035 (65%). These three new targets do not refer to specific material fractions but apply to the total amount of municipal waste. Consequently, the possibility of choosing among different calculation options no longer applies, and a single methodology, Method 4, must be adopted.
The rules for calculating achievement of the targets are laid down in Article 11a of Directive 2008/98/EC, as amended by Directive (EU) 2018/851. To ensure uniform conditions for calculating the new targets, Commission Implementing Decision (EU) 2019/1004 was adopted.
For monitoring the 50% target for 2020, referred to in Article 11(2)(a) of Directive 2008/98/EC, the previous calculation methodologies remain applicable. The new targets and the related calculation rules were transposed into Italian law by Legislative Decree No. 116/2020, which introduced the targets into Article 181 of Legislative Decree No. 152/2006, where the 2020 target was already included, and the calculation rules into Article 205-bis.
ISPRA, Rapporto Rifiuti urbani (various editions)
To further investigate information on waste treatment processes in order to assess the incidence of rejects generated by such processes. Where relevant, rejects must be excluded from the calculation of the preparing for re-use and recycling rate.
To acquire a consolidated dataset on the average material composition of municipal waste generated in different territorial contexts.
ISPRA, Italian Institute for Environmental Protection and Research.
The data derive from processing and estimates carried out on the basis of information on municipal waste generation, collection and management. These data are freely accessible and downloadable from the website https://www.catasto-rifiuti.isprambiente.it
National
2010-2024
The indicator measures the ratio between the quantities of municipal waste prepared for re-use or recycled in a given year and the quantities generated in the same year, according to calculation Method 4 established by Decision 2011/753/EU.
The data relating to the different components of the calculation formula are processed through the following procedures:
For fractions from multi-material separate collection, rejects are already separated by ISPRA in order to quantify the amount of the individual fractions composing this collection stream. According to the new criteria for calculating municipal waste generation and collection set out in the Decree of 26 May 2016, multi-material collection is accounted for as a whole, gross of the reject fraction. Irrespective of the calculation methods applied to quantify separate collection, rejects must be excluded for the purposes of calculating recycling targets; therefore, multi-material collection must be considered net of this component. In this regard, it should be noted that other fractions included in the calculation of separate collection under the new criteria introduced by the above-mentioned decree, particularly construction and demolition waste, do not contribute, under EU legislation, to the achievement of municipal waste recycling targets, but rather to the specific targets set for C&D waste.
For single-material collection, the percentage distributions by quality class assigned by CONAI and the sectoral Consortia are applied, together with the corresponding rejects. It should be noted that each quality class indicated by the Consortia is associated with a range within which the percentage of foreign material, referred to here as reject, must fall or, in the case of the first quality class, with a maximum value, and, for the last class, with a minimum value.
In the simulations, the following reference values were assumed for the reject indices:
- First quality class: in the absence of detailed data on reject percentages, a constant reject index was used, equal to the maximum admissible content of foreign material for assigning the waste to that class. This assumption may lead to a partial overestimation of rejects.
- Intermediate classes: in the absence of detailed data on reject percentages, a constant reject index equal to the midpoint value was used for each class.
- Last class: in the absence of detailed data on reject percentages, a constant reject index was used, equal to the minimum content of foreign material required for assigning the waste to that class.
This assumption may lead to a partial underestimation of rejects. For the organic fraction, the processing was not carried out on the basis of separate collection data, but by directly using the input values to composting and anaerobic digestion plants, net of rejects from treatment processes.
For WEEE, the percentage to which the reject rate, non-WEEE, is applied, identified for each collection group, refers to the share indicated by the WEEE Coordination Centre.
The quantities from mechanical-biological treatment processes of mixed municipal waste destined for material recovery operations were also counted as recycled.
In 2024, the preparing for re-use and recycling rate stood at 52.3%, thus exceeding the target set for 2020 (50%) when calculated using Method 4 and excluding C&D waste from households. However, this rate remains below the target set for 2025 (55%).
The trend of the indicator is positive, showing an increase over time in the recycling rate achieved at national level. In particular, between 2010 and 2024, an increase of 18.3 percentage points was observed when applying calculation Method 4 (Figure 1).
| Data |
|---|
Headline
Table 1: Average material composition of municipal waste estimated by ISPRA (average for the period 2009-2024) Data source
ISPRA |
Thumbnail
Headline
Figure 1: Recycling rates obtained from calculation simulations according to Method 4 Data source
ISPRA |
Thumbnail
Headline
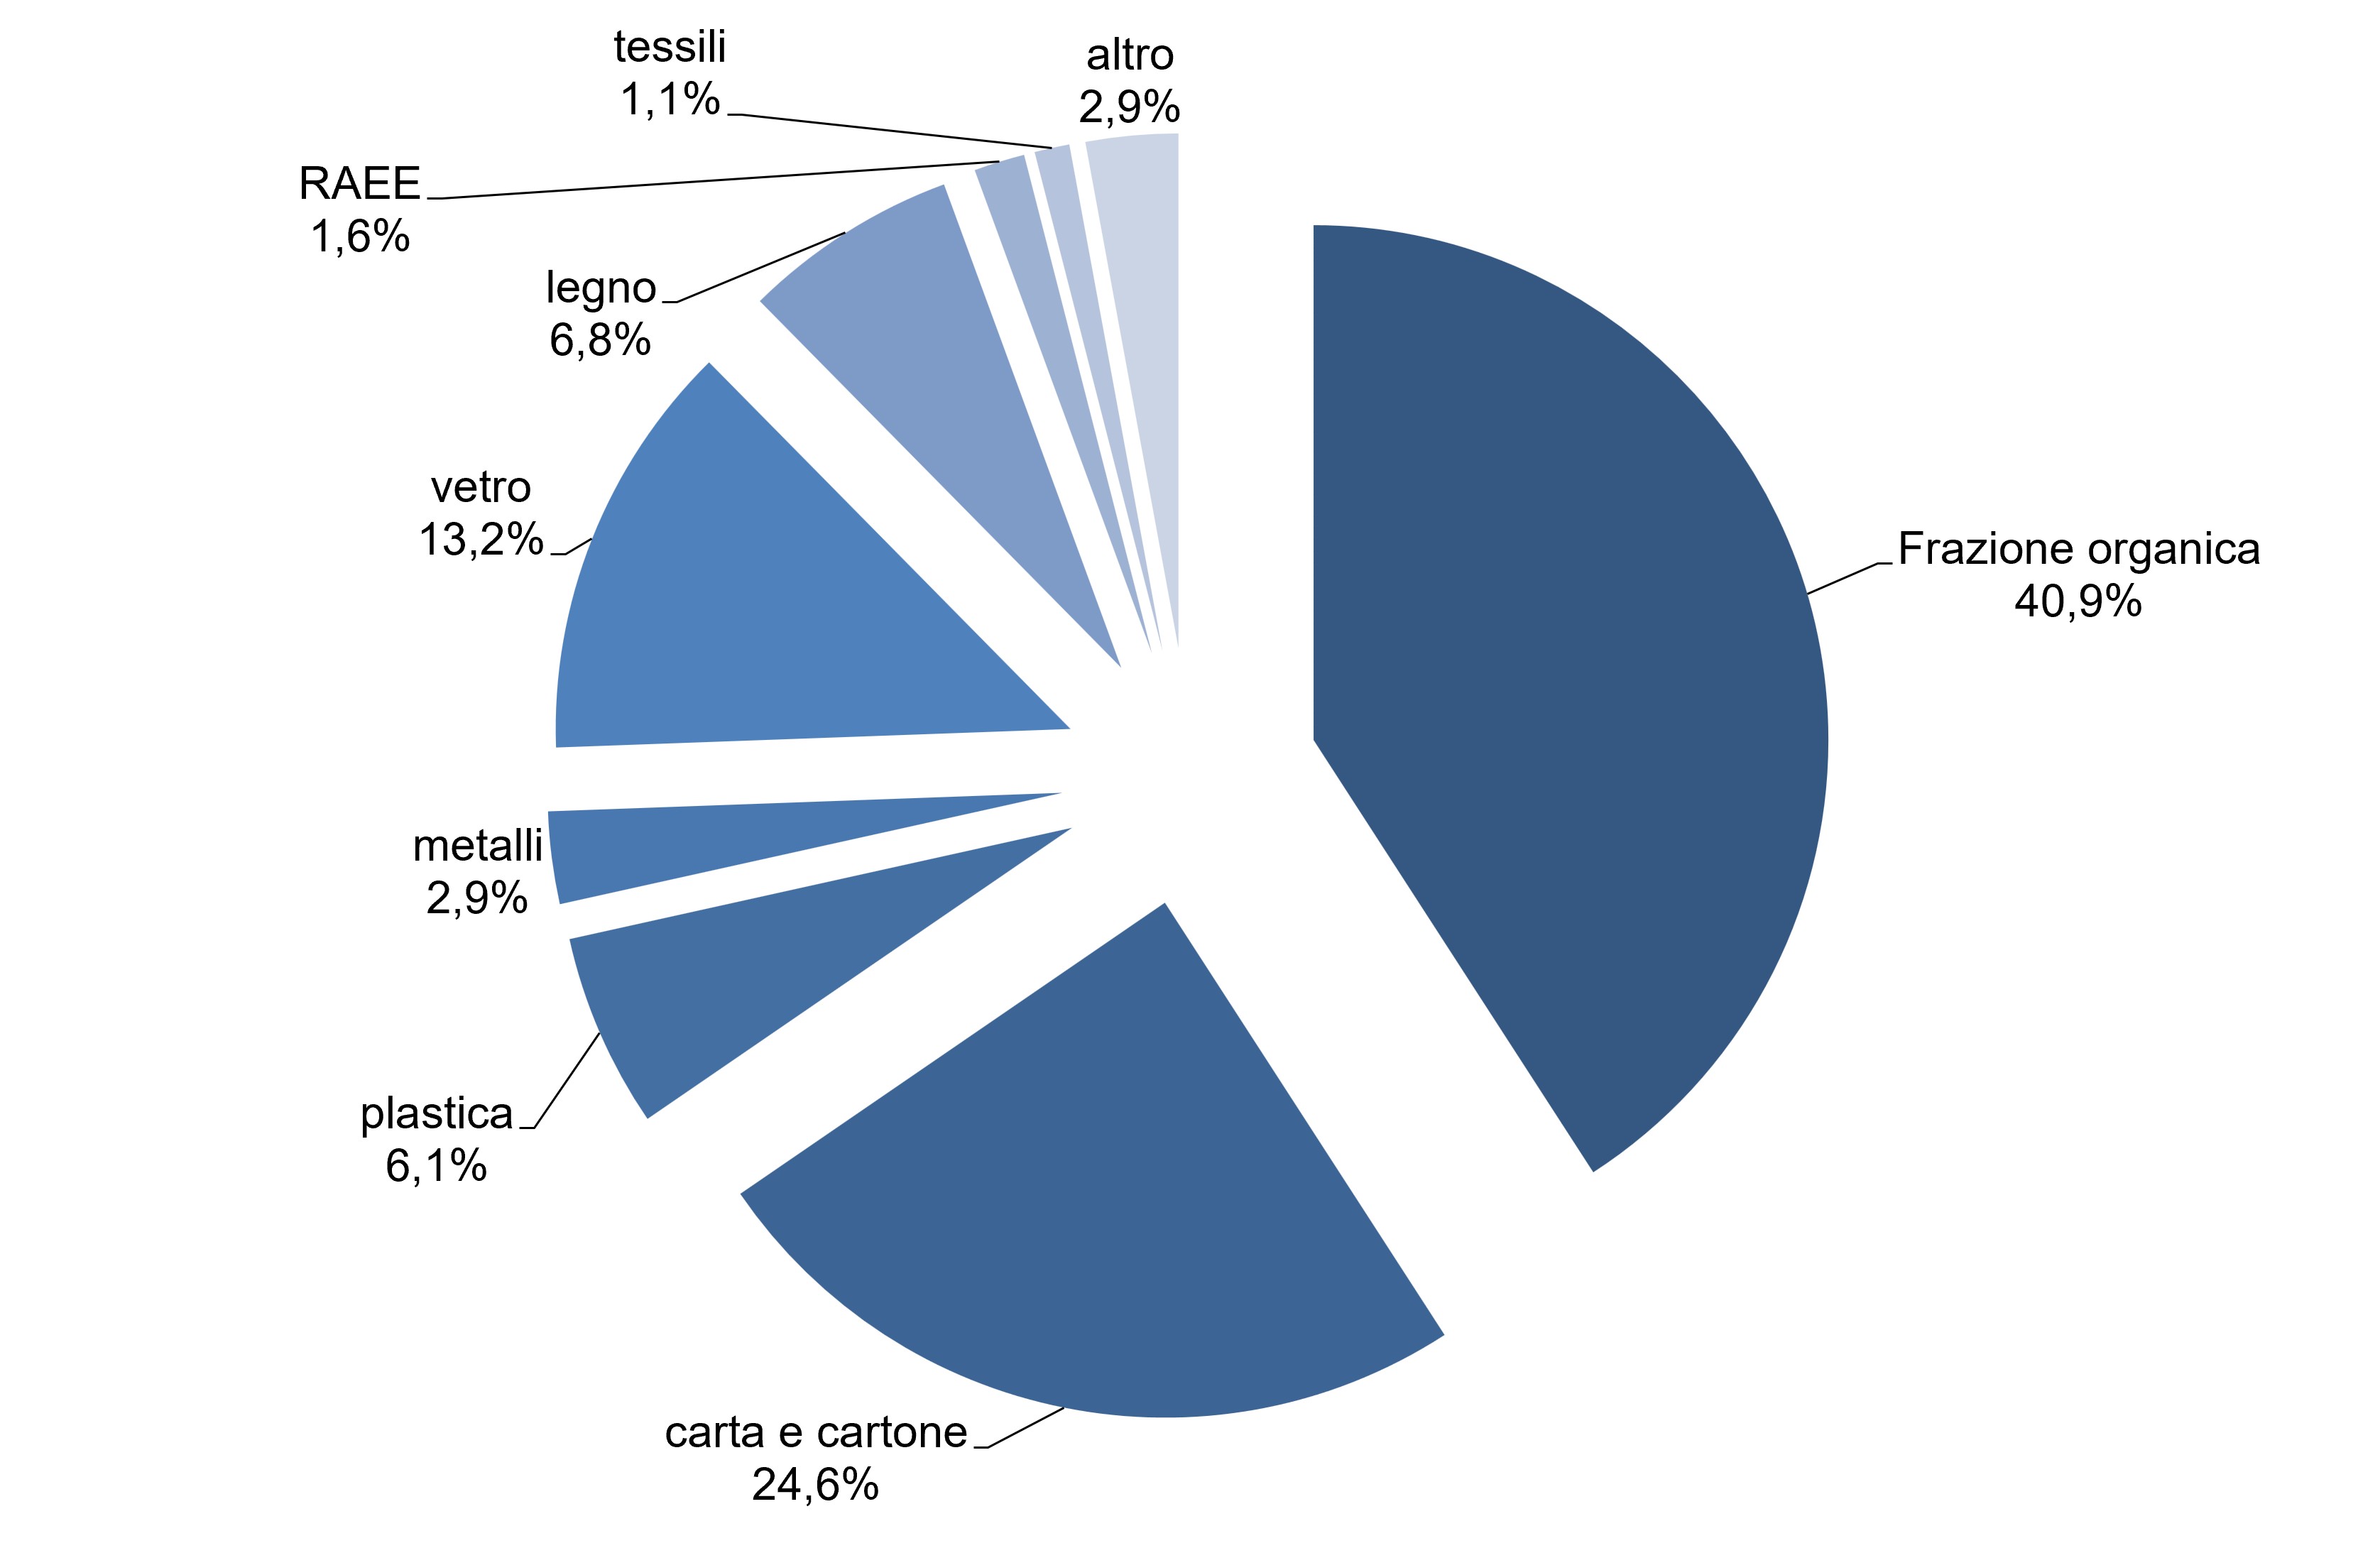
Figure 2: Percentage breakdown of the quantity of municipal waste sent for recycling (2024) Data source
ISPRA |
The indicator is explicitly required by specific European Union regulatory provisions and is intended to assess the effectiveness of the measures implemented by Member States to ensure compliance with the European waste hierarchy, as well as to monitor progress in the transition towards a circular economy.
Analysis of the breakdown of the quantity sent for recycling by material fraction shows that 40.9% consisted of the organic fraction, compared with 41.2% in 2023, while 24.6% consisted of paper and cardboard, compared with 24.4% in 2023. Glass accounted for 13.2% of the total recycled amount, wood for 6.8% and plastics for 6.1% (Figure 2).
According to ISPRA estimates for the period 2009-2024, the latest year for which data from material composition analyses are available, at national level almost 35% of the waste generated annually consists of the organic fraction, comprising biodegradable waste from kitchens and canteens and waste from the maintenance of gardens and parks. A share slightly below 22% consists of paper and cardboard, while just over 11% consists of plastic materials (Table 1).