Piero Fraschetti, Francesca Lena, Walter Perconti, Emanuela Piervitali, Giulio Settanta
The indicator describes the trend of mean temperature in Italy.
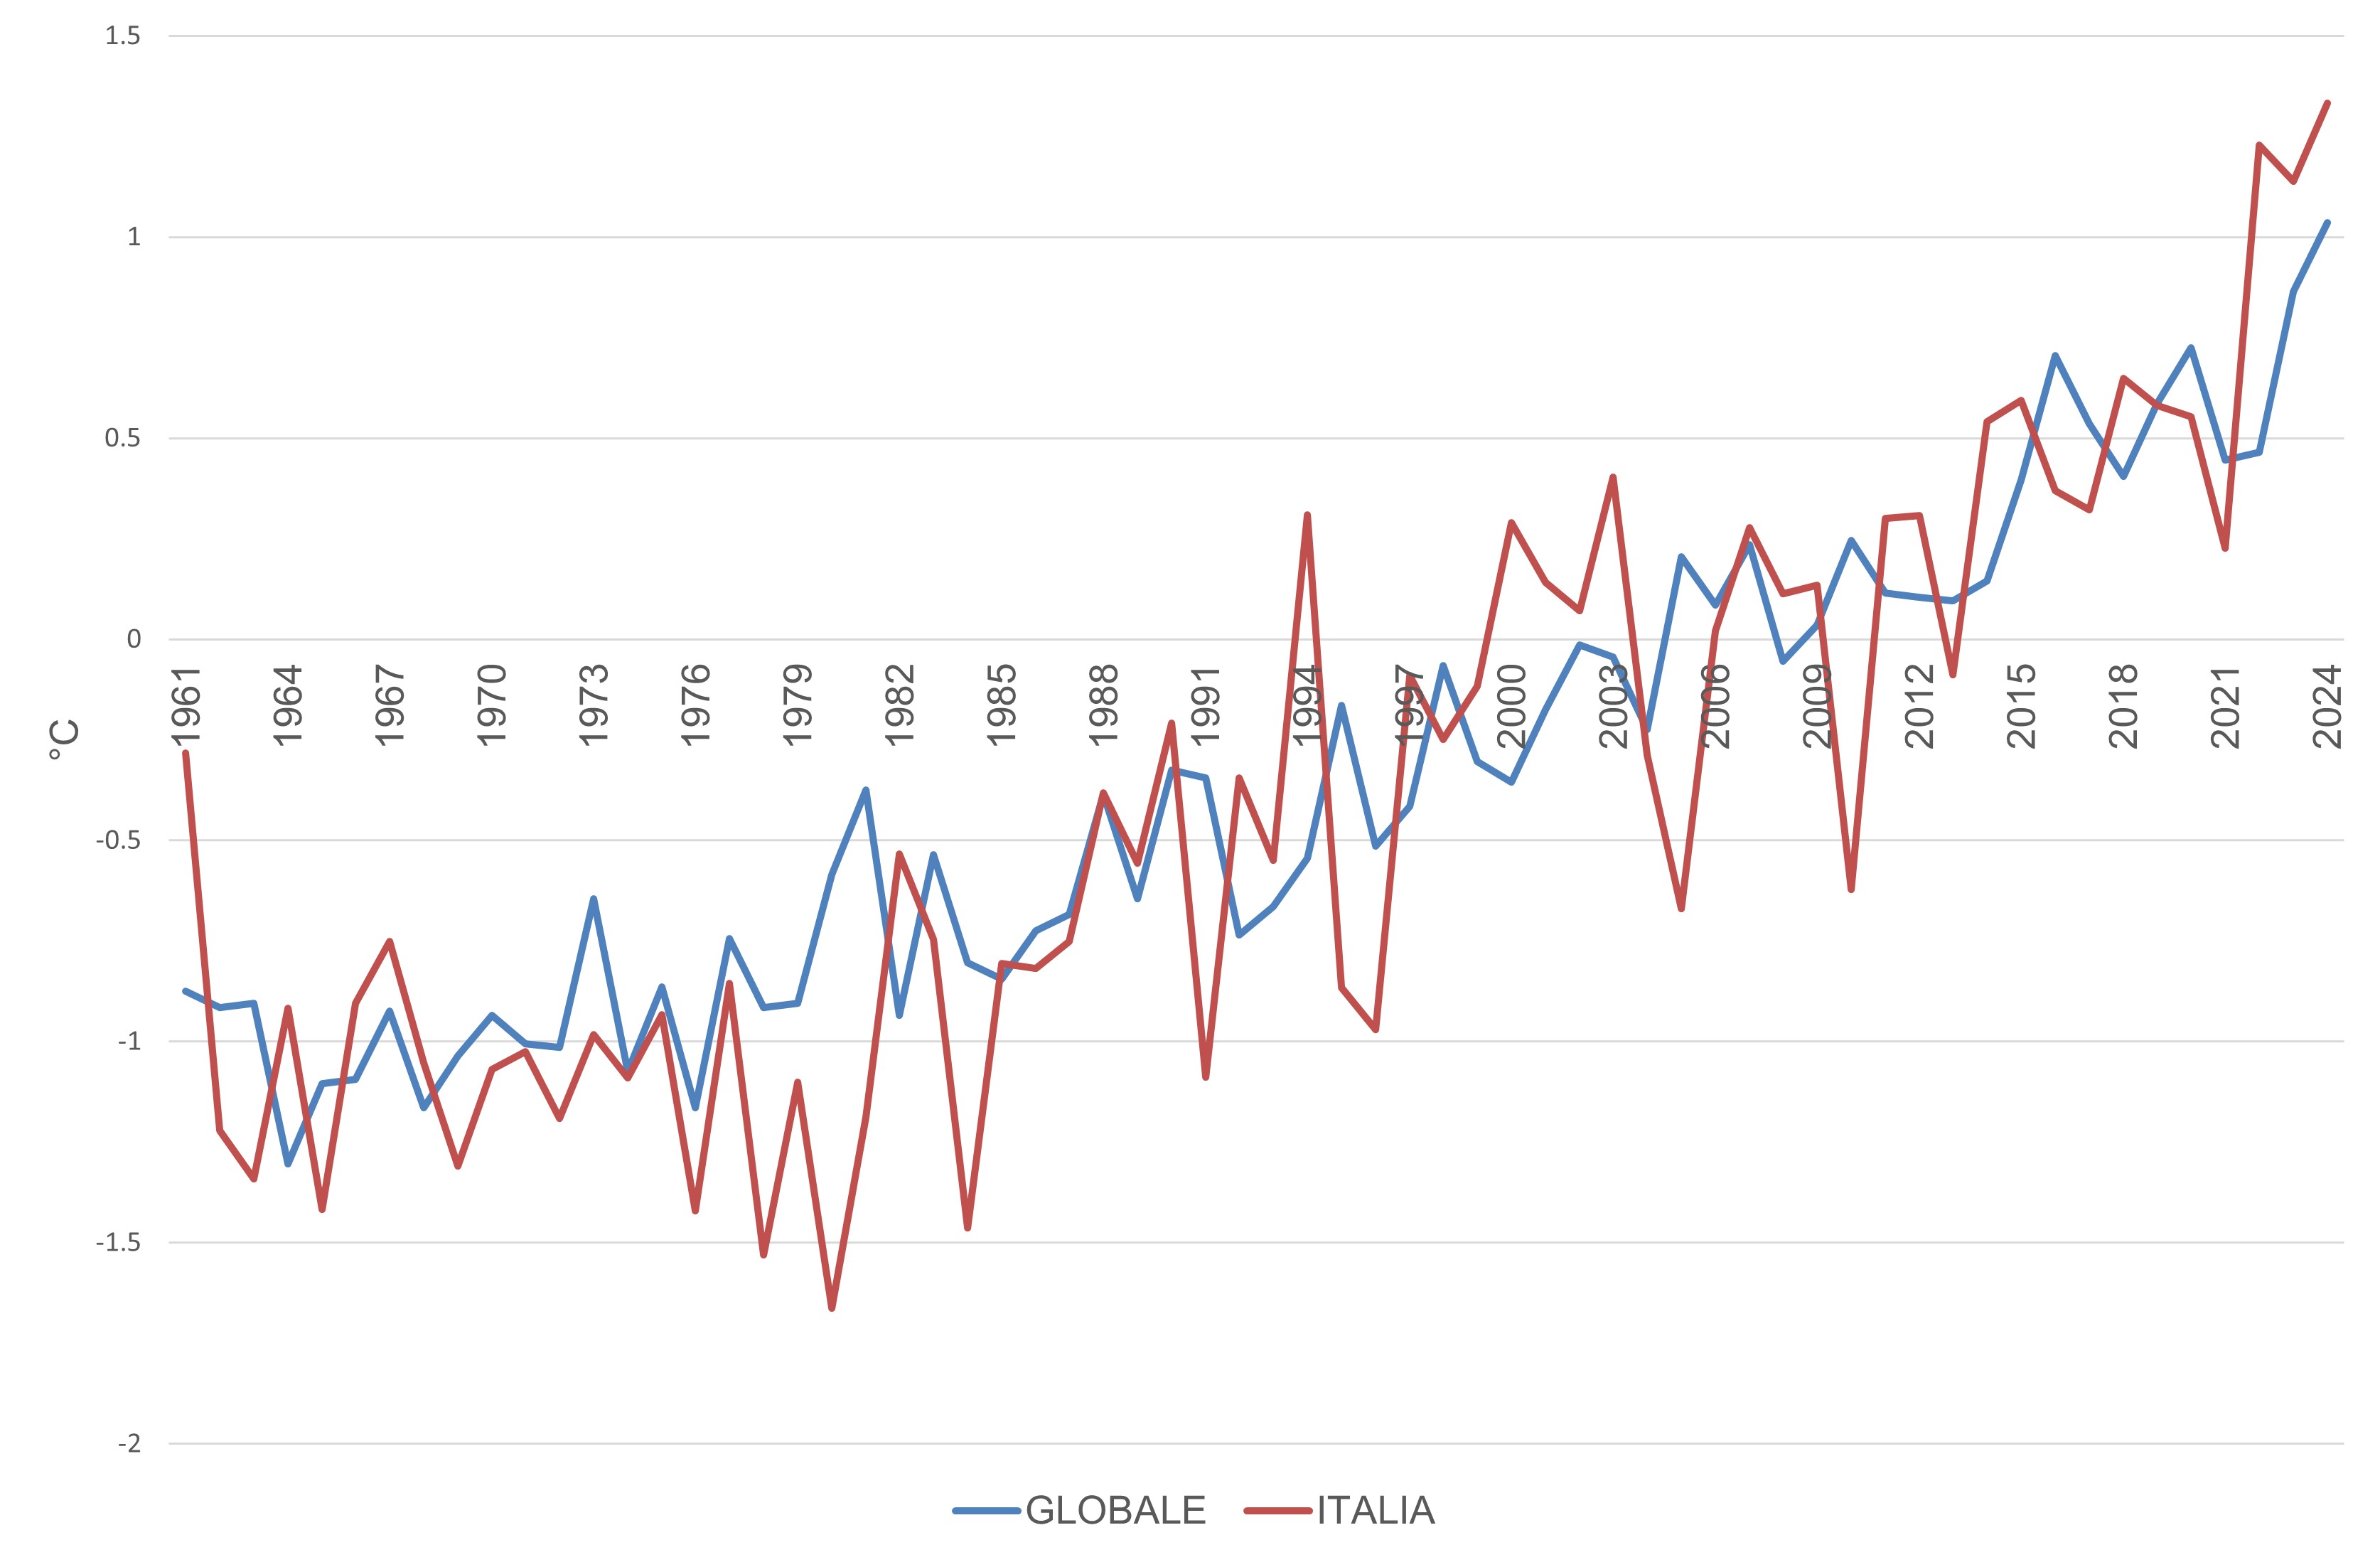
The increase in mean temperature recorded in Italy over the last thirty years has often exceeded the global average over land. In 2024, the mean temperature anomaly in Italy, relative to the 1991–2020 climatological baseline, was +1.33 °C—higher than the global land surface anomaly of +1.03 °C. In Italy, 2023 ranked as the warmest year in the entire annual time series starting from 1961. Since 2000, temperature anomalies relative to the 1991–2020 baseline have consistently been positive, except for four years (2004, 2005, 2010, and 2013).
Air temperature is one of the key variables that define the climate of a given geographical area.
The indicator represents the average air temperature, measured at two metres above the ground, over a specific time period. The thermal trend relative to long-term normal values is assessed by calculating anomalies—defined as the difference between the values recorded in a given year and the climatological normal calculated over the reference period 1991–2020.
It allows for the assessment of ongoing trends in relation to climate change and serves as one of the essential prerequisites for defining appropriate strategies and adaptation actions to address climate change.
With the European Green Deal, the European Union has placed global warming at the heart of its political agenda, aiming to help limit the increase in global average temperature to 1.5°C above pre-industrial levels and to make territories more resilient to climate change. This commitment is consistent with the goals set by the Paris Agreement under the United Nations Framework Convention on Climate Change (UNFCCC), based on estimates from the Intergovernmental Panel on Climate Change (IPCC). The Paris Agreement is the first universal and legally binding global climate accord, adopted at the Paris Climate Conference (COP21) in December 2015. The EU and its Member States are among the 190 parties to the Paris Agreement. The Agreement sets a long-term goal to "hold the increase in the global average temperature to well below 2°C above pre-industrial levels and to pursue efforts to limit the temperature increase to 1.5°C above pre-industrial levels, recognizing that this would significantly reduce the risks and impacts of climate change” (UNFCCC, 2016, The Paris Agreement). The need to limit the increase in global average temperature in line with UNFCCC targets is also recognized in the Sendai Framework for Disaster Risk Reduction 2015–2030 and in Goal 13 of the 2030 Agenda for Sustainable Development (“Take urgent action to combat climate change and its impacts”).
Alexandersson H. e Moberg A., 1997, Homogenization of Swedish temperature data, Int. J. of Climatol. , 17, 25-54;
ISPRA, 2022, I normali climatici 1991-2020 di temperatura e precipitazione in Italia - Stato dell'Ambiente 99/2022
ISPRA, 2018, Variazioni della temperatura in Italia: estensione della base dati e aggiornamento della metodologia di calcolo - Stato dell’ambiente 81/2018;
ISPRA, 2016, Controlli di qualità delle serie di temperatura e precipitazione - Stato dell'Ambiente 66/2016
ISPRA, 2015, Valori climatici normali di temperatura e precipitazione in Italia - Stato dell'Ambiente 55/2015
ISPRA, 2014, Focus su "Le città e la sfida ai cambiamenti climatici" - Stato dell'Ambiente 54/2014
ISPRA, 2013, Variazioni e tendenze degli estremi di temperatura e precipitazione in Italia - Stato dell'Ambiente 37/2013
ISPRA, 2012, Elaborazione delle serie temporali per la stima delle tendenze climatiche - Stato dell'Ambiente 32/2012
SNPA, 2025, Il clima in Italia nel 2024 - Report ambientali SNPA n. 44/2025
Toreti A. e Desiato F., 2007, Temperature trend over Italy from 1961 to 2004, Theor. Appl. Climatology, DO I10.1007/s00704-006-0289-6.
Toreti A., Desiato F., Fioravanti G., Perconti W., 2009, Seasonal temperatures over Italy and their relationship with low-frequency atmospheric circulation patterns, Springer-Climatic Change , DO I: 10.1007/s10584-009-9640-0
Improvements in the estimation of the average temperature in Italy could derive from the extension of the indicator calculation system to other data sources, in order to increase the availability of historical temperature series that satisfy requirements of duration, continuity and completeness of the time series.
ISPRA
SCIA – Sistema nazionale per l’elaborazione e diffusione di dati climatici (https://scia.isprambiente.it)
National
1961-2024
The programme used by the SCIA system (National System for the Collection, Processing and Dissemination of Climate Data) processes primary data and provides a daily mean temperature value, which is accepted as valid only if it passes specific quality control checks. The programme then calculates the decadal, monthly, and annual values of the indicator by averaging the daily values over 10-day, monthly, and annual periods, respectively. These aggregated values are accepted as valid only if at least 75% of the daily values within each time interval are valid. In accordance with the guidelines of the World Meteorological Organization (WMO), the climatological baseline used for calculating temperature anomalies has been updated to the most recent 30-year period, 1991–2020, in order to better reflect the current climate. By analysing time series using appropriate statistical methods and models, it is possible to detect the presence or absence of temperature trends across Italy, estimate their magnitude, and compare them with trends observed at global or regional scales.
In 2024 (Figure 1), the mean temperature anomaly in Italy (+1.33 °C) was higher than the global land average anomaly (+1.03 °C), compared to the 1991-2020 climatological baseline.
The increase in mean temperature recorded in Italy over the last thirty years has often exceeded the global land average. A significant rise (α = 0.05) in mean temperature in Italy of approximately 0.42 °C per decade was estimated using a simple linear regression model for the period 1981-2024. Since major international climate strategies and policies aim to counteract ongoing warming of the climate system, this unfavorable trend assessment and the assignment of the corresponding indicator can be interpreted as a divergence from that goal.
| Allegati |
|---|
Thumbnail
Titolo
Figure 1. Time series of annual mean anomalies of near-surface air temperature over land, globally and for Italy, relative to the 1991–2020 climatological normal. Fonte
NCDC/NOAA e ISPRA |
Thumbnail
Titolo
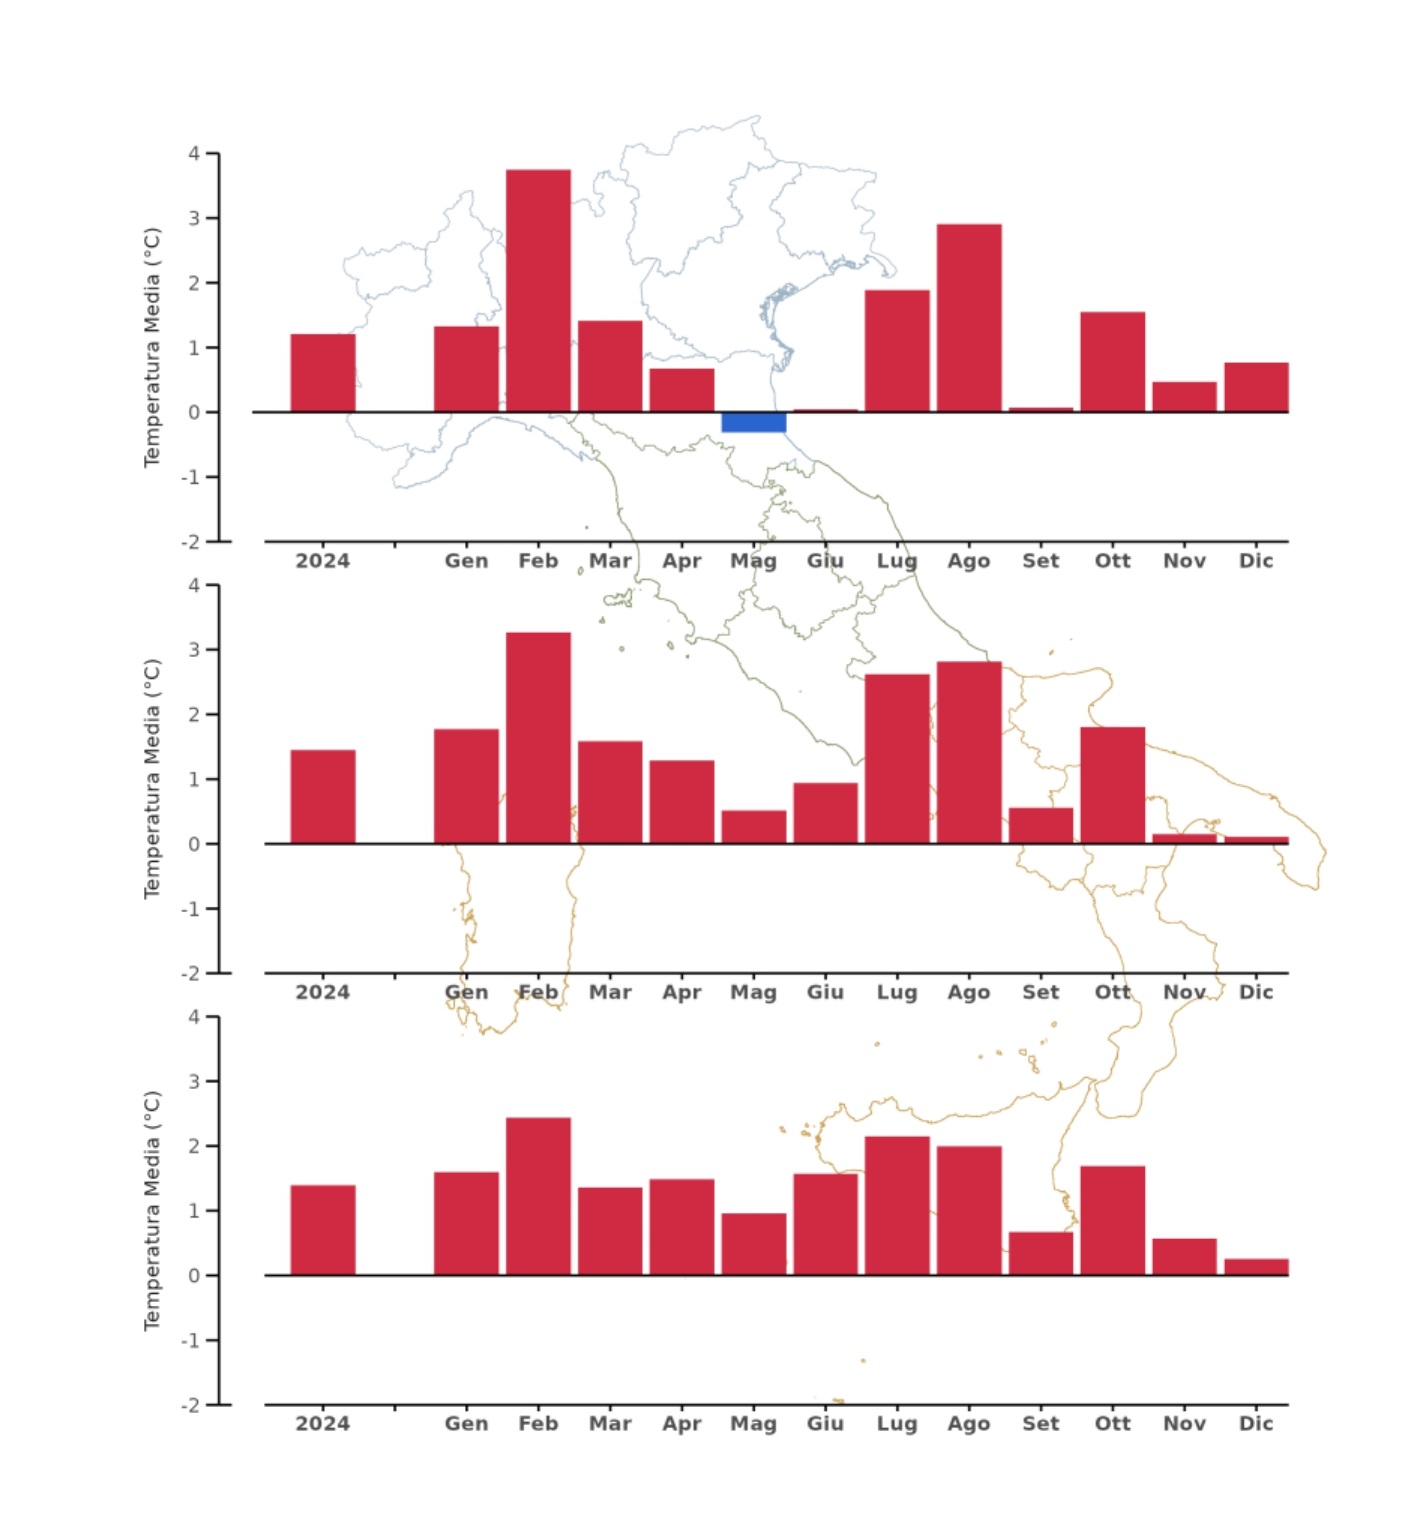
Figure 2. 2024 monthly and annual mean anomalies of near-surface air temperature in Italy, relative to the 1990–2020 climatological normal. Fonte
ISPRA |
In Italy, the 2024 mean temperature anomaly ranks 1° highest in the entire historical series. Since 2000, the anomalies relative to the 1991-2020 climatological baseline have been consistently positive, except for four years: 2004, 2005, 2010, and 2013. The year 2024 marked the eleventh consecutive year with a positive anomaly compared to the norm (Figure 1).
Figure 2 shows that the 2024 annual mean temperature anomaly averaged +1.21 °C in the North, +1.45 °C in the Center, and +1.39 °C in the South and Islands. In 2024, temperature anomalies were positive across all regions and months, with the sole exception of May in Northern Italy, which recorded an anomaly of –0.31 °C. February exhibited record anomalies in all three macro-regions: +3.75 °C in the North, +3.27 °C in the Center, and +2.44 °C in the South and Islands. Subsequently, July and August registered the next highest positive anomalies nationwide.