BATHING WATERS QUALITY CLASSIFICATION

Data aggiornamento scheda:

The quality of bathing waters is fundamental for safeguarding citizens' health and also plays an important role from the perspective of protecting the natural environment and in terms of economic aspects in the tourism sector. For this reason, specific monitoring is carried out throughout the entire bathing season.
For the 2023 bathing season, more than 31,000 samples of sea and lake water were collected and analyzed over a total of more than 5,000 km of coastline designated for bathing.
At the municipal level, the kilometers of coastline are divided into more or less extensive bathing waters, for a total of 5,490 bathing waters.
The results of the analyses, in addition to ensuring the absence of health and hygiene risks during the season, also made it possible to classify the waters.
The classification was made using the monitoring results from the 2023 bathing season and those of the previous three seasons (2022-2021-2020).
At the national level, most of the waters fall into the excellent class (90.6%), however, critical issues still persist due to the presence of waters in the poor class (1.3%) and not classifiable (0.5%), for which it is not possible to express a quality judgment.
Also at the regional level, the percentage of waters in the excellent class is the highest and in some cases equals 100%.
In almost all regions, the waters in the sufficient and poor classes are decreasing, but the presence of the latter still prevents the full achievement of the directive’s objective.

CLEAN COAST INDEX (CCI)

Data aggiornamento scheda:

Any solid material, manufactured or processed by humans, abandoned or lost in the marine and coastal environment or that reaches the sea in any way is defined as marine litter. Italy, with Legislative Decree No. 190/2010 transposing the Marine Strategy Framework Directive, has been conducting an intensive marine litter monitoring program since 2015, including beach litter. Twice a year, in spring and autumn, the coastal Regional Environmental Protection Agencies (ARPA) carry out monitoring of solid waste present in sample areas of 69 reference beaches along the national coastline. To assess the cleanliness of the beaches based on the density of litter present in the monitored sample areas, the Clean Coast Index (CCI) was calculated, an indicator developed and applied internationally.

In 2023, the CCI was calculated for 69 beaches both in spring and autumn. In spring, 80% of the monitored beaches were clean or very clean compared to 12% of dirty or very dirty beaches. In autumn, 77% of the beaches were clean or very clean, while 12% were dirty or very dirty. The rest of the beaches were fairly clean. Compared to the previous year, the percentage of clean or very clean beaches increased in autumn (75% in 2022), while in spring it remained the same.

CONSERVATION STATUS OF SPECIES PROTECTED UNDER THE BIRDS DIRECTIVE (2009/147/EC)

Data aggiornamento scheda:

This indicator provides a national overview of the conservation status of 268 breeding bird species assessed in the reporting under Article 12 of the Birds Directive 2009/147/EC. The assessment includes species of community interest listed in Annexes I and II of the Directive, as well as those that justify the designation of Special Protection Areas (SPAs).

At the national level, the percentage of species with a favourable conservation status increased from 51% (reporting period 2007-2012) to 56% (reporting period 2013-2018). However, this increase was insufficient to meet the target set by the EU Biodiversity Strategy 2020 (76%).

The short-term population trends, which reflect processes occurring in the last decade, indicate that 46% of species are increasing or stable, while nearly 25% of species are in decline (the population trend of the other 33% remains unknown). Regarding short-term trends in distribution range, the proportion of declining species is lower, as only the most severe declines result in range contractions: 21% of species show a contraction, while the remaining 79% have stable or expanding ranges.

EUTROPHICATION

Data aggiornamento scheda:
Immagine

Eutrophication is a process caused by the enrichment of nutrients, particularly nitrogen and phosphorus compounds, which leads to an increase in primary production and algal biomass, resulting in the alteration of benthic communities and, in general, a decline in water quality. The input of nitrogen and phosphorus into the marine and coastal environment can originate from diffuse sources (river loads, major collectors of agricultural activity, and urban discharges) and point sources (discharges from wastewater treatment plants, industrial activities, and aquaculture operations). Objectives related to eutrophication control and management are set by the Water Framework Directive (WFD, Directive 2000/60/EC), the Marine Strategy Framework Directive (Descriptor 5, Directive 2008/56/EC), and the Nitrates Directive (Directive 91/676/EEC) and Urban Waste Water Treatment Directive (Directive 91/271/EEC), which are particularly focused on pressure management. The causes of eutrophication are primarily linked to nutrient inputs carried into the sea by rivers or coastal settlements, which cause serious negative impacts on the health of marine ecosystems and the sustainable use of goods and services. The main sources of nutrients are related to the agri-livestock and urban sectors.

Environmental assessments regarding eutrophication, in accordance with the requirements of Directive 2008/56/EC, have highlighted the achievement of Good Environmental Status. Therefore, the measures adopted so far under Directive 2000/60/EC, Directive 91/676/EEC, and Directive 91/271/EEC have proven effective in achieving environmental targets.

EXTENT OF FOREST FIRES

Data aggiornamento scheda:

The phenomenon of forest fires analyzed based on data collected from 1970 to 2023 by the State Forestry Corps, now CUFA (Carabinieri Forestry, Environmental and Agri-food Unit Command), shows a fluctuating trend, with peak years (1993, 2007, 2017, 2021) alternating with years of decline (2013, 2014, 2018). The presence of fires within Protected Areas is high, with exceptionally large burned areas recorded in certain years, such as 2021 and 2022, when 26,507 hectares and 11,101 hectares were affected by fire, respectively.

The incidence of intentional fires is very high, accounting for approximately half of all recorded events and exceeding 60% in some years (2012, 2014, 2015, 2016, 2020).

FINAL ELECTRICITY CONSUMPTION BY SECTOR

Data aggiornamento scheda:

Final electricity consumption grew steadily from 1990 to 2008, then declined due to the economic crisis. From 2015, consumption resumed growth until stabilizing in 2017. Following the SARS-CoV-2 pandemic, 2020 consumption dropped by 5.7% compared to the previous year, with a rebound of 6.2% in 2021. In 2022, consumption decreased by 1.8% compared to 2021, settling at 24.7 Mtep (million tonnes of oil equivalent). The industrial sector's share of consumption fell from 51.7% in 1990 to 38.9% in 2022, while the civil sector (residential and tertiary) increased from 43.2% to 55.6%. The agriculture and fisheries sector remained nearly constant at around 2%, and the transport sector, despite fluctuations, stayed stable at 3.1%.

FISHING EXPLOITATION RATE OF NATIONAL FISHERY RESOURCES

Data aggiornamento scheda:
Immagine

During the period considered (2007-2022), the average exploitation rate of fish stocks (i.e., the mean ratio between current fishing mortality and the mortality associated with the Maximum Sustainable Yield; Fcurr/FMSY) exceeded the sustainability threshold. The indicator, estimated on internationally validated analytical stock assessments, highlights the overall trend in the exploitation rate of commercially fished stocks, providing insight into the quantitative trends in fishing pressure.

A peak in the average exploitation rate was observed in 2012 and 2013, with values exceeding 3, followed by a declining trend, reaching its lowest point in 2022 (average value of 1.12). The analysis is conducted at the National level and by Sub-Region, following the geographical scale defined by the Marine Strategy Framework Directive (MSFD; 2008/56/EC).

FLOOD EVENTS

Data aggiornamento scheda:
Immagine

In 2023, Italy experienced one of the hottest years in the last 150 years, second only to 2022. The average and maximum temperatures reached new records with October recording temperatures more than 3°C higher than the 1991-2021 average, marking the highest value since 1961. During the summer, intense heatwaves affected the country, with record temperatures of 48.2°C recorded on July 24 in Jerzu and Lotzorai in Sardinia, and 41.2°C in Rome in early August. Drought continued to be a significant problem, with Northern and Central Italy experiencing severe drought conditions in the first four months of the year, which later eased. However, in the last three months of the year, Sicily and parts of Ionian Calabria suffered from extreme drought with a significant precipitation deficit.
Extreme weather events affected several regions, causing severe damage. In May, Emilia-Romagna was devastated by two exceptional rainfall events, leading to flooding, landslides, and 17 fatalities. On November 2, heavy thunderstorms in Tuscany caused flooding and 8 deaths, with exceptional rainfall recorded in the provinces of Pisa, Livorno, Pistoia, and Prato.
In summary, 2023 was characterized by record temperatures, persistent drought, and extreme weather events that had a significant impact on various italian regions.

FOOD WASTAGE

Data aggiornamento scheda:

Systemic food wastage in the Italian food system amounts to 66% of the total food energy produced. There has been a 17% increase in food wastage compared to 2015, measured in kilocalories per person per day. This situation remains far from institutional targets of halving or significantly reducing food wastage by 2030.

FRAGMENTATION OF NATURAL AND AGRICULTURAL LAND

Data aggiornamento scheda:

Territorial fragmentation is the process that leads to a progressive reduction in the area of natural and semi-natural environments and an increase in their isolation. This process, which transforms large land patches into smaller and more isolated parts, is primarily driven by urban expansion phenomena, which can take more or less sustainable forms, and the development of infrastructure networks aimed at improving connections between urbanized areas through linear works. In 2023, 42.34% of the national territory was classified as highly and very highly fragmented. The regions with the largest areas of very high fragmentation are Veneto (39.98%), Lombardia (33.57%), Emilia-Romagna (25.87%), and Campania (25.69%). This data confirms the strong correlation between fragmentation and urbanization density.

FREIGHT TRANSPORT DEMAND AND INTENSITY

Data aggiornamento scheda:

The indicator evaluates the demand for freight transport (also in relation to economic growth) and the evolution over time of modal split. The transport demand is increasingly met by road freight transport, which continues to dominate other transport modes in terms of growth and modal share (approximately 62% in 2023).

GREENHOUSE GAS EMISSIONS (CO2, CH4, N2O, HFCS, PFCS, SF6): TREND AND PROJECTIONS

Data aggiornamento scheda:

The indicator represents projections of national greenhouse gas emissions up to 2040, based on the current policies scenario as of 31/12/2022, including those implemented under the National Recovery and Resilience Plan (NRRP), as well as the additional policies and measures scenario defined in the Integrated National Energy and Climate Plan (INECP). The scenarios are calculated starting from the most recent consolidated historical data for 2022, and reflect the expected evolution of key macroeconomic drivers as reported to the European Commission. The projected reductions in total greenhouse gas emissions (including LULUCF) by 2030, compared to 1990 levels, are estimated at -38% under the current policies scenario and -49% under the additional measures scenario.

ITALIAN LANDSLIDE INVENTORY (IFFI)

Data aggiornamento scheda:
Immagine

The indicator provides information about the landslide number and distribution in Italy. The recorded landslides exceed 635,000 (reference period 1116-2024) and affect an area of 25,004 km², accounting for 8.3% of the national territory.

MAIN LANDSLIDE EVENTS

Data aggiornamento scheda:
Immagine

The indicator provides information about the major landslide events caused fatalities, injuries, evacuations, damage to buildings, cultural heritage, and primary linear communication infrastructure or service networks in the national territory in the past year. The major landslide events occurred in 2023 were 192, with 11 deaths, 24 injuries, and damage mainly to the road network and buildings.

MARINE STRATEGY MONITORING - MICRO-LITTER IN THE SURFACE LAYER OF THE WATER COLUMN

Data aggiornamento scheda:
Immagine

Italy, in application of the Marine Strategy Framework Directive, has implemented an extensive marine litter monitoring program since 2015, including micro-litter present in the surface layer of the water column. This monitoring is conducted by the National System for Environmental Protection (of which ISPRA is a part), under the coordination of the Ministry of Environment and Energy Security (MASE). The composition, quantity, and distribution of surface micro-litter are essential parameters for achieving the good environmental status of marine waters, the objective of the Directive. Micro-litter are particles smaller than 5 mm, whose origin is difficult to identify once dispersed in the environment. These particles derive from both primary sources, such as pellets and microbeads used in cosmetics or abrasive products, and secondary sources, such as the fragmentation of macro-litter. With the data processing carried out from 2016 to 2022, it was possible to define a median density value of micro-particles present in our seas, equal to 0.04 micro-particles per m², or 40,000 micro-particles per km². This value is confirmed by adding the 2023 data to the series. At the Mediterranean level, the Barcelona Convention has set a threshold value of 0.000845 micro-particles per m² (845 micro-particles per km²), therefore, compared to this value, Italy is still far from achieving good environmental status.

MARINE STRATEGY MONITORING – BEACH LITTER

Data aggiornamento scheda:

The Marine Strategy (Directive 2008/56/EC) represents an important governance tool for the marine system, promoting the adoption of strategies aimed at safeguarding the marine ecosystem to achieve Good Environmental Status. Good Environmental Status is assessed based on 11 themes or qualitative descriptors, and among these, Descriptor 10 requires that the properties and quantities of marine litter do not cause harm to the coastal and marine environment. Since 2015, Italy has been implementing an extensive monitoring program for marine litter, including beach litter. In 2023, the median of total marine litter stranded on Italian shores was 250 items per 100 m, the lowest value in the entire historical series. However, this is still a density significantly higher than the threshold value of 20 items per 100 m, established at the European level as a requirement for achieving Good Environmental Status. As in previous years, single-use plastics are the most common type of beach litter, representing 13% of the total; however, for this type of litter, there is a sharp decline compared to 2022 (29%), which, if confirmed in the coming years, could represent a significant first result of the effectiveness of the Marine Strategy Measures Program and, in particular, the application of Directive 2019/904 for the reduction of single-use plastics.


MATERIAL FOOTPRINT

Data aggiornamento scheda:

The indicator quantifies the extraction of natural resources - biomass, metallic minerals, non-metallic minerals, and fossil fuels - globally, due to the final consumption and investments of households, businesses, and public administrations in Italy. In 2023, Italy's material footprint amounted to 656.1 million tons, or 11.1 tons per capita.

MEAN TEMPERATURE

Data aggiornamento scheda:

The indicator describes the trend of mean temperature in Italy.
The increase in mean temperature recorded in Italy over the last thirty years has often exceeded the global average over land. In 2023, the mean temperature anomaly in Italy, relative to the 1991–2020 climatological baseline, was +1.14 °C—higher than the global land surface anomaly of +0.86 °C. In Italy, 2023 ranked as the second warmest year in the entire annual time series starting from 1961. Since 2000, temperature anomalies relative to the 1991–2020 baseline have consistently been positive, except for four years (2004, 2005, 2010, and 2013).

MOUNTAIN GREEN COVER INDEX

Data aggiornamento scheda:

The index evaluates the percentage of vegetation cover in mountain areas, defined according to the six altitude classes with elevations above 300 m above sea level proposed by FAO in 2015 (UNEP-WCMC). The data is expressed in terms of total mountain vegetation area and with reference to the distinction between natural and agricultural areas.

The analysis reveals a significant presence of vegetated areas, especially in classes 5 and 6, which are between 300 and 1,500 m above sea level. The changes observed are mostly associated with a reduction in vegetated areas, while increases are recorded in higher altitude bands, with a maximum of just over 1,800 hectares in Veneto and slightly more than 1,000 hectares in Lombardia. Significant increases in mountain vegetation cover are also found in Marche and Tuscany, which, together with Lombardia and Veneto, are the only regions showing an overall increase in mountain green areas, net of reductions.

OVEREXPLOITED FISH STOCKS

Data aggiornamento scheda:

During the 2007-2022 period, the majority of the assessed fish stocks are in a state of overexploitation: the fishing-induced mortality is higher than that necessary for a sustainable exploitation of the resources in the long term under average environmental conditions.

In the 2020-2022 triennium, the lowest values in the historical series were recorded, with approximately 60% of stocks classified as overexploited, indicating a relative improvement.

This indicator, based on internationally validated analytical stock assessments, reflects the overall trend in the exploitation status of commercially fished stocks, highlighting the condition of harvested resources. The indicator is also associated with the percentage coverage of landed fish stocks for which stock assessments are available. The analysis is conducted at both the national and subregional levels, following the geographic division defined by the Marine Strategy Framework Directive.

PASSENGER TRANSPORT DEMAND AND INTENSITY

Data aggiornamento scheda:

The indicator measures passenger transport demand (according to different modes) and compares its trend with that of economic growth and population. Transport demand is increasingly met by individual road transport (passenger cars and motorcycles), which, due to its growth and modal share (approximately 81% in 2023), remains dominant compared to other transport modes.

PERCENTAGE OF TREATED WASTEWATER

Data aggiornamento scheda:

The percentage of treated wastewater reflects the amount of biodegradable organic load that reaches urban wastewater treatment plants compared to the total organic load produced by agglomerations (2,000 PE or more) across the national territory. In 2022-2023, this percentage is 93.51%, an increase compared to 2020 (93.3%).

PRIMARY EXPENDITURE FOR ENVIRONMENTAL PROTECTION, USE, AND MANAGEMENT OF NATURAL RESOURCES WITH REFERENCE TO BIODIVERSITY

Data aggiornamento scheda:

In 2022, Italy's primary environmental expenditure increased by 163% compared to 2021, reflecting a greater political interest in environmental issues. However, the share of key sectors (biodiversity and landscape protection, forest and wildlife management) in total environmental spending declined from 9.1% to 4.2%.

Despite the increase in available resources, spending capacity varies across sectors, with efficiency rates ranging from 88.5% for biodiversity to 69.1% for forest management. This trend highlights the need to optimize investments to ensure the protection of natural heritage, in alignment with the sustainable development goals of the 2030 Agenda.

RATIO OF FINAL ENERGY CONSUMPTION TO TOTAL ENERGY CONSUMPTION

Data aggiornamento scheda:

The ratio of final energy consumption to total energy consumption measures the overall efficiency of converting energy from primary sources. The difference between these two values corresponds to losses in conversion processes (such as electricity generation and oil refining), internal consumption of power plants, and distribution losses. From 1990 to 2022, the average ratio in our country (70.6%) has been higher than the European average (62.6%). In recent years, a significant increase in the ratio has been observed.

RICHNESS AND RED LIST STATUS OF PLANT SPECIES

Data aggiornamento scheda:

Italy hosts a remarkable floristic heritage, both in terms of species and subspecies richness (2,815 lichens, 1,209 bryophytes, and 8,241 native vascular entities) and biogeographical value. Of the 8,241 Italian vascular plant,1,702 species (equal to 20.65%) are endemic, meaning they exist exclusively in the country. Among these, 1,128 species are regionally endemic, with their range restricted to a single Italian region (data updated to April 2024).

The indicator also highlights the IUCN risk status of 2,430 vascular plant entities (representing 29.5% of Italy’s vascular flora), identifying the main threats affecting them. Unfortunately, the overall conservation status cannot be considered satisfactory: 2.2% (54 species) of the 2,430 evaluated entities are extinct or likely extinct; 24.3% (590 species) are at risk of extinction.

Human-induced pressures related to land-use changes represent a major driver of plant species extinction risk. The Red List of vascular flora identifies the most critical pressures affecting species: Modification of natural systems (39% of the 2,430 assessed taxa are subject to this pressure);

Agricultural development (27%); Residential development (27%); Direct human disturbance in natural environments (20%).

SEISMIC EVENTS

Data aggiornamento scheda:
Immagine

The indicator describes the seismic events that occurred in the reference year within the Italian territory, based on the Magnitudes recorded by the National Seismic Network (Rete Sismica Nazionale) of INGV. In 2023, no seismic event was destructive in Italy. Only one event exceeded Magnitude 5, but it had a very deep hypocenter, preventing any surface effects. Furthermore, 19 events with Magnitude between 4 and 4.9 occurred. The strongest earthquake, with a Magnitude of Mw 4.9, occurred near Marradi (FI). The number of earthquakes with Magnitude 2 or higher that occurred in 2023, concentrated mainly along the Apennine Range, the eastern Alps, and eastern Sicily, is comparable to the number of similar events in the previous four years.

SOIL CONSUMPTON IN COASTAL AREAS

Data aggiornamento scheda:
Immagine

This indicator quantifies soil consumption within specific distances from the coastline and tracks its temporal evolution. Nearly a quarter of the land within 300 meters of the coast has been urbanized, while 19% of the area between 300 and 1,000 meters and 8.7% of the area between 1 and 10 km have been affected. In comparison, only 6.5% of the rest of the territory has undergone soil consumption.

SPECIAL WASTE PRODUCTION

Data aggiornamento scheda:

In 2022, a year marked by a delicate international geopolitical context, the production of special waste generated by the national production system (industrial, commercial, artisanal, and service activities, as well as waste treatment and environmental remediation) recorded a decline compared to 2021. This trend was similar to that observed for urban waste, with total production amounting to 161.4 million tons (-2.1%, equivalent to 3.4 million tons). Non-hazardous waste, which accounts for 93.8% of total waste produced, decreased by 2.7 million tons (-1.8%), while hazardous waste dropped by almost 680,000 tons (-6.4%). 

The construction sector continued to show an increase, although more contained than in the previous year, due to government incentives for building renovation aimed at improving energy efficiency, along with construction activities related to infrastructure, public works, residential, and commercial buildings. 

SPREAD OF ALIEN SPECIES

Data aggiornamento scheda:
Immagine

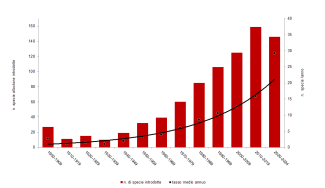
The indicator provides an overview of the current presence of alien animal and plant species in Italy through quantitative data, showing the temporal trends of introduction in Italy over the last century, the average annual introduction rate (average number of new alien species introduced each year), the  pathways (according to CBD categories), and the distribution of invasive alien species of Union concern. The number of alien species in Italy is progressively and constantly increasing. Based on currently available data, nearly 3,800 exotic species have been introduced into our country, of which 3,659 are currently present in the territory. The average number of species introduced per year has increased exponentially over time, increasing from 6 species/year in the 1970s to 16 species/year in the last decade,reaching nearly 30 species/year in the current decade. The cumulative number of species introduced in Italy since 1900 also confirms this exponential trend, with an increase of over 500% in 120 years.

SUSTAINABLE FOREST MANAGEMENT CERTIFICATION

Data aggiornamento scheda:

In recent decades, increasing anthropogenic pressure on forest ecosystems—driven in part by the rising use of biomass for bioenergy, technical applications, and construction—has often led to the degradation of natural and semi-natural systems, especially in tropical regions. These trends are frequently associated with unsustainable and/or illegal exploitation of forest resources. The harvesting, processing, and transportation of wood and wood-based products have significant environmental, economic, and social impacts.

Over the last twenty years, political decision-makers, private companies, civil society organizations, and individual citizens have increasingly focused on the sustainable use of forest biomass. This has led to concrete actions and the implementation of effective tools aimed at preventing and mitigating such impacts. Forest certification has emerged as a key instrument to counteract the negative effects and threats to national and global forest resources by promoting practices based on careful planning and monitoring of wood biomass harvesting and management activities.

As of 31 December 2023, the forest area certified in Italy under the Programme for the Endorsement of Forest Certification (PEFC™) scheme amounted to 984,107 hectares (a 6% increase compared to 2022), while the area certified under the Forest Stewardship Council® (FSC®) scheme totalled 85,214 hectares (an increase of 4% over the previous year).