Panel 1
Marco D'Antona , Paolo De Fioravante, Marco Di Legino, Michele Munafò
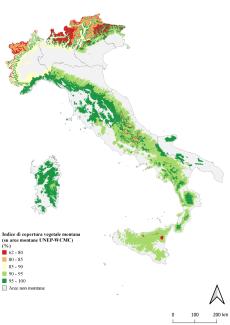
The index evaluates the percentage of vegetation cover in mountain areas, defined according to the six altitude classes with elevations above 300 m above sea level proposed by FAO in 2015 (UNEP-WCMC). The data is expressed in terms of total mountain vegetation area and with reference to the distinction between natural and agricultural areas.
The analysis reveals a significant presence of vegetated areas, especially in classes 5 and 6, which are between 300 and 1,500 m above sea level. The changes observed are mostly associated with a reduction in vegetated areas, while increases are recorded in higher altitude bands, with a maximum of just over 1,800 hectares in Veneto and slightly more than 1,000 hectares in Lombardia. Significant increases in mountain vegetation cover are also found in Marche and Tuscany, which, together with Lombardia and Veneto, are the only regions showing an overall increase in mountain green areas, net of reductions.
The index provides information on the vegetation cover that occupies mountain areas of the national territory. The results are presented with reference to the definition of a mountain area based on the six altitude classes proposed by UNEP-WCMC (Kapos et al. 2000):
Class 1 - Elevation > 4,500 m above sea level
Class 2 - Elevation between 3,500 and 4,500 m above sea level
Class 3 - Elevation between 2,500 and 3,500 m above sea level
Class 4 - Elevation between 1,500 and 2,500 m above sea level and slope > 2°
Class 5 - Elevation between 1,000 and 1,500 m above sea level and slope > 5° or local elevation range (LER) within a 7 km radius for elevations above 300 m
Class 6 - Elevation between 300 and 1,000 m above sea level and LER within a 7 km radius for elevations above 300 m
For the description of land cover, the input data used were the maps for 2012 and 2023, derived from the integration of CORINE Land Cover and National Soil Consumption Map by ISPRA-SNPA. The Mountain Green Cover Index evaluates, in accordance with the definition provided for indicator 15.4.2 (Mountain Green Cover Index) of the Sustainable Development Goals (SDGs), the presence of vegetation in mountain areas, represented by the set of forests, shrublands, grasslands, and agricultural areas. The data has also been disaggregated between agricultural areas and those covered by natural vegetation.
The classification system adopted for identifying vegetation cover is a simplified version of the System of Environmental and Economic Accounting (UN-SEEA) by the United Nations Statistical Commission. This version replaces the classification system in six classes proposed by the Intergovernmental Panel on Climate Change (IPCC) and previously adopted.
Classes for identifying mountain vegetated areas:
Class 1 – Agricultural areas
Class 2 – Permanent grasslands
Class 3 – Areas with tree cover
Class 4 – Areas with shrub cover
Class 5 – Wetlands with herbaceous or shrub cover
Classes identified as non-vegetated areas:
Class 6 – Artificial surfaces
Class 7 – Natural areas with sparse vegetation
Class 8 – Bare soil
Class 9 – Glaciers and permanent snow
Class 10 – Inland waters
Contribute to the analysis of the land cover dynamics characterizing natural mountain areas.
The indicator does not have specific regulatory references, but by analyzing the conservation of mountain environments, progress towards target 15.4 of the Sustainable Development Goals (SDGs) can be monitored.
Panel 2
Kapos, V., J. Rhind, M. Edwards, M.F. Price and C. Ravilious, 2000: Developing a map of the world’s mountain forests. In: Forests in Sustainable Mountain Development: A State-of-Knowledge Report for 2000, M.F. Price and N. Butt(eds.), CAB International, Wallingford: 4–9. Available at https://www.researchgate.net/publication/306151877_Developing_a_map_of_the_world's_mountain_forests_Forests_in_sustainable_mountain_development_a_state_of_knowledge_report_for_2000
Munafò, M. (a cura di), 2021. Consumo di suolo, dinamiche territoriali e servizi ecosistemici. Edizione 2021. Report SNPA 22/21
Tarquini S., Isola I., Favalli M., Battistini A. (2007) TINITALY, a digital elevation model of Italy with a 10 meters cell size (Version 1.0) [Data set]. Istituto Nazionale di Geofisica e Vulcanologia (INGV). https://doi.org/10.13127/TINITALY/1.0.
SDG indicator metadata- https://unstats.un.org/sdgs/metadata/files/Metadata-15-04-02.pdf
As highlighted in the description of the processing methodology, the indicator was calculated based on the land cover map for the years 2012 and 2023, produced by ISPRA using data from the integration of Copernicus CORINE Land Cover and the National Soil Consumption Map. The annual revision of the historical series of the National Soil Consumption Map makes the results entirely comparable within this release, but not perfectly comparable with those previously released.
-
Data quality assessment
CORINE Land Cover 2012-2018
ISPRA
INGV (National Institute of Geophysics and Volcanology)
National, Regional (20/20)
2012, 2023
Indicator assessment
The index is calculated using the National Soil Consumption Map for 2012 and 2023 and CORINE Land Cover for the years 2012 and 2018. Only the portion of land with altimetric characteristics that meet the definition of mountain areas provided by UNEP-WCMC (six altimetric classes, with elevations above 300 m a.s.l.) was considered. In the mountain areas thus defined, the extent of vegetated areas was assessed, defined as the set of:
Class 1 – Agricultural areas
Class 2 – Permanent grasslands
Class 3 – Tree-covered areas
Class 4 – Shrub-covered areas
Class 5 – Wet areas with herbaceous or shrub cover
The assessment, performed using GIS tools, was conducted by separating the two contributions related to agricultural surfaces and natural vegetation-covered surfaces.
The data was calculated at the national scale, disaggregated to the regional scale, and presented in terms of the percentage of mountain territory with vegetation cover.
The change in mountain vegetation cover over the period 2012-2023 was then observed.
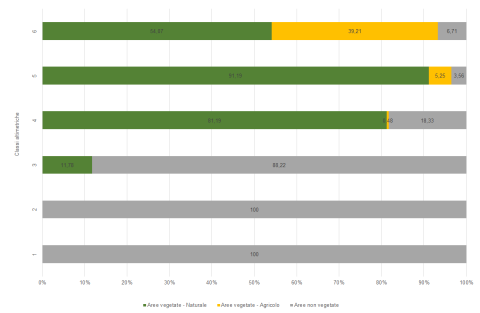
Referring to the six altimetric classes defined by UNEP-WCMC, there is a prevalence of vegetated areas in class 5 (Table 1, Figure 1); vegetation also covers a significant portion of the territory in class 4 (between 1,500 and 2,500 m a.s.l.), where the index exceeds three-quarters of the total mountain area in 18 of the 19 regions where this class is present (Sicily is an exception, with only 62%). In the three classes corresponding to higher altitudes (almost exclusively present in the Alpine regions), vegetation tends to disappear, giving way to outcrops and glaciers.
In terms of land composition, there is a prevalence of natural areas in the Alpine regions, while in many southern regions, agricultural areas constitute about a third of the natural areas. When analyzing the different altitude zones in more detail (Figure 1, Figure 2), non-vegetated areas occupy the entire mountain area in classes 1 and 2 and almost 90% of class 3. Natural vegetated surfaces prevail in the lower altitude zones (4 and 5, between 1,000 and 2,500 m a.s.l.), while agricultural areas are notably present in class 6 (between 300 and 1,000 m a.s.l.) and marginally present in classes 4 and 5, while absent in the three higher altitude classes.
The lower altitude zones are also the most dynamic (Table 3), as most of the changes related to new land consumption are concentrated below 1,500 m a.s.l. From the perspective of the type of changes, these are mostly associated with a reduction in vegetated areas, while increases are recorded in the Marche (overall, the mountain vegetation cover in the region in classes 4, 5, and 6 increases by over 1,600 hectares between 2012 and 2023) and in class 4 for Veneto, with over 1,800 hectares. Marginal increases are observed in Liguria, Friuli-Venezia Giulia, Basilicata, Emilia-Romagna, Tuscany, and Umbria (Table 3).
Data
Table 1: Mountain Green Cover Index, with reference to the six UNEP- WCMC elevation classes (2023)
ISPRA elaborations on ISPRA-SNPA cartography
MGCI: Mountain Green Cover Index
Table 2: Mountain Green Cover Index, with reference to the six elevation classes UNEP- WCMC (2012)
ISPRA elaborations on ISPRA-SNPA cartography
MGCI: Mountain Green Cover Index
Table 3: Change in mountain green areas, with reference to the six UNEP- WCMC elevation classes (2012-2023)
ISPRA elaborations on ISPRA-SNPA cartography


The information regarding the six altimetric classes highlights how the portion of the territory used for agriculture dominates in the flat and sub-flat zones compared to those with higher altitude and slope (Figure 1, Figure 2).
Altimetric classes 1 and 2 (higher elevations) are only present in the Alpine regions (Piedmont and Aosta Valley for class 1, with Lombardy and Trentino-Alto Adige for class 2) and show MGCI values for 2023 always equal to zero due to the prevalence of bare rock and glaciers in these areas (Figure 1, Table 1). Class 3 is present in 8 regions, with the highest values in Piedmont and Aosta Valley, while class 4 is present in all regions except Puglia. Regarding class 4, excluding Sicily, in the remaining 18 regions, vegetation occupies more than 75% of the area (Table 1).
Natural areas with altitudes between 300 and 1,500 m a.s.l. (classes 5 and 6) are present in all regions, with MGCI values for 2023 reaching up to 99% of the area in the class (Table 1).
The changes in the area of mountain land occupied by green areas affect a total of 55,609 hectares at the national level, of which 49,836 hectares show a decrease in mountain green areas and the remainder show an increase. Just under a third of the increases in mountain vegetation are concentrated in class 4 of Veneto, while in the Marche, nearly 30% of the increases occur, distributed across class 4 (+791 ha), class 5 (+678 ha), and class 6 (+188 ha).
Increases in class 3 (particularly in Lombardy and Veneto) are the most significant in terms of percentage variation from 2012 due to the initially small extent of the class (Table 3).
More than a fifth of the decreases in mountain vegetation are concentrated in class 6 of Sicily (-10,728 ha), while in Piedmont, the reduction affects over 15,000 hectares, including 7,759 ha in class 4 and 5,678 ha in class 6. Significant values are also observed in class 6 of Campania and Sardinia, where mountain vegetation decreases by 4,564 ha and 6,916 ha, respectively. Excluding Trentino-Alto Adige (-1,073 hectares in class 4) and Puglia (-1,328 ha in class 6), all reductions in the remaining classes of each region are less than 1,000 hectares (Table 3). The percentage reductions from 2012 remain below 1% in all regions for classes 5 and 6, except for the Marche in class 5. The highest absolute value concerns class 3 in Sicily, but this is attributable to the initially small extent of the class.