FRAGMENTATION OF NATURAL AND AGRICULTURAL LAND
Data aggiornamento scheda:
Land fragmentation is the process that leads to a progressive reduction in the surface area of natural and semi-natural environments and to an increase in their isolation. This process, which transforms large territorial patches into smaller and more isolated units, is mainly driven by urban expansion—implemented through more or less sustainable development patterns—and by the growth of infrastructure networks aimed at improving connectivity between urbanized areas through linear works. In 2024, 42.41% of the national territory was classified as having high or very high fragmentation. The regions with the largest share of very highly fragmented land are Veneto (39.73%), Lombardy (33.73%), Emilia-Romagna (25.22%), Puglia (25.22%), and Campania (25.76%). These figures confirm the close relationship between fragmentation and urbanization density.
CITES CONTROLS
Data aggiornamento scheda:
The number and outcomes of inspections carried out over the last 14 years (2010-2023) to verify compliance with the Washington Convention on International Trade in Endangered Species of Wild Fauna and Flora (CITES) are analyzed. The indicator shows a marked increase in the number of detected offences starting from 2018. In the same year, the total amount of imposed fines also rose sharply, averaging approximately €2,091,126 per year between 2018 and 2024, compared with an average of €611,013 during the 2010–2017 period.
In 2024, a total of 6,170 inspections were carried out, identifying 556 offences and resulting in total fines amounting to €1,728,543. Most violations concerned fauna species (258 offences, €1,137,800 in fines) and flora species (279 offences, €550,737).
SPREAD OF ALIEN SPECIES
Data aggiornamento scheda:
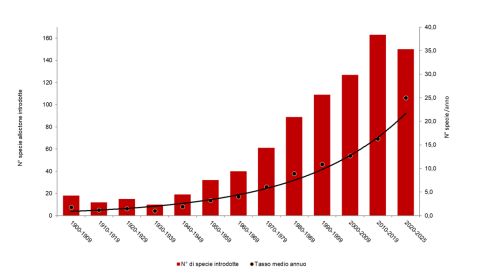
The indicator provides an overview of the current presence of alien animal and plant species in Italy, describing their numbers and trends in introductions over the past century. It reports the average annual introduction rate (the mean number of new alien species introduced each year), the main pathways of introduction (according to CBD categories), and the distribution of invasive alien species of Union concern.
The number of alien species in Italy is steadily and continuously increasing. Based on the data currently available, more than 3,800 alien species have been introduced into the country, of which 3,699 are currently established in the territory. The average number of species introduced per year has grown exponentially over time — from 6 species per year in the 1970s, to 16 per year in the previous decade, and reaching 25 per year in the current one. The cumulative number of alien species introduced in Italy since 1900 also confirms this exponential trend, showing an increase of over 500% in 120 years.
DISTRIBUTION OF ECOLOGICAL VALUE ACCORDING TO CARTA DELLA NATURA
Data aggiornamento scheda:
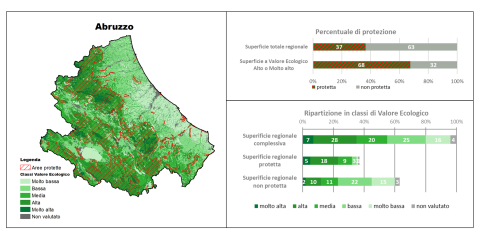
The indicator, based on data processed within the Carta della Natura project, shows the distribution of Ecological Value (VE) across 17 Italian regions, providing a representation categorized into different classes. Ecological Value is understood as a synonym for natural significance and is calculated—starting from the regional habitat maps—for each mapped polygon, excluding those referring to built environments and fully urbanized areas. This indicator offers an overview of the environmental mosaic within various regional contexts, highlighting high-value areas, including their protection status. The analysis presents the percentage of protected areas in each region and the composition of protected and unprotected zones in terms of Ecological Value. The protected areas system (EUAP areas, Natura 2000 sites, and Ramsar areas) covers territories characterized by the highest Ecological Value classes but still leaves significant portions outside protected areas.
HEALTH STATUS OF MIGRATORY BIRD POPULATIONS
Data aggiornamento scheda:
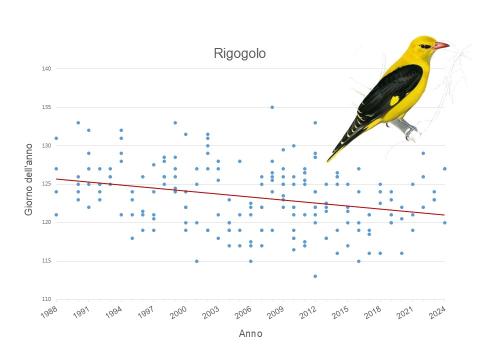
The indicator provides an overview of the health status of common migratory passerine bird populations in Europe through an assessment of their resilience to climate change. The increase in spring temperatures due to global warming causes an earlier seasonal onset of vegetation and, consequently, of the insect peak. As a result, if migratory birds do not advance their arrival at breeding sites to the same extent, they fail to encounter an abundance of prey at the critical time for feeding chicks. A failure to advance migration timing therefore translates into low resilience of migratory populations to climate change, with negative consequences for their survival.
The analysis focuses on the temporal variation in the arrival dates of migratory passerines at stopover sites used after crossing the Sahara and the Mediterranean Sea during their spring journey from Africa to European breeding grounds. Based on an analysis of the migration dates of 10 bird species recorded at 26 ringing stations participating in the ISPRA Small Islands Project from 1988 to 2024 (37 years), it is observed that 60% of the studied species show a migration advance that is too slow (about 1 day every 7+ years) to be considered sufficient to offset the effects of climate change.
CONSERVATION STATUS OF SPECIES PROTECTED UNDER THE BIRDS DIRECTIVE (2009/147/EC)
Data aggiornamento scheda:
This indicator provides a national overview of the conservation status of 268 breeding bird species assessed in the reporting under Article 12 of the Birds Directive 2009/147/EC. The assessment includes species of community interest listed in Annexes I and II of the Directive, as well as those that justify the designation of Special Protection Areas (SPAs).
At the national level, the percentage of species with a favourable conservation status increased from 51% (reporting period 2007-2012) to 56% (reporting period 2013-2018). However, this increase was insufficient to meet the target set by the EU Biodiversity Strategy 2020 (76%).
The short-term population trends, which reflect processes occurring in the last decade, indicate that 46% of species are increasing or stable, while nearly 25% of species are in decline (the population trend of the other 33% remains unknown). Regarding short-term trends in distribution range, the proportion of declining species is lower, as only the most severe declines result in range contractions: 21% of species show a contraction, while the remaining 79% have stable or expanding ranges.
RICHNESS AND RED LIST STATUS OF PLANT SPECIES
Data aggiornamento scheda:
Italy hosts a remarkable floristic heritage, both in terms of species and subspecies richness (2,815 lichens, 1,209 bryophytes, and 8,241 native vascular entities) and biogeographical value. Of the 8,241 Italian vascular plant,1,702 species (equal to 20.65%) are endemic, meaning they exist exclusively in the country. Among these, 1,128 species are regionally endemic, with their range restricted to a single Italian region (data updated to April 2024).
The indicator also highlights the IUCN risk status of 2,430 vascular plant entities (representing 29.5% of Italy’s vascular flora), identifying the main threats affecting them. Unfortunately, the overall conservation status cannot be considered satisfactory: 2.2% (54 species) of the 2,430 evaluated entities are extinct or likely extinct; 24.3% (590 species) are at risk of extinction.
Human-induced pressures related to land-use changes represent a major driver of plant species extinction risk. The Red List of vascular flora identifies the most critical pressures affecting species: Modification of natural systems (39% of the 2,430 assessed taxa are subject to this pressure);
Agricultural development (27%); Residential development (27%); Direct human disturbance in natural environments (20%).
PRIMARY EXPENDITURE FOR ENVIRONMENTAL PROTECTION, USE, AND MANAGEMENT OF NATURAL RESOURCES WITH REFERENCE TO BIODIVERSITY
Data aggiornamento scheda:
In 2022, Italy's primary environmental expenditure increased by 163% compared to 2021, reflecting a greater political interest in environmental issues. However, the share of key sectors (biodiversity and landscape protection, forest and wildlife management) in total environmental spending declined from 9.1% to 4.2%.
Despite the increase in available resources, spending capacity varies across sectors, with efficiency rates ranging from 88.5% for biodiversity to 69.1% for forest management. This trend highlights the need to optimize investments to ensure the protection of natural heritage, in alignment with the sustainable development goals of the 2030 Agenda.
MOUNTAIN GREEN COVER INDEX
Data aggiornamento scheda:
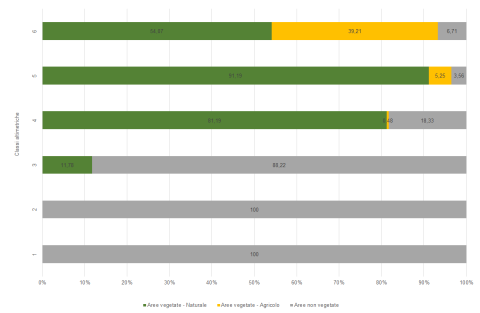
The index evaluates the percentage of vegetation cover in mountain areas, defined according to the six altitude classes with elevations above 300 m above sea level proposed by FAO in 2015 (UNEP-WCMC). The data is expressed in terms of total mountain vegetation area and with reference to the distinction between natural and agricultural areas.
The analysis reveals a significant presence of vegetated areas, especially in classes 5 and 6, which are between 300 and 1,500 m above sea level. The changes observed are mostly associated with a reduction in vegetated areas, while increases are recorded in higher altitude bands, with a maximum of just over 1,800 hectares in Veneto and slightly more than 1,000 hectares in Lombardia. Significant increases in mountain vegetation cover are also found in Marche and Tuscany, which, together with Lombardia and Veneto, are the only regions showing an overall increase in mountain green areas, net of reductions.
CONSERVATION STATUS OF SPECIES UNDER THE HABITATS DIRECTIVE 92/43/EEC
Data aggiornamento scheda:
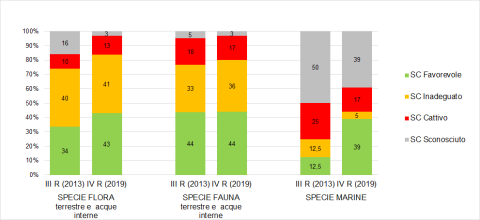
The indicator illustrates the conservation status and trends of Italian species protected under Directive 92/43/EEC (Habitats Directive) and is based on the summary results of the 4th Italian report for the period 2013-2018, submitted to the European Commission in 2019. The report covers a total of 349 species (232 animal species and 117 plant species) of Community interest present in our territory and seas. In the 4th report, a total of 337 distribution maps and 619 reporting forms were produced (one for each species in every biogeographical region where it is present). The 2019 assessments show that over half of the terrestrial and inland water species, 54% of the flora, and 53% of the fauna, as well as 22% of the species evaluated in the marine context, have an unfavourable conservation status (inadequate or poor). A comparison between the two most recent reporting periods (2007-2012 and 2013-2018) reveals no improvements in the conservation status of the species. The only positive signal is the increase in knowledge, with a decrease in cases where the conservation status was unknown. The indicator highlights the urgent need for greater commitment to the conservation of species protected by the Habitats Directive, in relation to the target of the European Biodiversity Strategy to 2030, which sets out that at least 30% of species and habitats in unfavourable conservation status should improve their status by 2030 or show at least a trend of improvement.
RELATIVE RICHNESS AND ABUNDANCE OF BIRDS IN ITALY
Data aggiornamento scheda:
The indicator measures the abundance and diversity of bird populations in Italy throughout the year, based on bird ringing data. This assessment helps define Italy’s role in the spatial-temporal distribution of European avifauna. Data from 2019-2020 confirm Italy’s crucial importance as a major migration corridor between Europe and Africa and contribute to identifying critical periods for bird species, which is essential for conservation and management purposes.
RICHNESS AND RED LIST STATUS OF ANIMAL SPECIES
Data aggiornamento scheda:
The Italian fauna is estimated to include over 58,000 species, with the total number reaching approximately 60,000 taxa when considering subspecies. However, this biodiversity is under threat, as indicated by IUCN assessments and population trends. Among the 672 species of Italian vertebrates (576 terrestrial and 96 marine), 6 are extinct in Italy, and 161 are threatened with extinction (accounting for 28% of the assessed species). Different vertebrate groups show varying percentages of risk: 2% for marine bony fish, 19% for reptiles, 21% for cartilaginous fish, 23% for mammals, 36% for amphibians, and up to 48% for freshwater bony fish (considering the CR+EN+VU IUCN categories). Additionally, terrestrial and marine vertebrate populations are generally declining by 27% and 22%, respectively.
Breeding birds are the only group for which two IUCN assessments have been conducted, seven years apart. Of the 278 species assessed in the latest 2019 evaluation, 5 are extinct, and 67 are threatened (compared to 76 in 2013), representing 26% of the evaluated species. Half of Italy's breeding bird species are not at immediate risk of extinction.
Among invertebrates, 9% of corals, 11% of dragonflies, 21% of saproxylic beetles, 6% of butterflies, and 11% of assessed bees are threatened with extinction. Invertebrates also show negative trends; for example, 16% of dragonfly populations are in decline, five times higher than those increasing.
CONSERVATION STATUS OF TERRESTRIAL HABITATS UNDER DIRECTIVE 92/43/EEC
Data aggiornamento scheda:
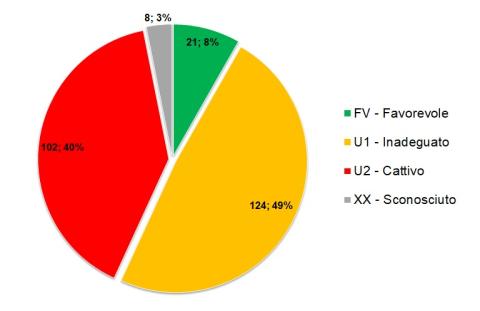
The Habitats Directive (92/43/EEC) is one of the main pillars of the European Union's nature conservation policy. This indicator is based on data provided by Italy for the periodic reporting required of Member States under Article 17 of the Directive. The report provides a general summary of the Italy’s Fourth Report, referring to data from monitoring activities conducted by regions and autonomous provinces during the 2013–2018 period. Specifically, it highlights the overall conservation status observed for terrestrial and inland water habitats across the national territory, as well asthe distribution of conservation status across the Italian biogeographical regions. Additionally, the report outlines the number of assessments to be conducted by individual regions and autonomous provinces for habitat monitoring, providing an estimate of the expected workload.
The trend compared to the previous reporting cycle is negative, showing a decrease in favorable assessments. Currently, only 8% of cases are classified as having a favorable conservation status, while 49% are deemed inadequate and 40% poor. This indicates a generally critical situation, further distancing Italy from achieving the objectives set by the Directive.