Roberta Capogrossi, Lucilla Laureti
The indicator, based on data processed within the Carta della Natura project, shows the distribution of Ecological Value (VE) across 17 Italian regions, providing a representation categorized into different classes. Ecological Value is understood as a synonym for natural significance and is calculated—starting from the regional habitat maps—for each mapped polygon, excluding those referring to built environments and fully urbanized areas. This indicator offers an overview of the environmental mosaic within various regional contexts, highlighting high-value areas, including their protection status. The analysis presents the percentage of protected areas in each region and the composition of protected and unprotected zones in terms of Ecological Value. The protected areas system (EUAP areas, Natura 2000 sites, and Ramsar areas) covers territories characterized by the highest Ecological Value classes but still leaves significant portions outside protected areas.
The indicator describes the distribution of Ecological Value (VE) according to the analyses produced within the national Carta della Natura project. It presents a regional-scale representation categorized into five classes (very low, low, medium, high, and very high), with an additional "not evaluated" class referring to built environments excluded from VE assessments. For each region, a map displays the distribution of VE classes along with the boundaries of protected areas (EUAP, Natura 2000 sites, and Ramsar areas). Two summary charts accompany the map:
- A bar chart showing the percentage of protected and unprotected land within the region, as well as the share of high and very high VE areas that are protected or not.
- A comparison chart displaying the percentage distribution of VE classes across the entire region, contrasting protected and unprotected portions.
Additionally, information is provided on habitats associated with high and very high VE classes, including the number of habitats fully contained within these classes and details on their protected vs. unprotected surface areas.
By analyzing the spatial distribution of VE classes at the regional scale, this indicator facilitates insights into the environmental mosaic and natural value of different areas. It examines the percentage of high and very high VE areas that are already protected versus those that remain unprotected, offering guidance for identifying new conservation areas, supporting national and regional territorial planning, and informing biodiversity conservation strategies aligned with sustainable development goals.
The Framework Law on Protected Natural Areas (Law No. 394/91) serves as the institutional foundation for the Carta della Natura project. Article 3 defines its objectives as: "It identifies the state of the natural environment in Italy, highlighting its natural values and territorial vulnerability profiles." The Carta della Natura project, conceived to support the protected areas system, can serve as a technical tool contributing to the EU Biodiversity Strategy for 2030, which mandates increasing protected areas and integrating environmental protection into all planning processes following governance based on environmental sustainability.
ISPRA, 2009. Il progetto Carta della Natura alla scala 1:50.000. Linee guida per la cartografia e la valutazione degli habitat., Manuale n.48/2009.
(https://www.isprambiente.gov.it/files/carta-della-natura/cdn-manuale.pdf).
The project has not yet been implemented in 3 regions, for which the indicator is not available.
Completion of national coverage.
ISPRA
ISTAT
MASE (Ministero dell'ambiente e della sicurezza energetica)
ISPRA Carta della Natura Information System
(https://www.isprambiente.gov.it/it/servizi/sistema-carta-della-natura/index)
ISTAT regional administrative boundaries census 2011
(https://www.istat.it/it/archivio/104317#accordions)
Geoportal cartography of MASE for EUAP, Natura 2000, and Ramsar areas (updates 2017 and 2023)
Regional (17/20)
2009-2024
The indicator is based on the Ecological Value Index (VE), calculated region by region within the Carta della Natura project. VE represents natural value. It is calculated for each polygon (ecotope) in habitat maps at scales of 1:50,000/1:25,000. Built environments are excluded from the calculation. The evaluation is topological (biotope-specific), rather than typological (based solely on habitat type), meaning that biotopes of the same habitat type may have different VE values due to varying ecological conditions.
The VE is derived from a set of indicators selected based on relevance at regional scale, availability, and uniformity nationwide. These indicators consider: habitats and protected areas under EU Habitats and Birds Directives, biodiversity richness (species suitability and range), and landscape ecology parameters. An algorithm aggregates these indicators to calculate the final VE score.
VE scores are categorized into five classes (very low, low, medium, high, very high), plus a "not evaluated" class (built-up areas). The data is managed within a Geographic Information System from which all necessary data for the indicator is extracted. Protected area boundaries are obtained from the MASE geoportal; regional boundaries come from ISTAT administrative census data.
For each region, a map and two summary charts are provided. The first chart shows protected vs. unprotected area percentages, and shares of high/very high VE areas protected vs. unprotected. The second chart compares VE class distribution across the entire region, protected areas, and non-protected areas. All percentages are calculated relative to total regional area for comparability.
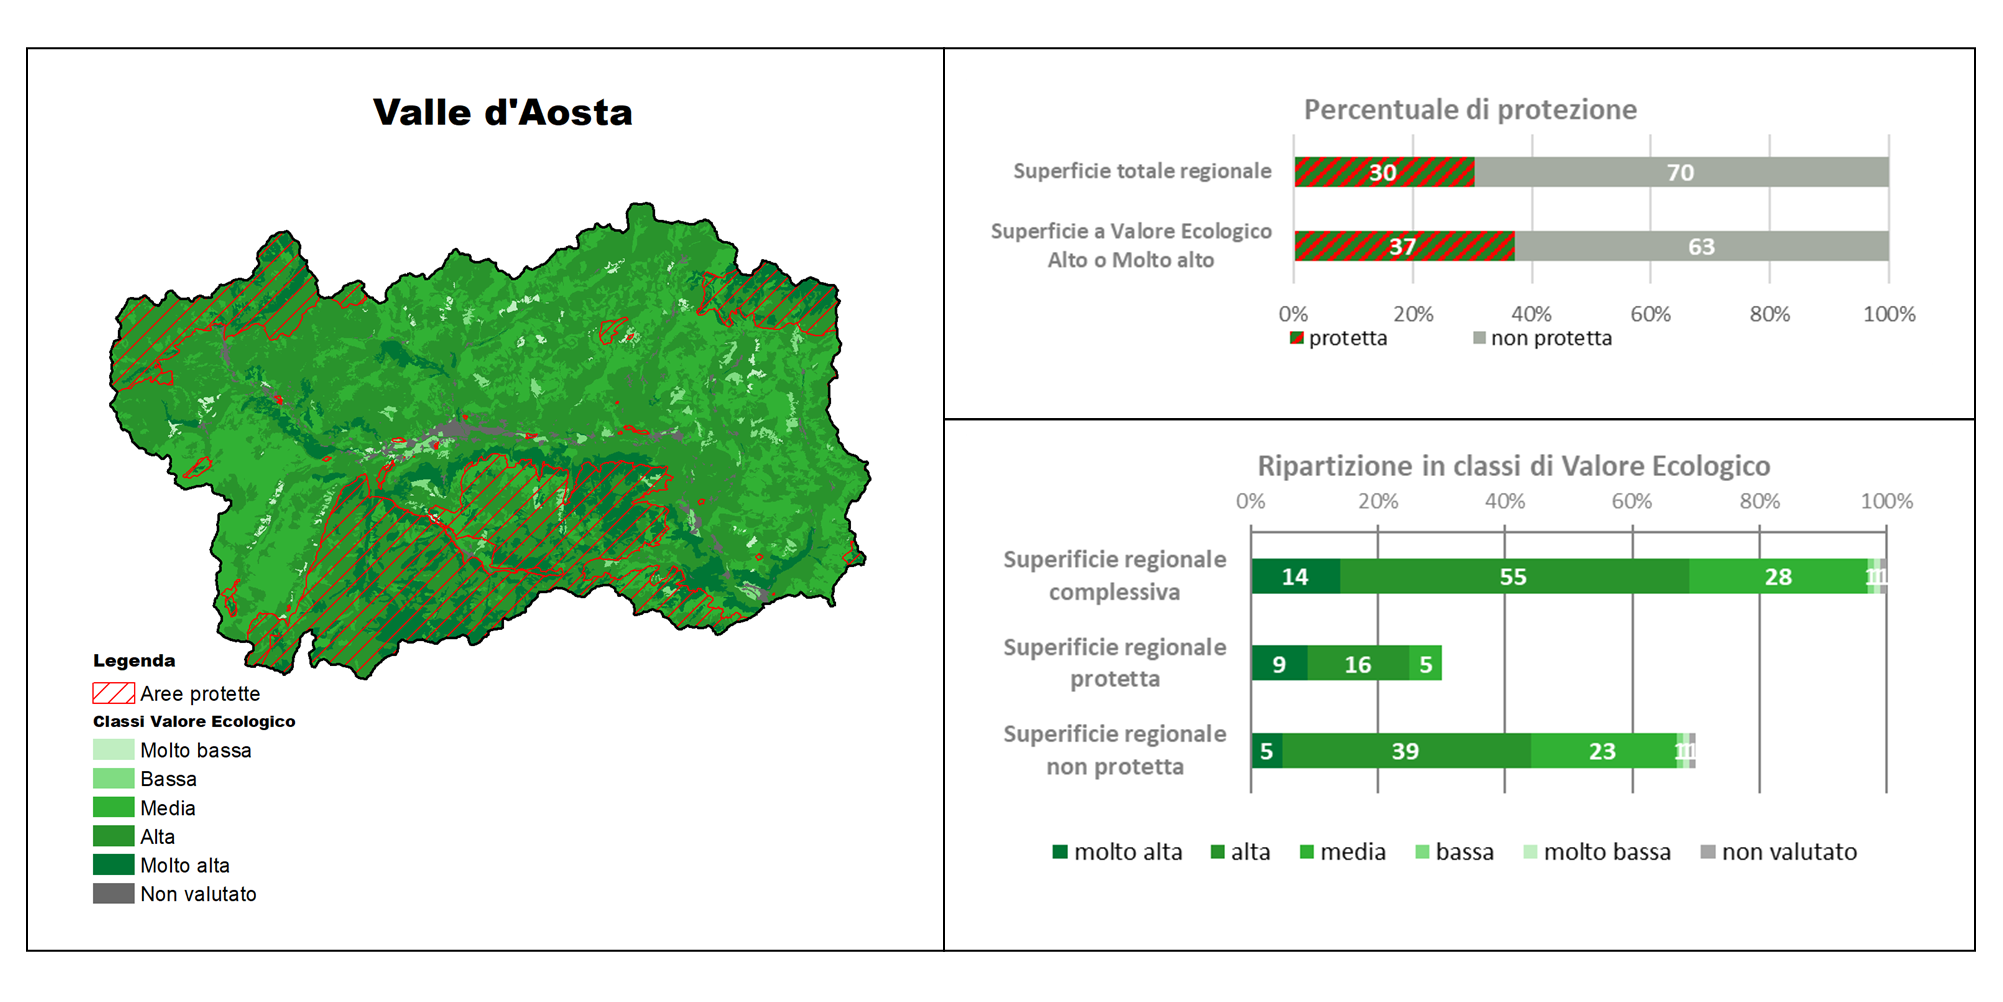
The indicator, though not covering the entire national territory, encompasses 79% of Italy’s surface, including northern, central, southern regions, and islands. While positive aspects are observed, there are conservation concerns: in 9 of 17 regions, high/very high VE areas exceed 30% of total territory, while in 5 regions low/very low/non-evaluated VE areas reach or exceed 60%. A strong correlation is observed between protected areas and high VE zones, with an average protected coverage of 48.8% in the 17 analyzed regions. However, high VE areas also exist outside protected areas, sometimes within low natural value or artificial contexts. Total protected area reaches or exceeds 30% of regional territory only in 3 of the 17 regions (Abruzzo, Campania, Valle d’Aosta), matching the EU Biodiversity Strategy 2030 target. This indicates potential for expanding protected areas.
Not definable.
| Data |
|---|
Headline
Table 1: Number of habitats whose area falls totally into the ‘high’ and ‘very high’ Ecological Value classes and relative percentage of protection Data source
ISPRA Nature Map Information System Note
The reference year of the data for each region is made explicit in the relevant figure |
Thumbnail
Titolo
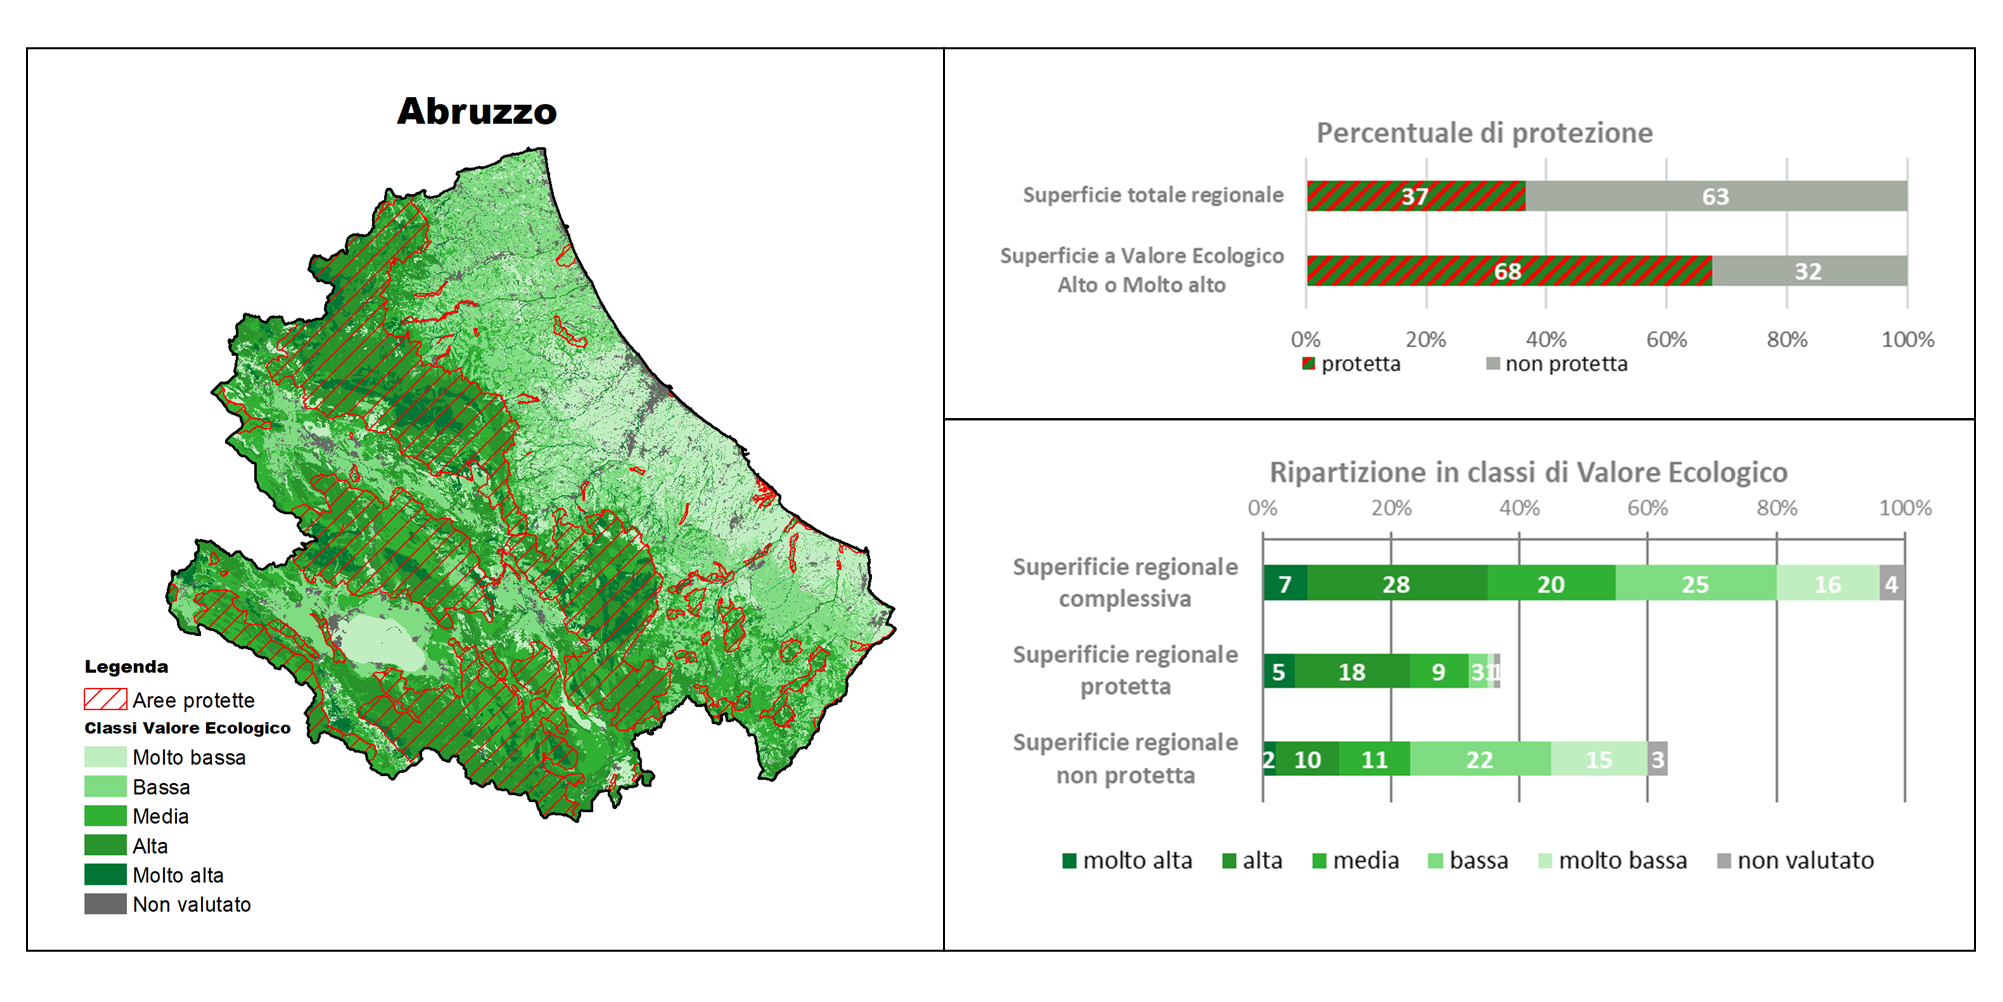
Figure 1: Distribution of Ecological Value in the Abruzzo Region Fonte
ISPRA, Nature Map Information System, Habitat Map of the Abruzzo Region (2011) and assessments; ISTAT, administrative boundaries (2011); MASE, Protected Areas boundaries (2017, 2021). |
Thumbnail
Titolo
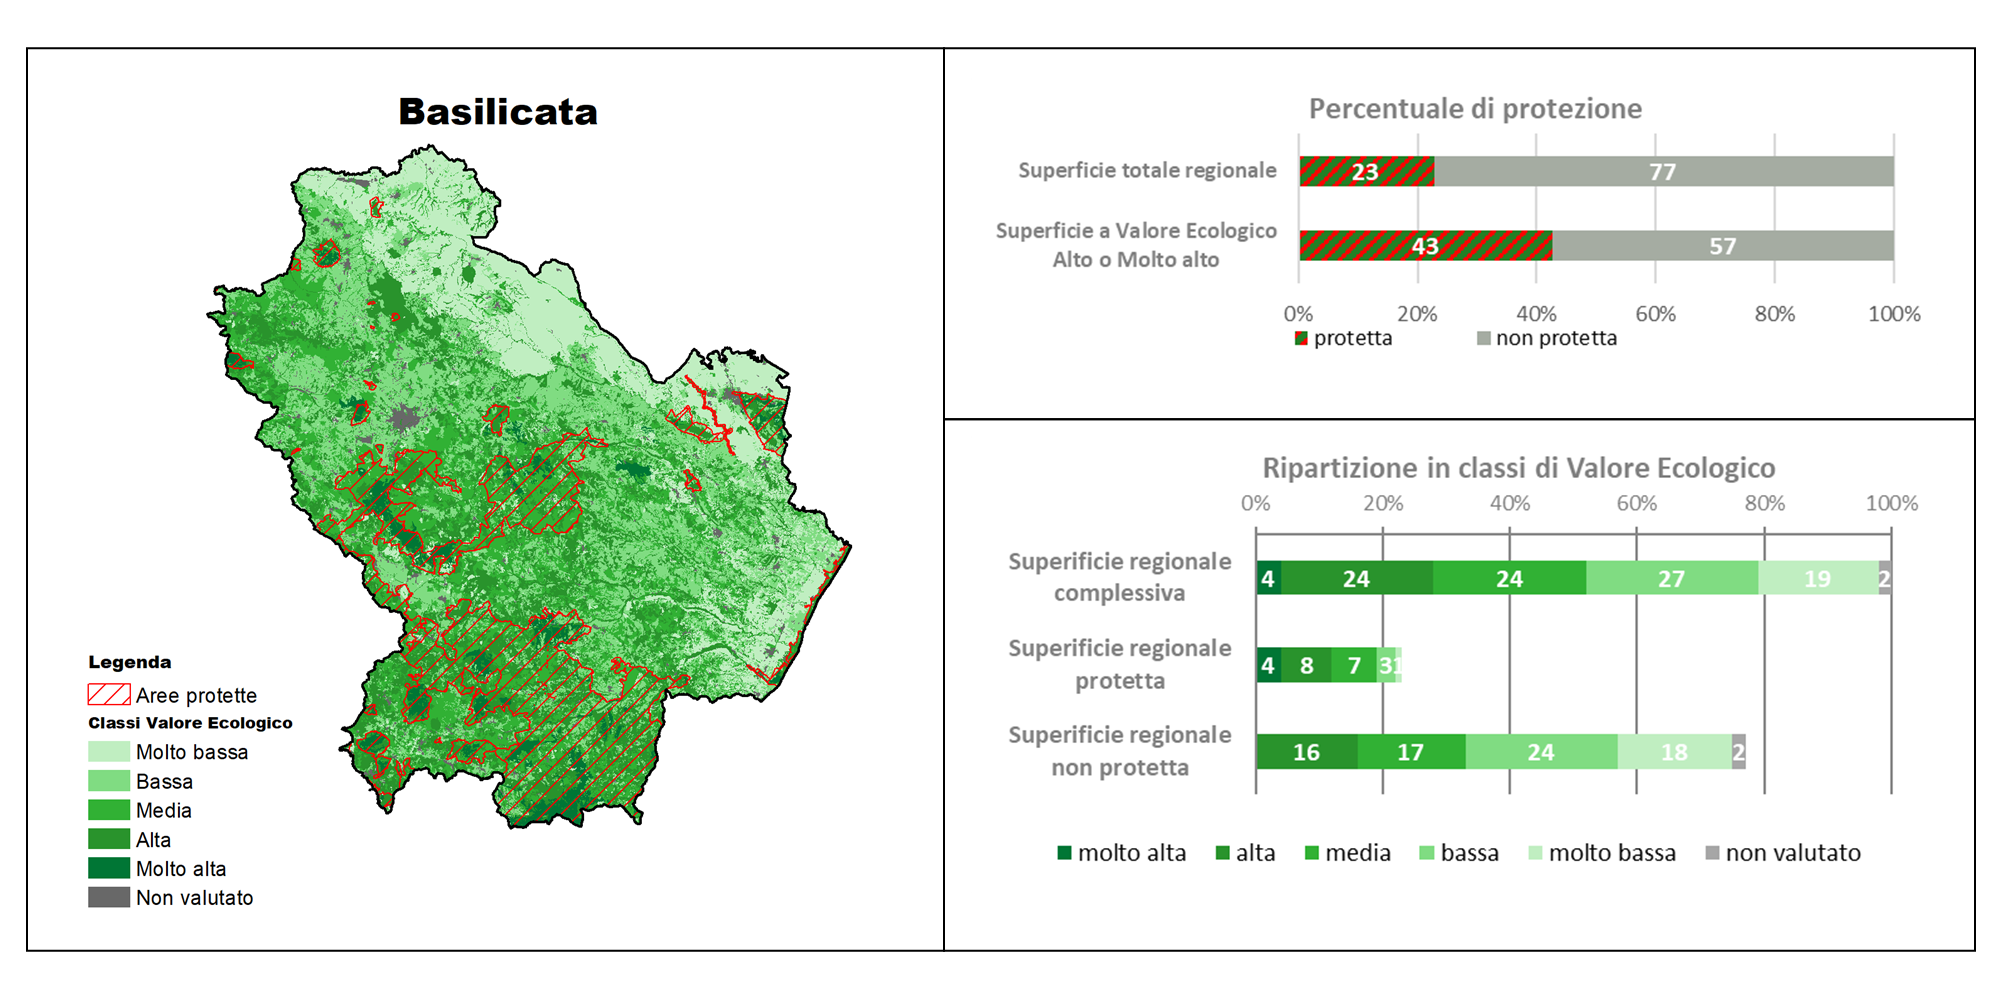
Figure 2: Distribution of Ecological Value in the Basilicata Region Fonte
ISPRA, Nature Map Information System, Habitat Map of the Basilicata Region (2012) and assessments; ISTAT, administrative boundaries (2011); MASE, Protected Areas boundaries (2017, 2021) Note
ISPRA, Sistema Informativo Carta della Natura, Carta degli habitat della Regione Basilicata (2012) e valutazioni; ISTAT, confini amministrativi (2011); MASE, confini Aree Protette (2017, 2021). |
Thumbnail
Titolo
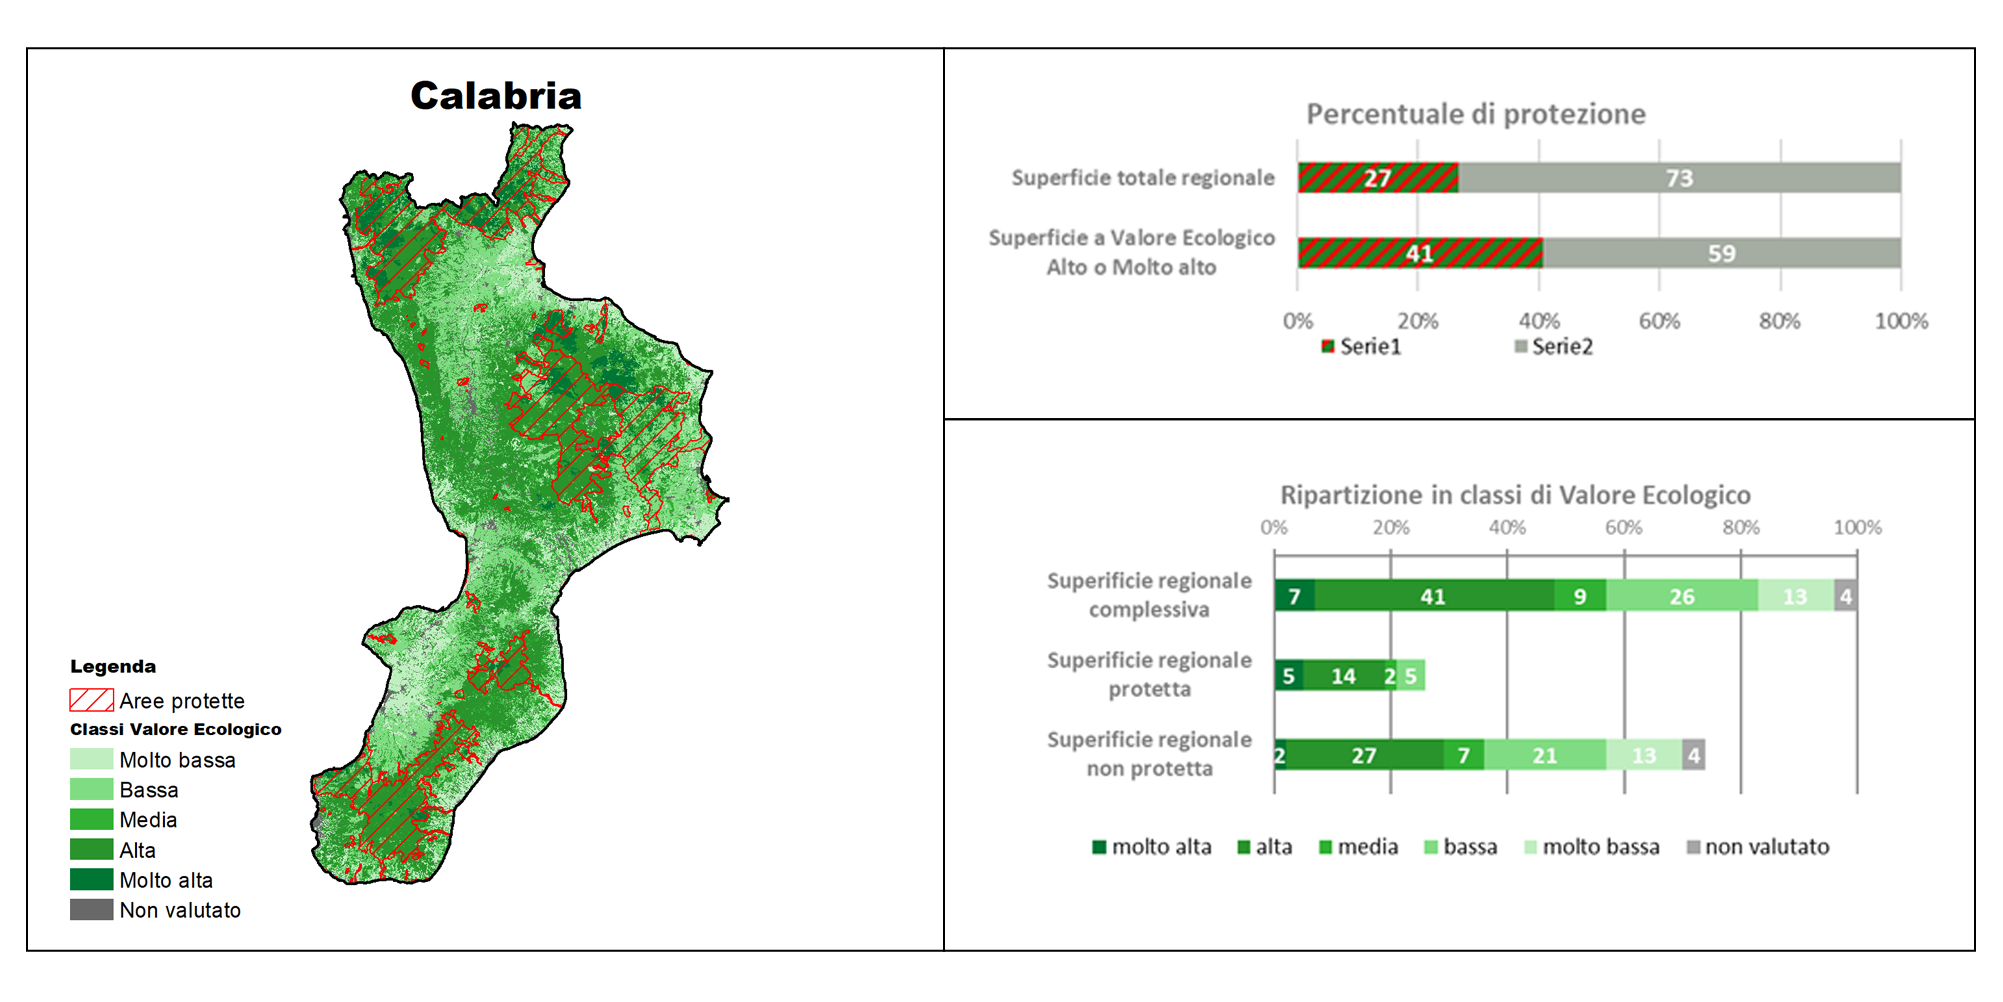
Figure 3: Distribution of Ecological Value in the Calabria Region Fonte
ISPRA, Nature Map Information System, Habitat Map of the Calabria Region (2023) and assessments; ISTAT, administrative boundaries (2011); MASE, Protected Areas boundaries (2017, 2023). |
Thumbnail
Titolo
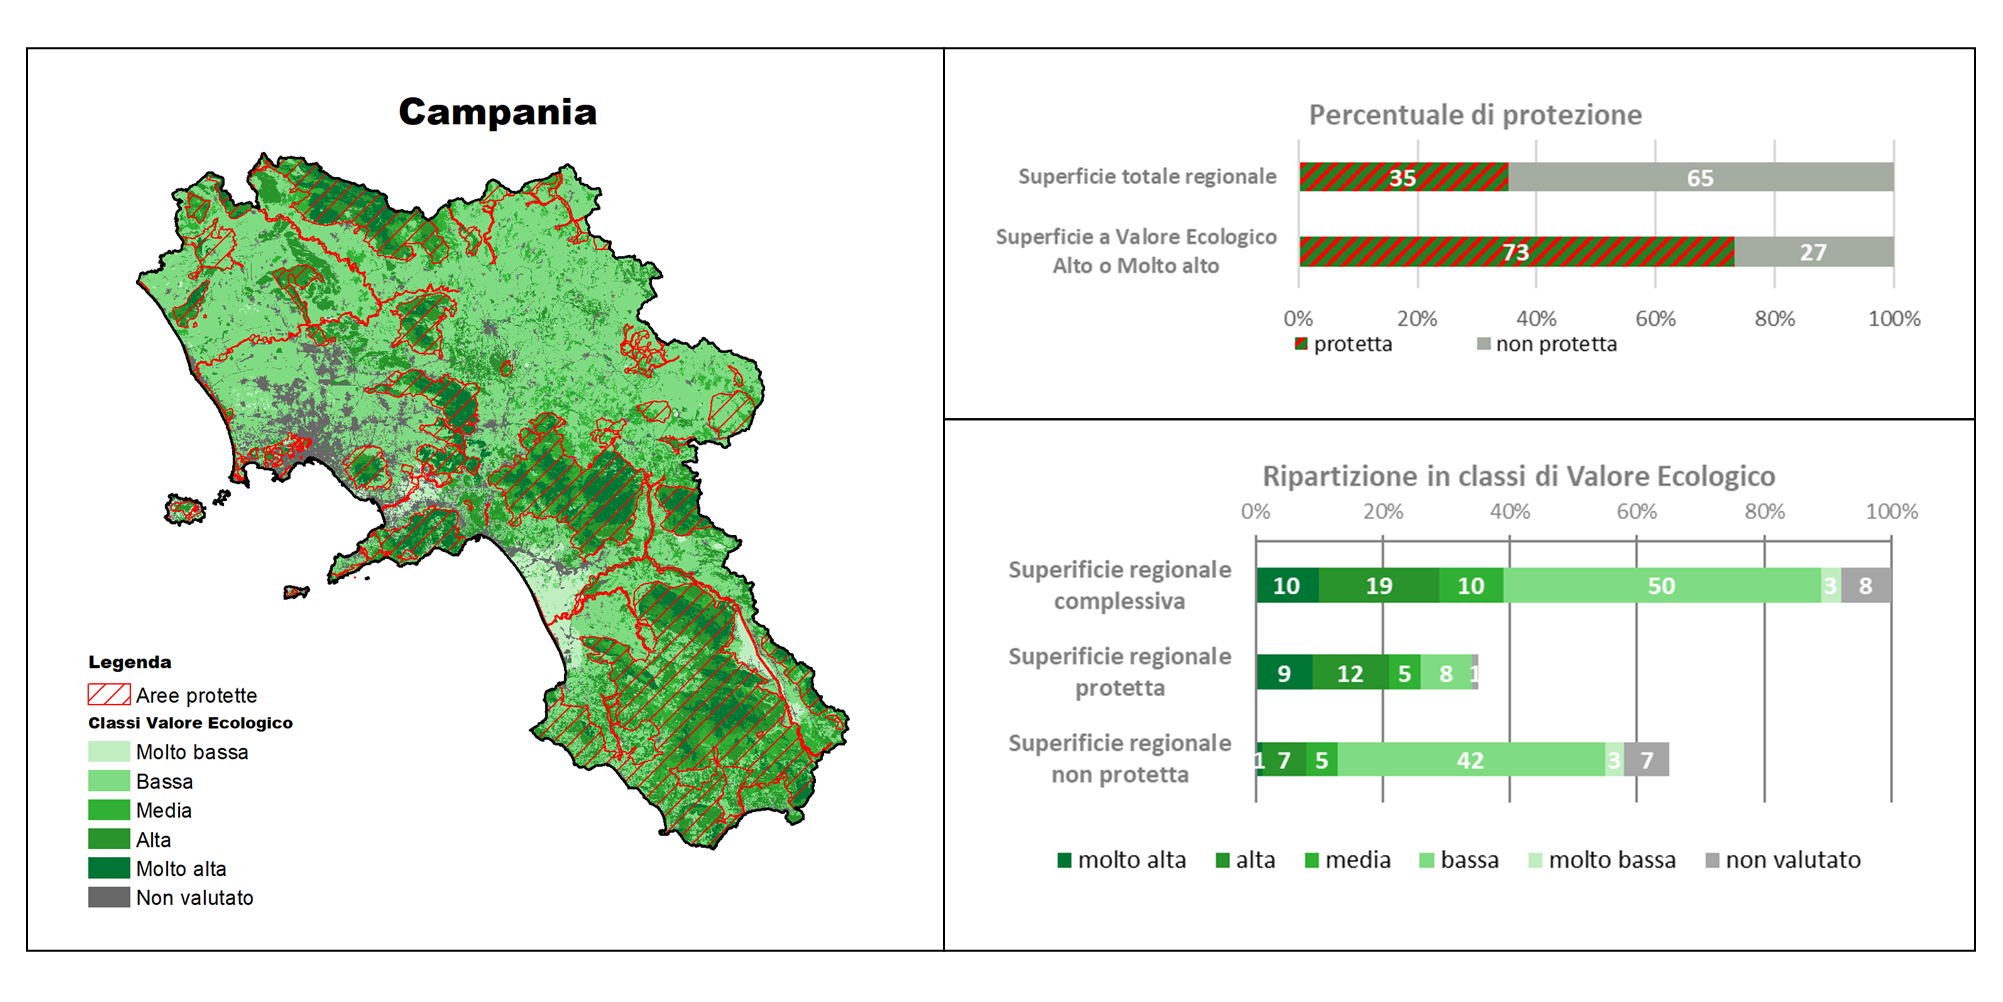
Figure 4: Distribution of Ecological Value in the Campania Region Fonte
ISPRA, Nature Map Information System, Habitat Map of the Campania Region (2017) and assessments; ISTAT, administrative boundaries (2011); MASE, Protected Areas boundaries (2017, 2021) |
Thumbnail
Titolo
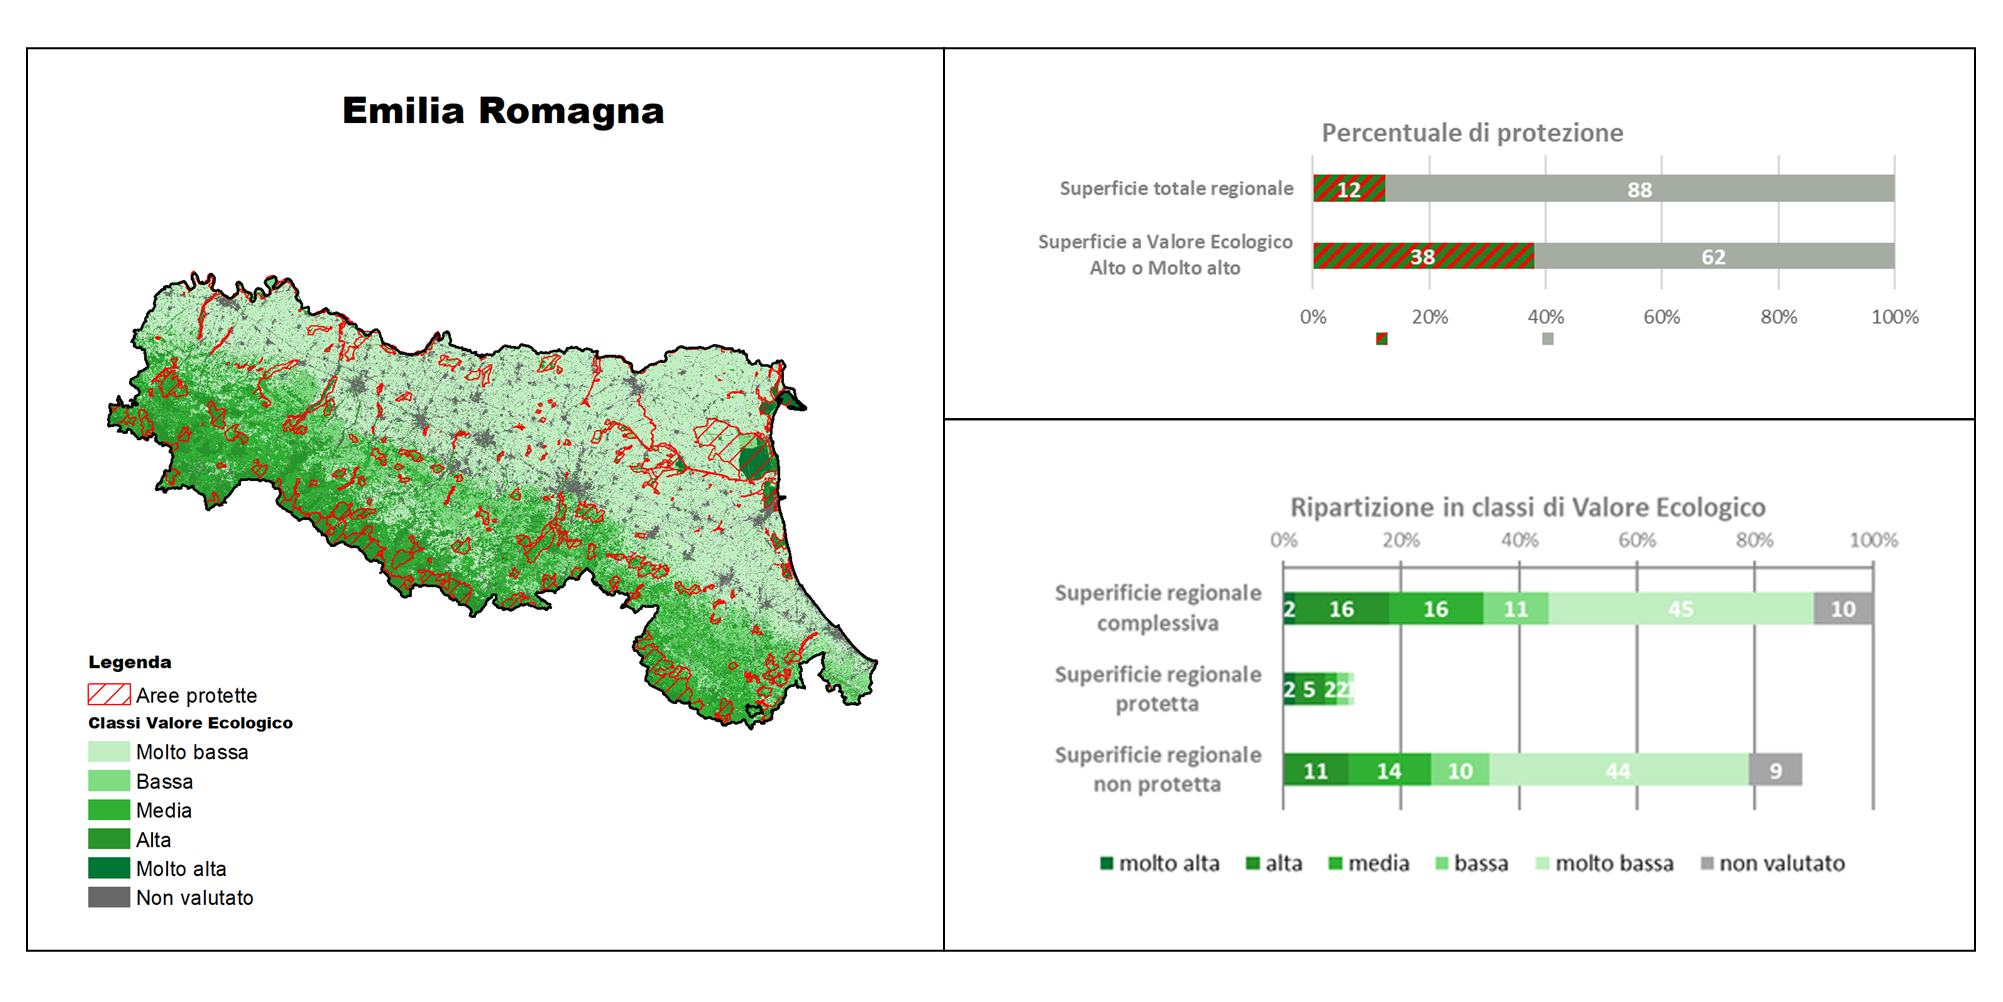
Figure 5: Distribution of Ecological Value in the Emilia-Romagna Region Fonte
ISPRA, Nature Map Information System, Habitat Map of the Emilia-Romagna Region (2021) and assessments; ISTAT, administrative boundaries (2011); MASE, Protected Areas boundaries (2017, 2021) |
Thumbnail
Titolo
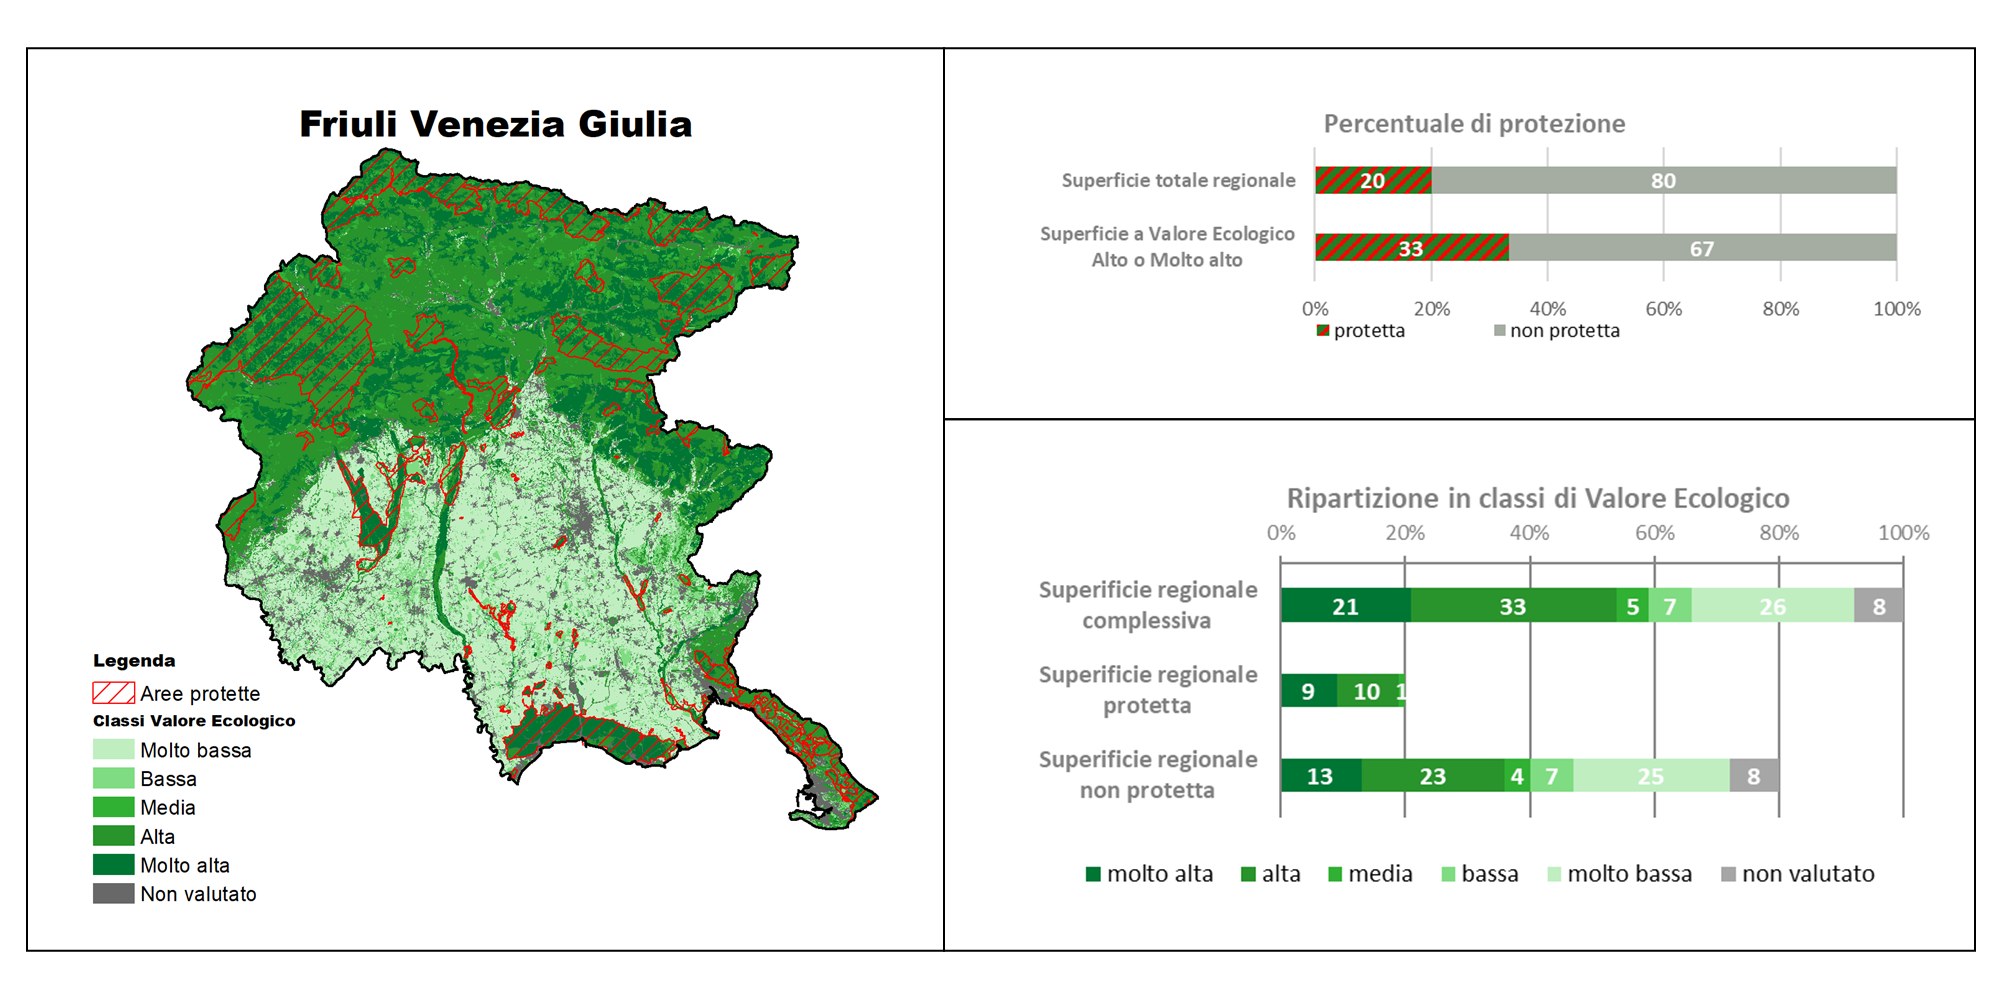
Figure 6: Distribution of Ecological Value in the Friuli-Venezia Giulia Region Fonte
ISPRA, Nature Map Information System, Habitat Map of the Friuli Venezia Giulia Region (2021) and assessments; ISTAT, administrative boundaries (2011); MASE, Protected Areas boundaries (2017, 2021) |
Thumbnail
Titolo
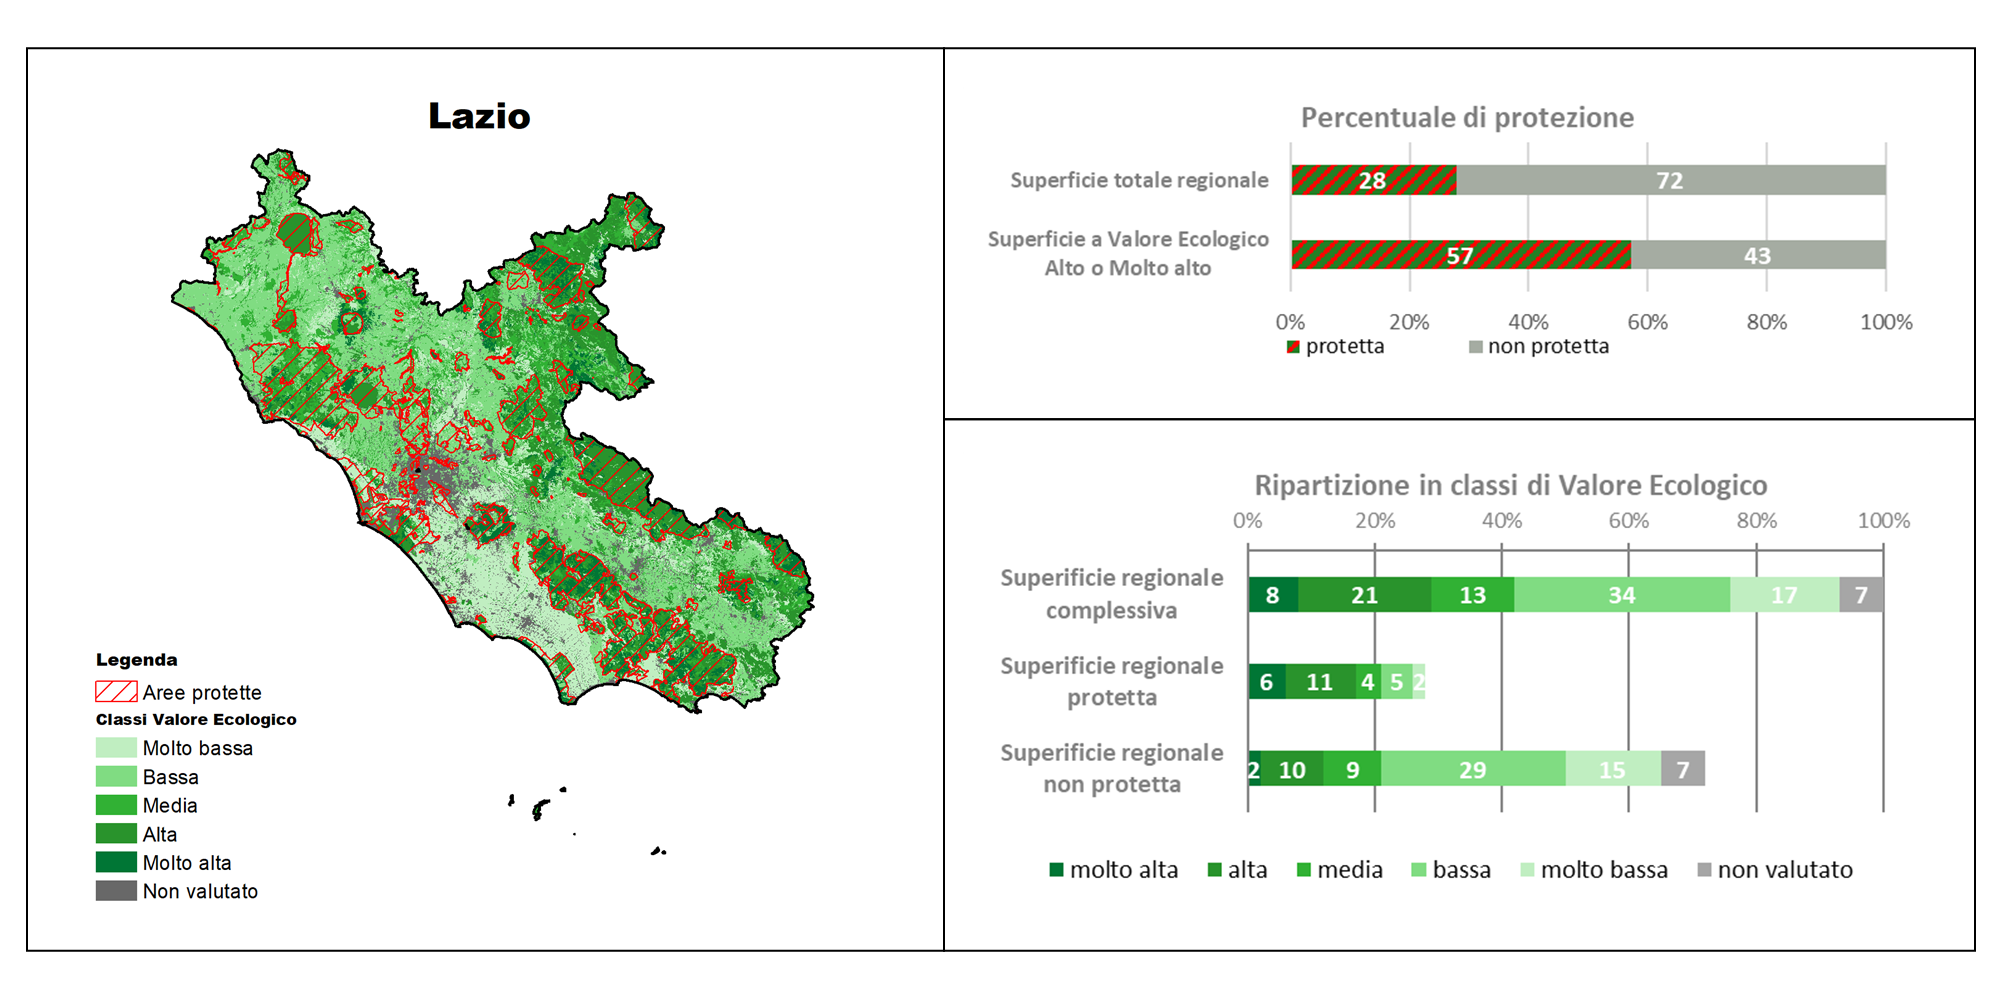
Figure 7: Distribution of Ecological Value in the Lazio Region Fonte
ISPRA, Nature Map Information System, Habitat Map of the Lazio Region (2008) and assessments; ISTAT, administrative boundaries (2011); MASE, Protected Areas boundaries (2017, 2021) |
Thumbnail
Titolo
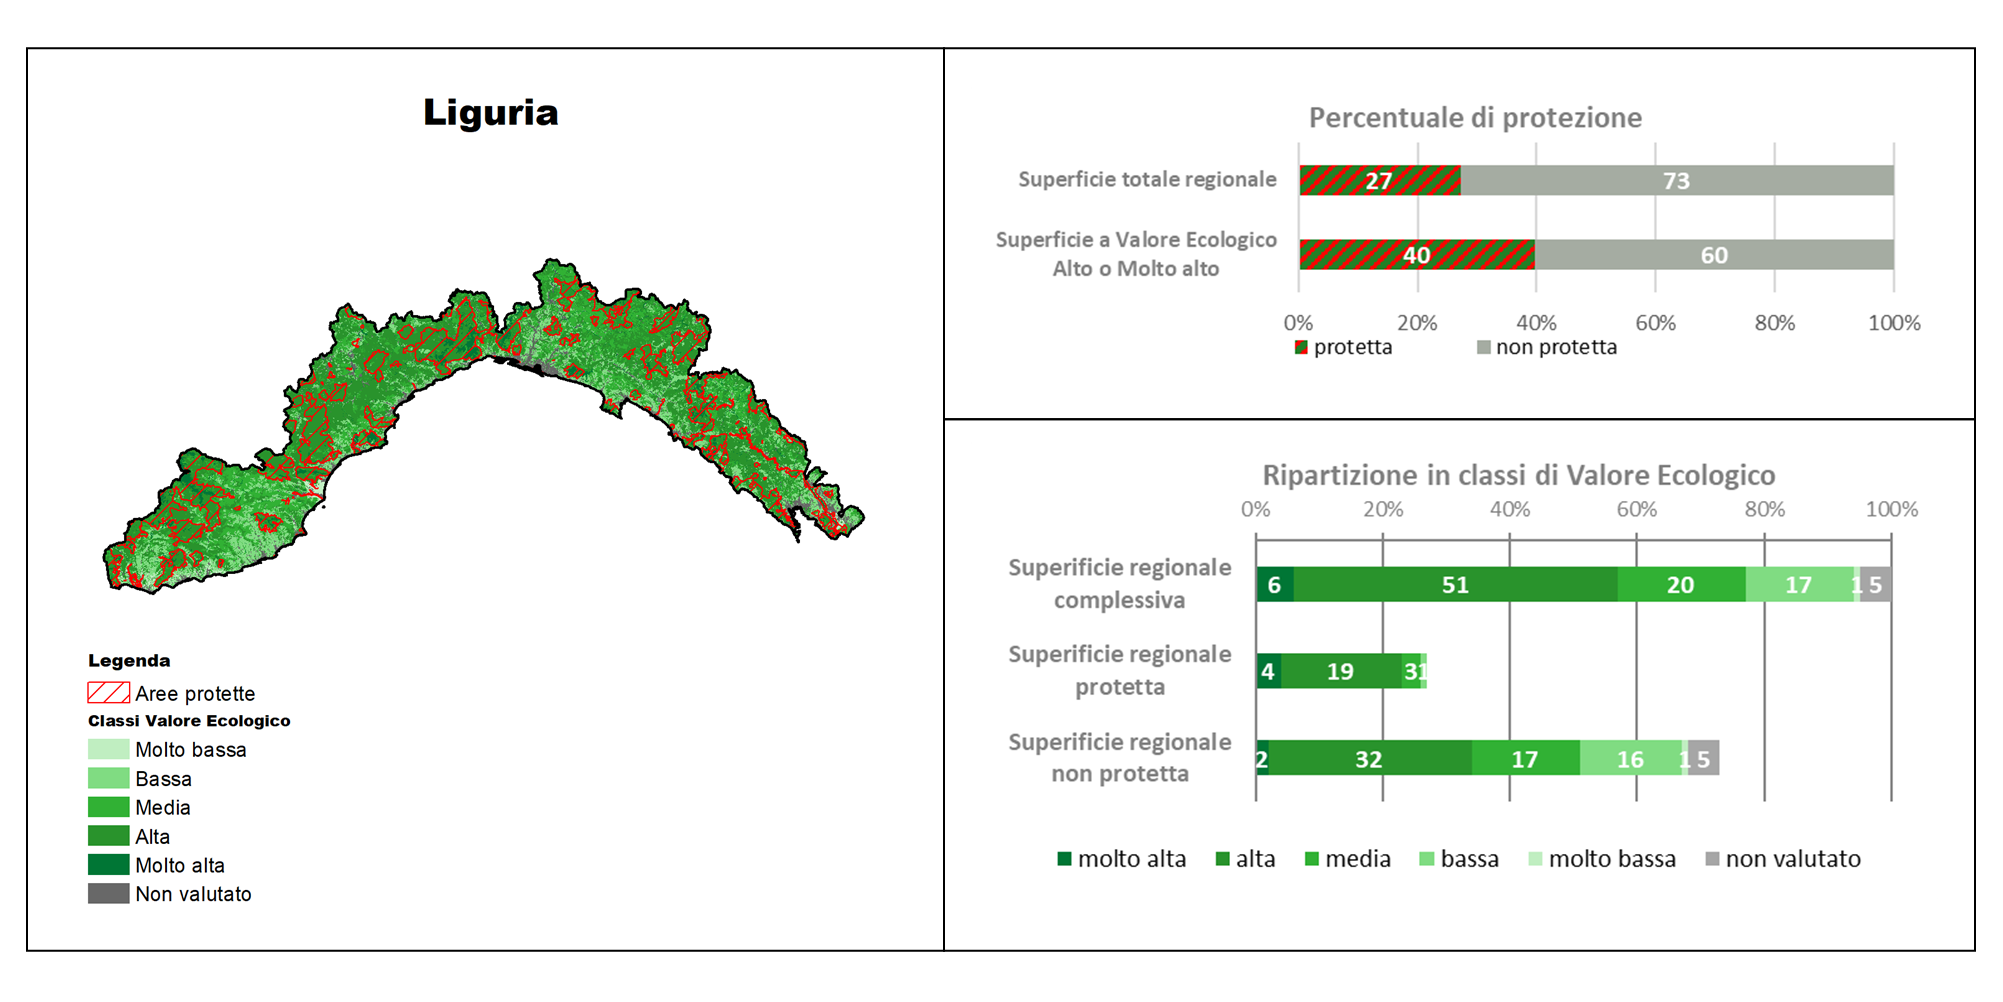
Figure 8: Distribution of Ecological Value in the Liguria Region Fonte
ISPRA, Nature Map Information System, Habitat Map of the Liguria Region (2013) and assessments; ISTAT, administrative boundaries (2011); MASE, Protected Areas boundaries (2017, 2021) |
Thumbnail
Titolo
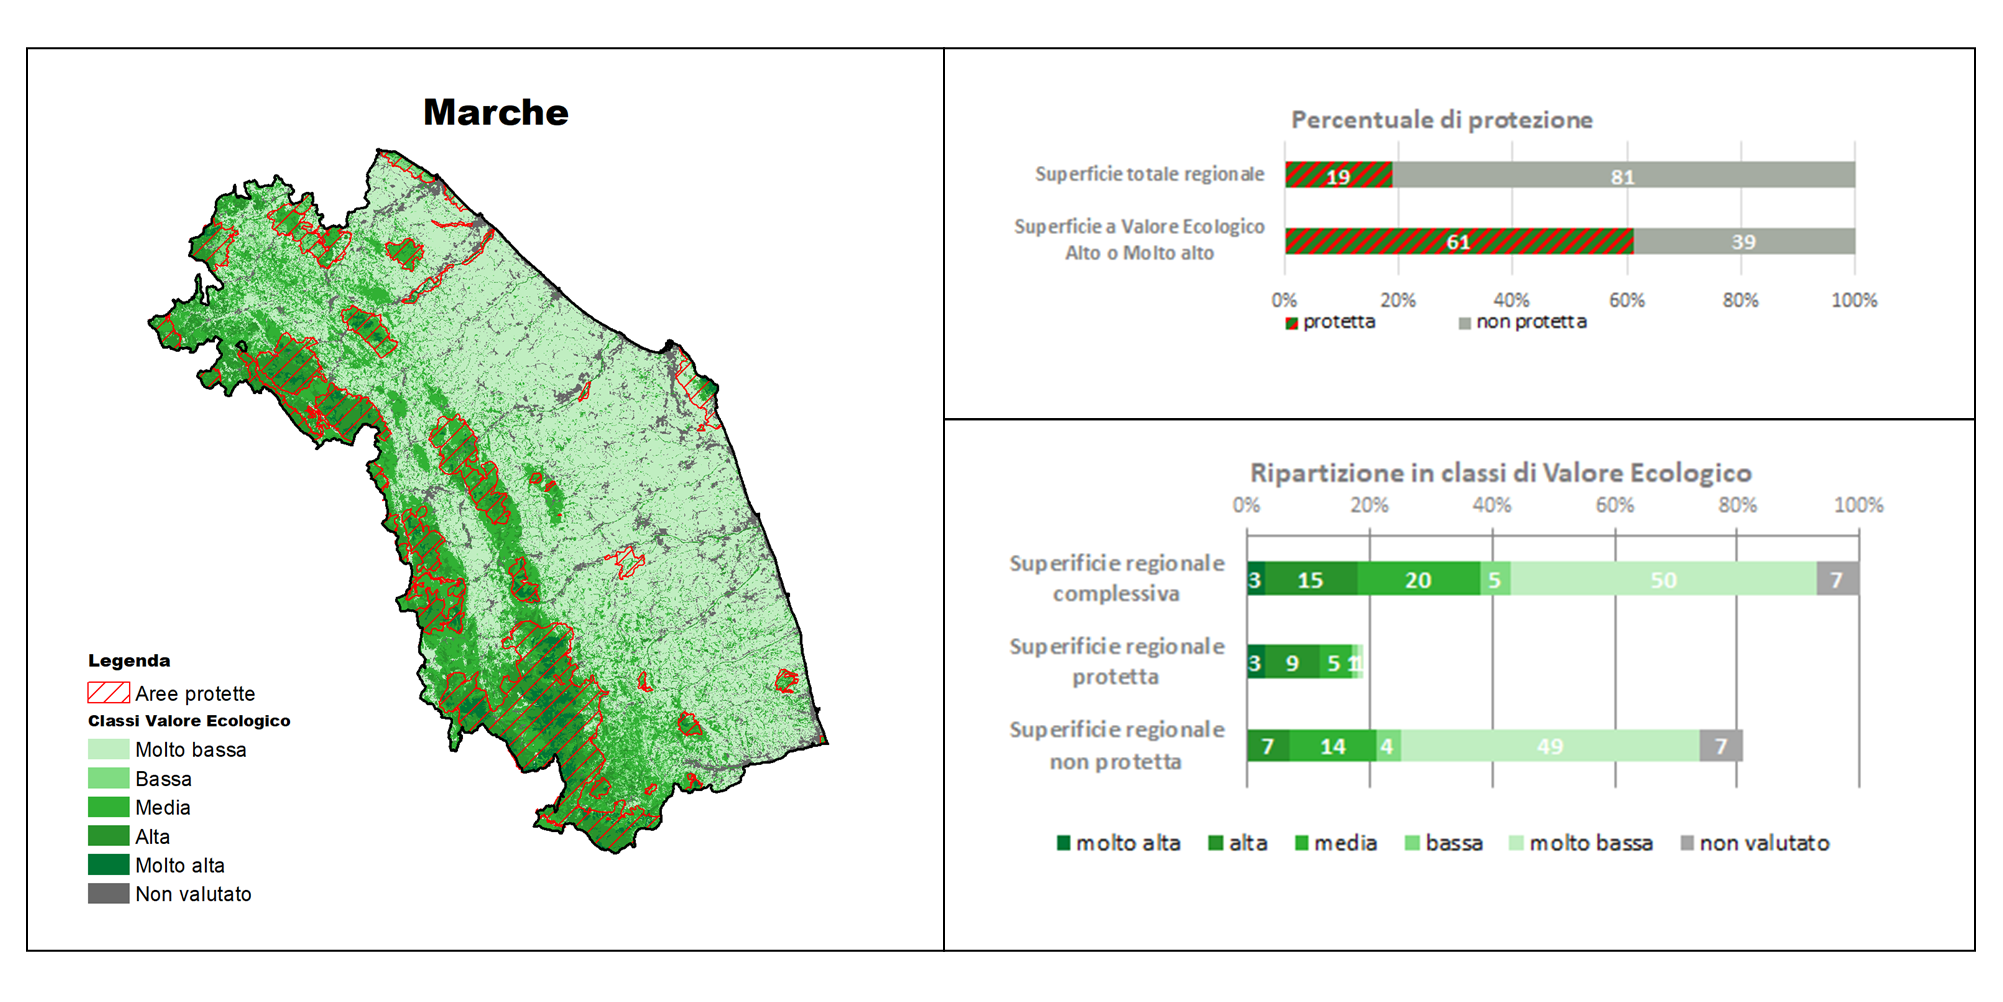
Figure 9: Distribution of Ecological Value in the Marche Region Fonte
ISPRA, Nature Map Information System, Habitat Map of the Marche Region (2022) and assessments; ISTAT, administrative boundaries (2011); MASE, Protected Areas boundaries (2017, 2021) |
Thumbnail
Titolo
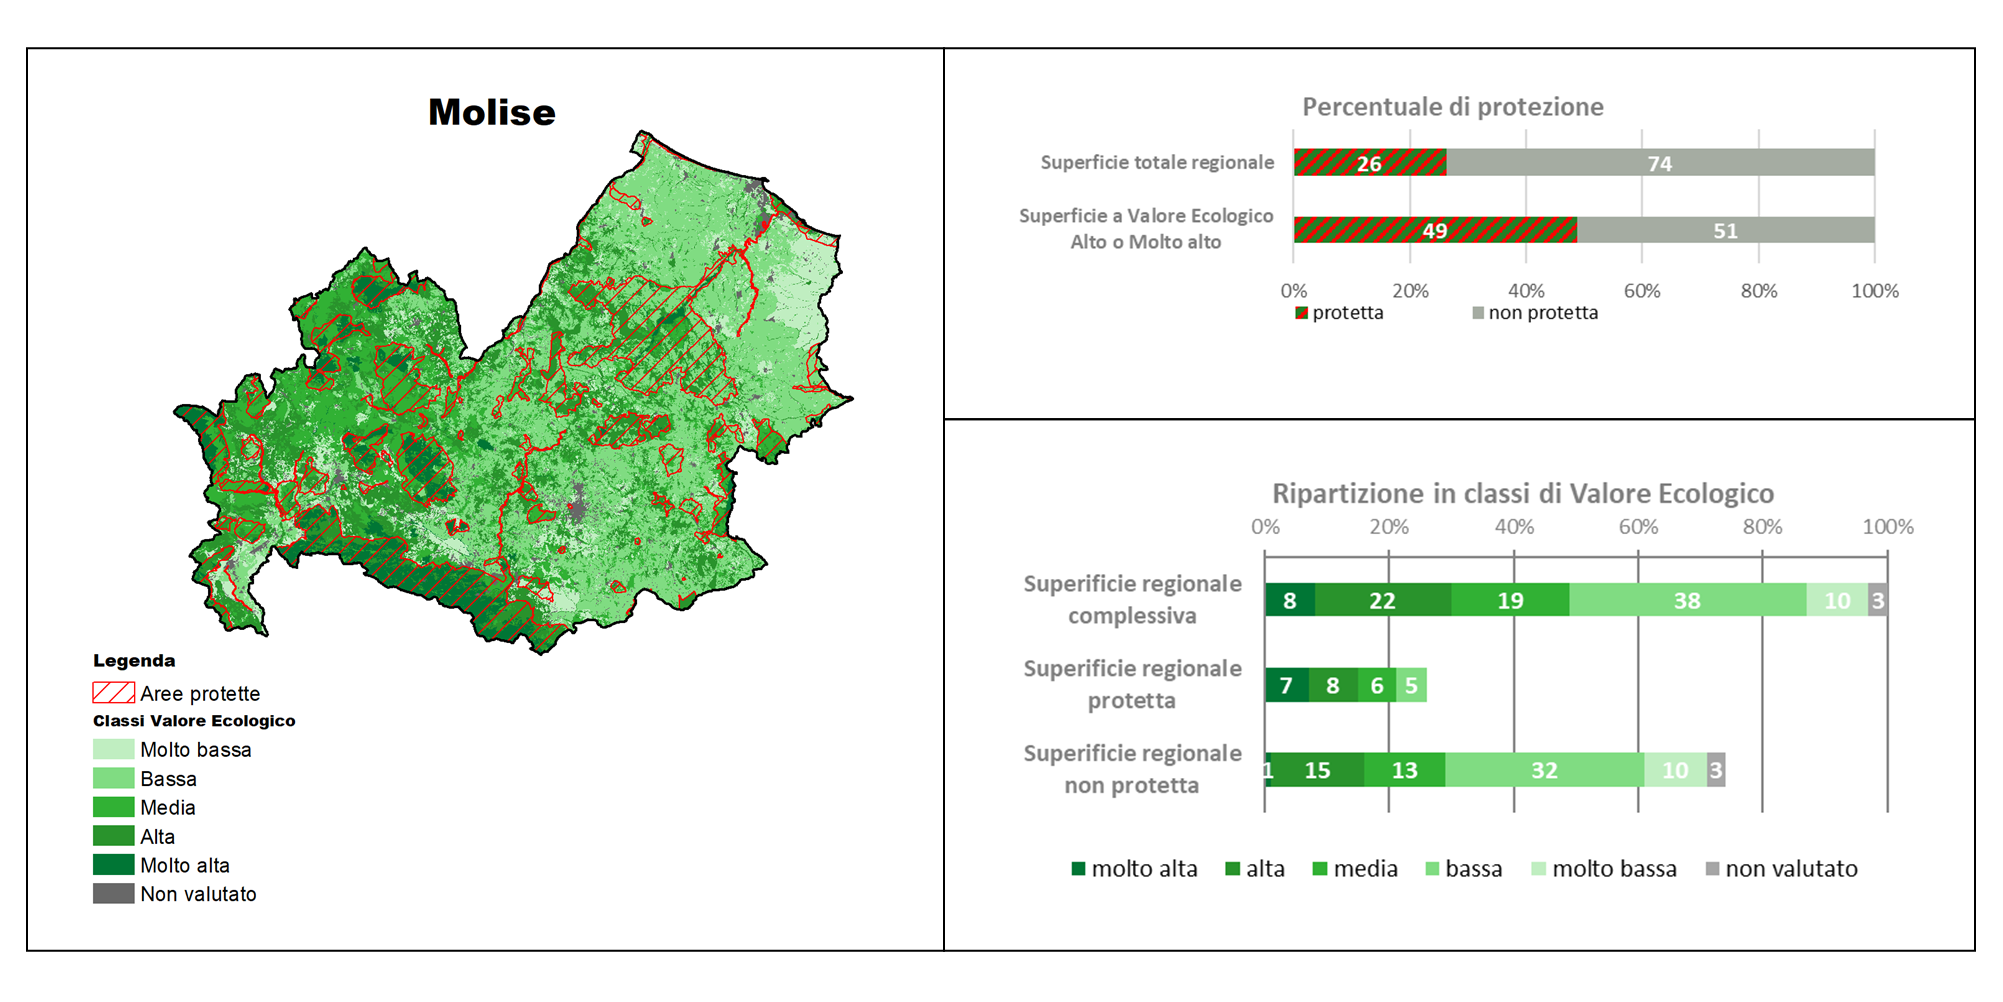
Figure 10: Distribution of Ecological Value in the Molise Region Fonte
ISPRA, Nature Map Information System, Habitat Map of the Molise Region (2021) and assessments; ISTAT, administrative boundaries (2011); MASE, Protected Areas boundaries (2017, 2021) |
Thumbnail
Titolo
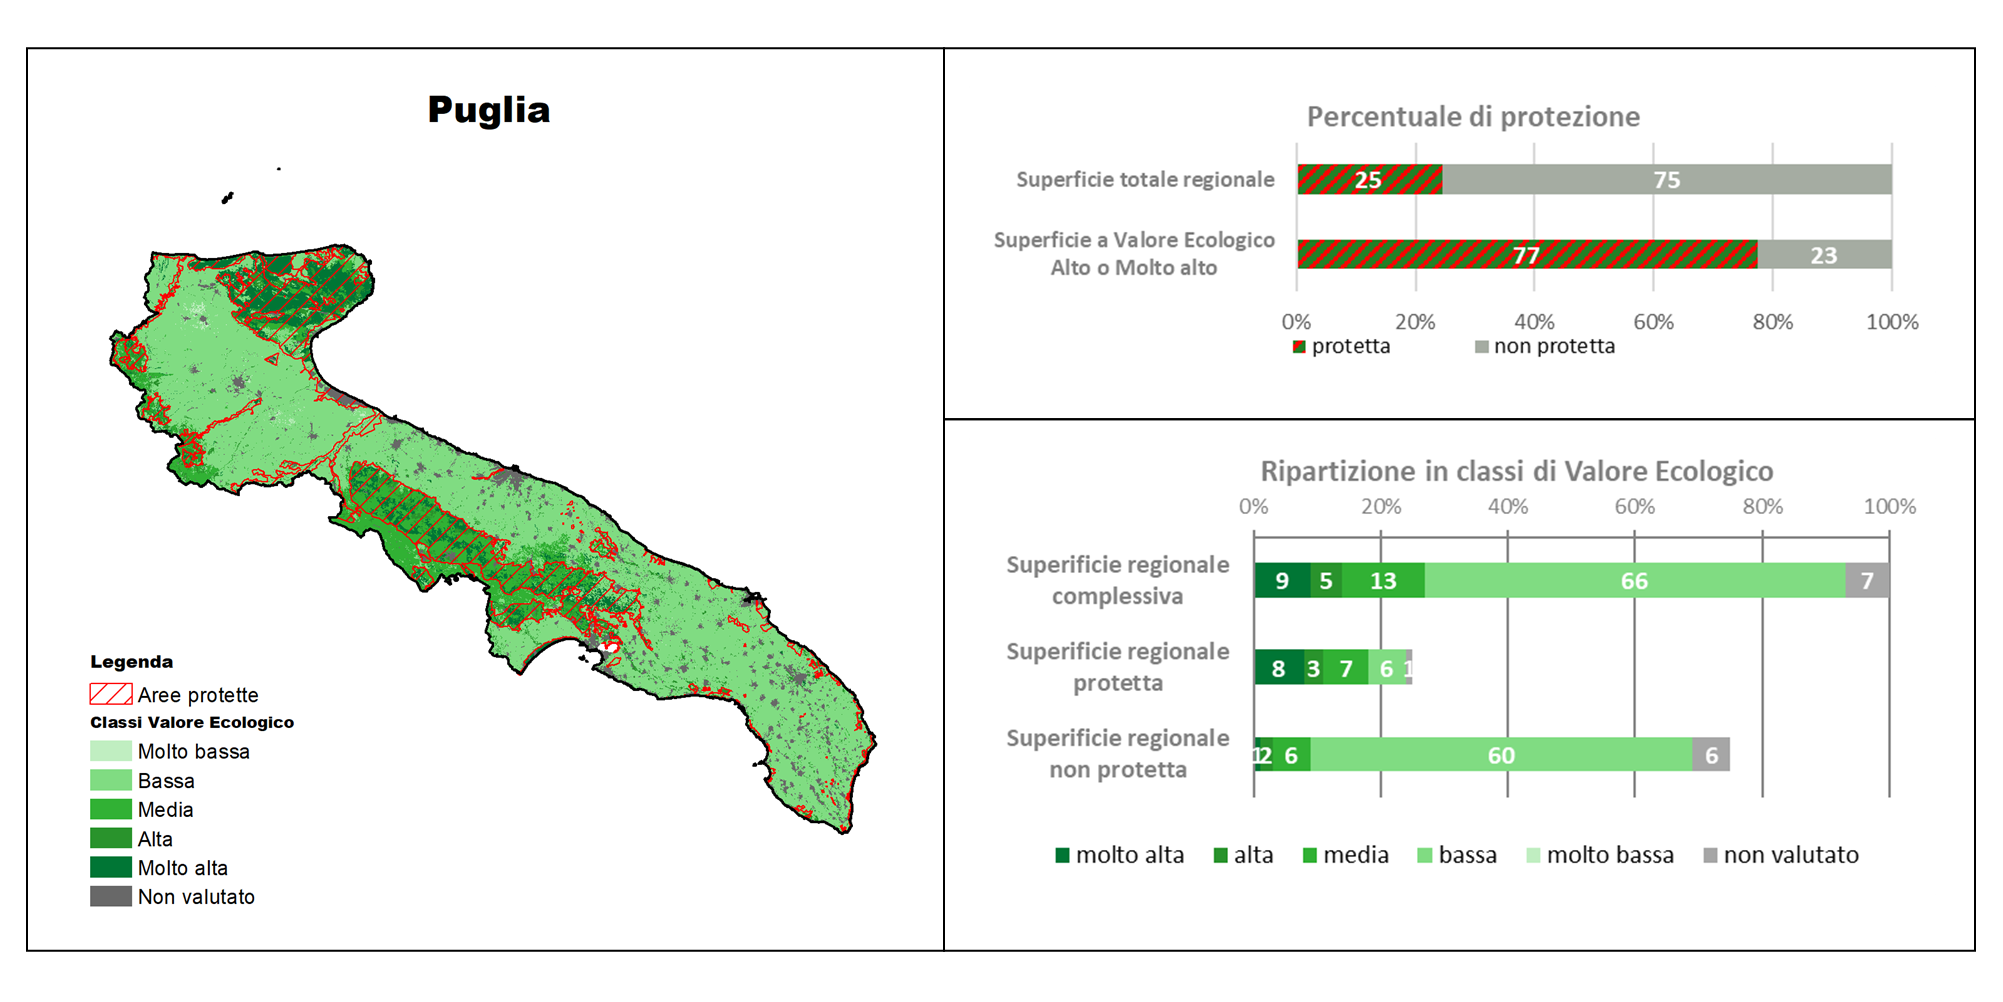
Figure 11: Distribution of Ecological Value in the Apulia Region Fonte
ISPRA, Nature Map Information System, Habitat Map of the Apulia Region (2012) and assessments; ISTAT, administrative boundaries (2011); MASE, Protected Areas boundaries (2017, 2021) |
Thumbnail
Titolo
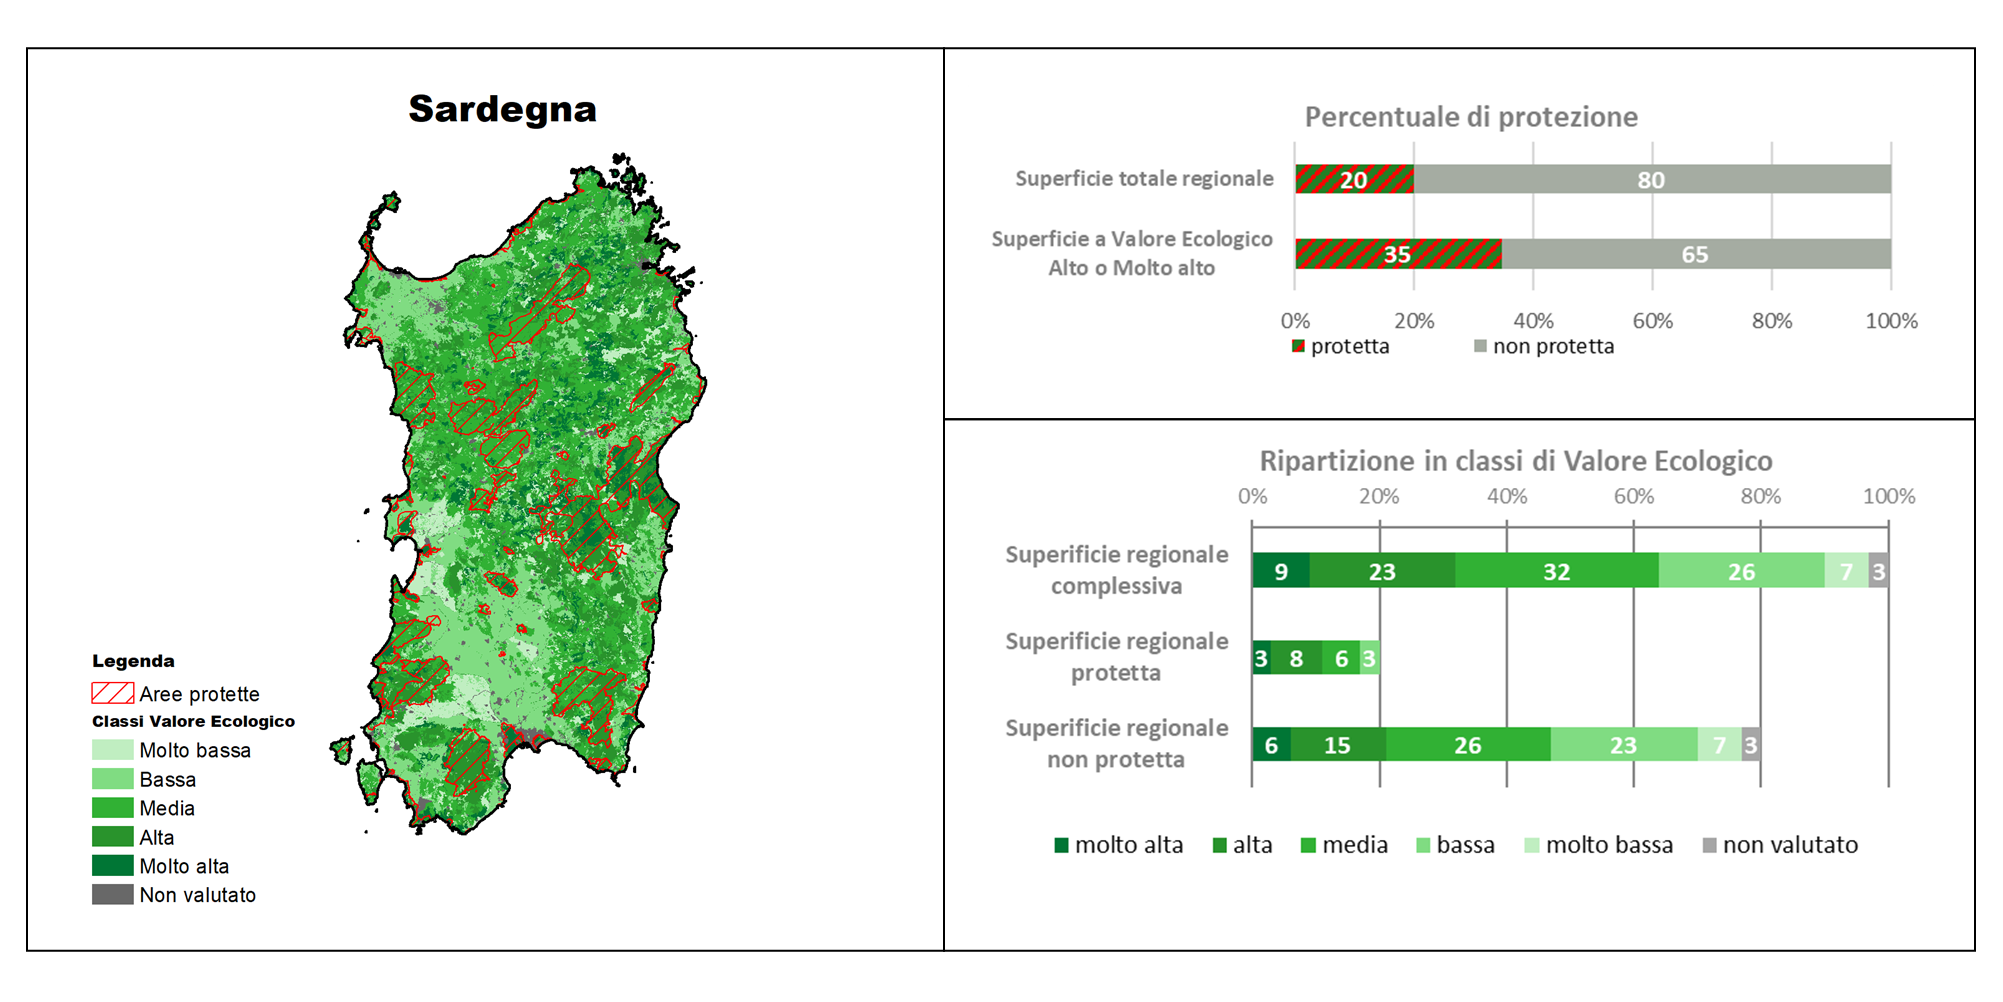
Figure 12: Distribution of Ecological Value in the Sardinia Region Fonte
ISPRA, Nature Map Information System, Habitat Map of the Sardinia Region (2011) and assessments; ISTAT, administrative boundaries (2011); MASE, Protected Areas boundaries (2017, 2021) |
Thumbnail
Titolo
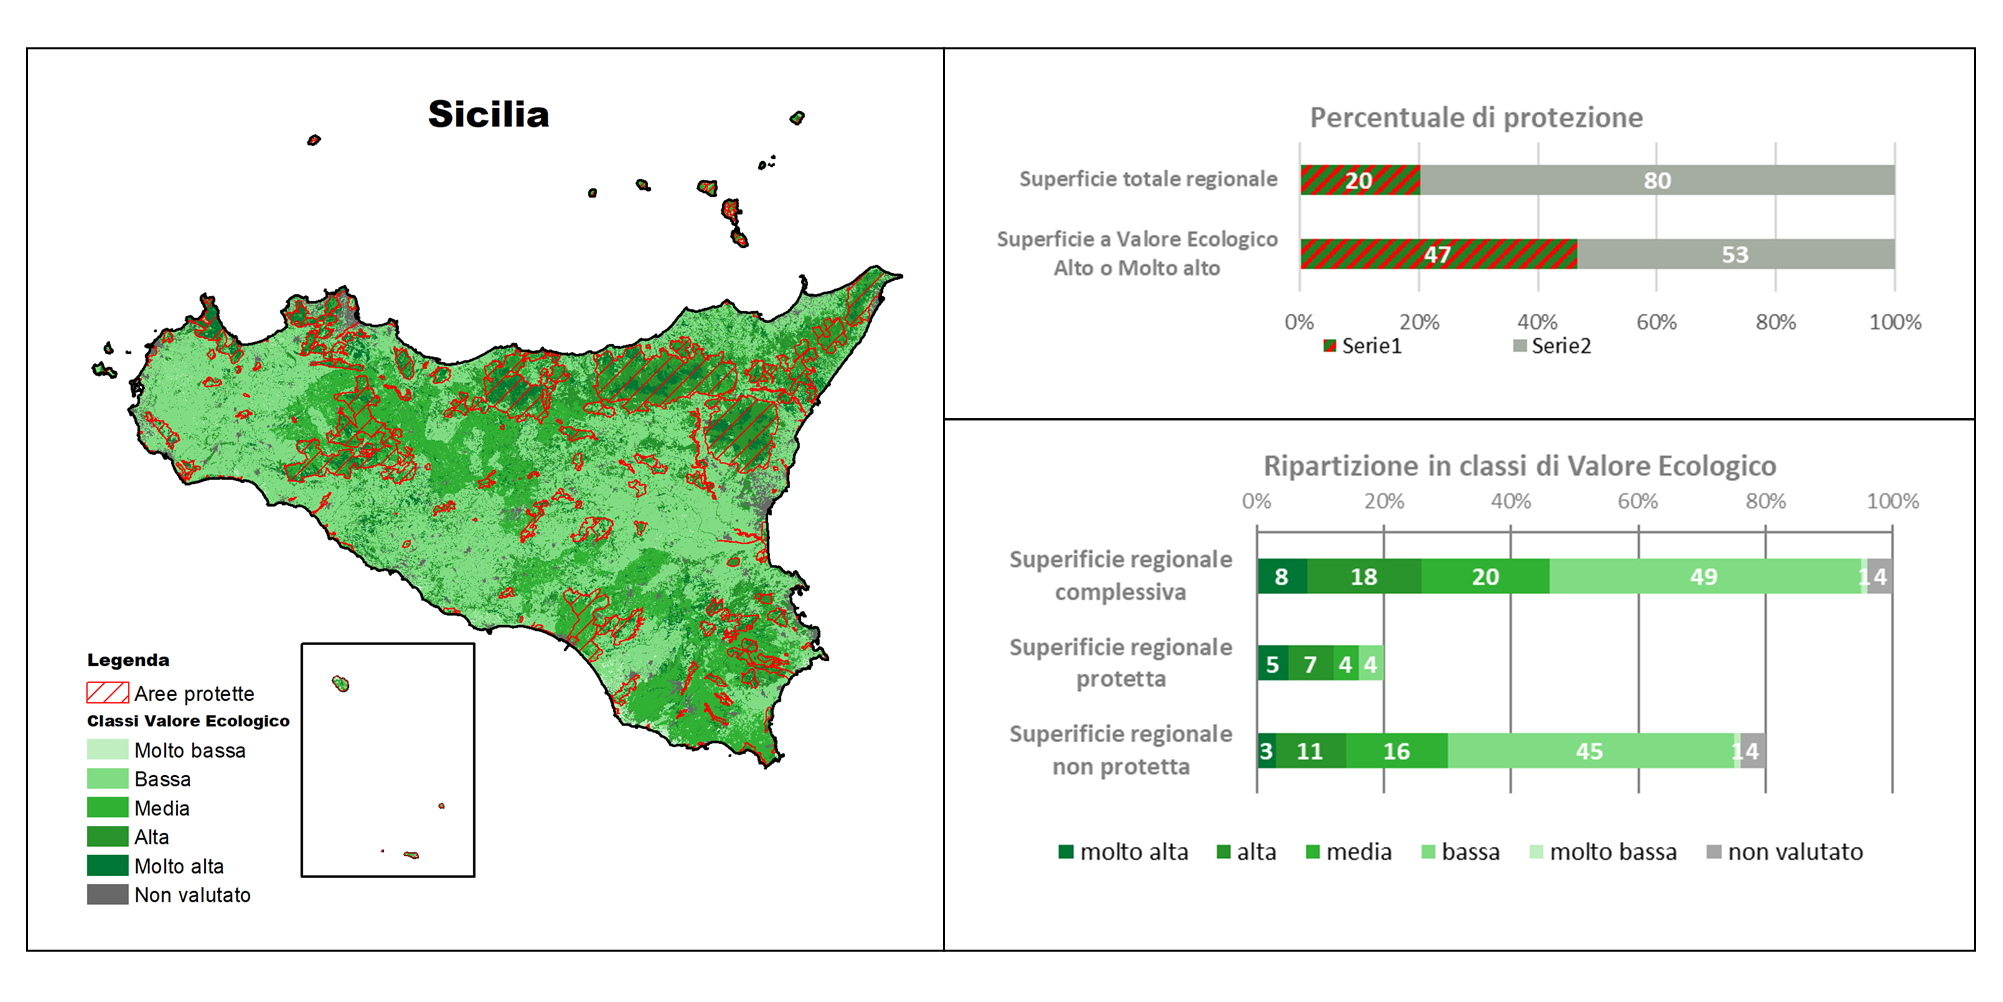
Figure 13: Distribution of Ecological Value in the Sicily Region Fonte
ISPRA, Nature Map Information System, Habitat Map of the Sicily Region (2008) and assessments; ISTAT, administrative boundaries (2011); MASE, Protected Areas boundaries (2017, 2021) |
Thumbnail
Titolo
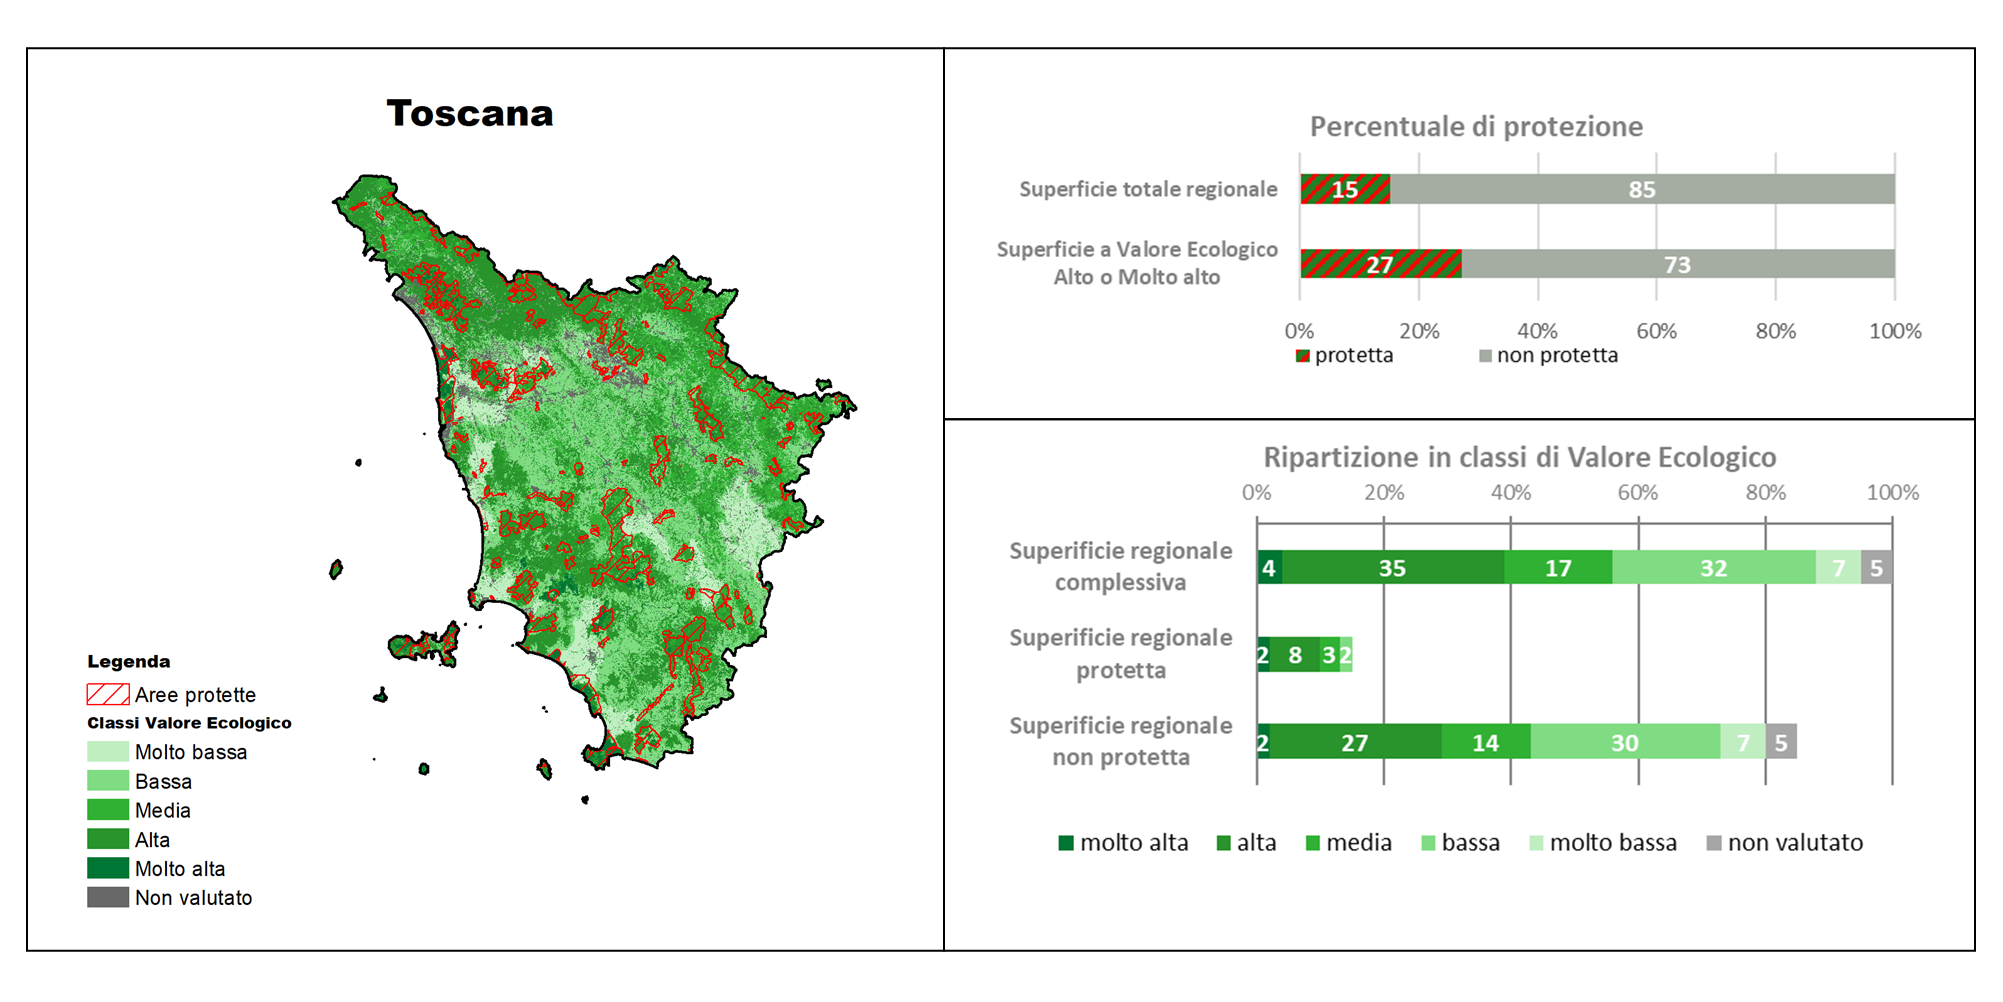
Figure 14: Distribution of Ecological Value in the Tuscany Region Fonte
ISPRA, Nature Map Information System, Habitat Map of the Tuscany Region (2019) and assessments; ISTAT, administrative boundaries (2011); MASE, Protected Areas boundaries (2017, 2021) |
Thumbnail
Titolo
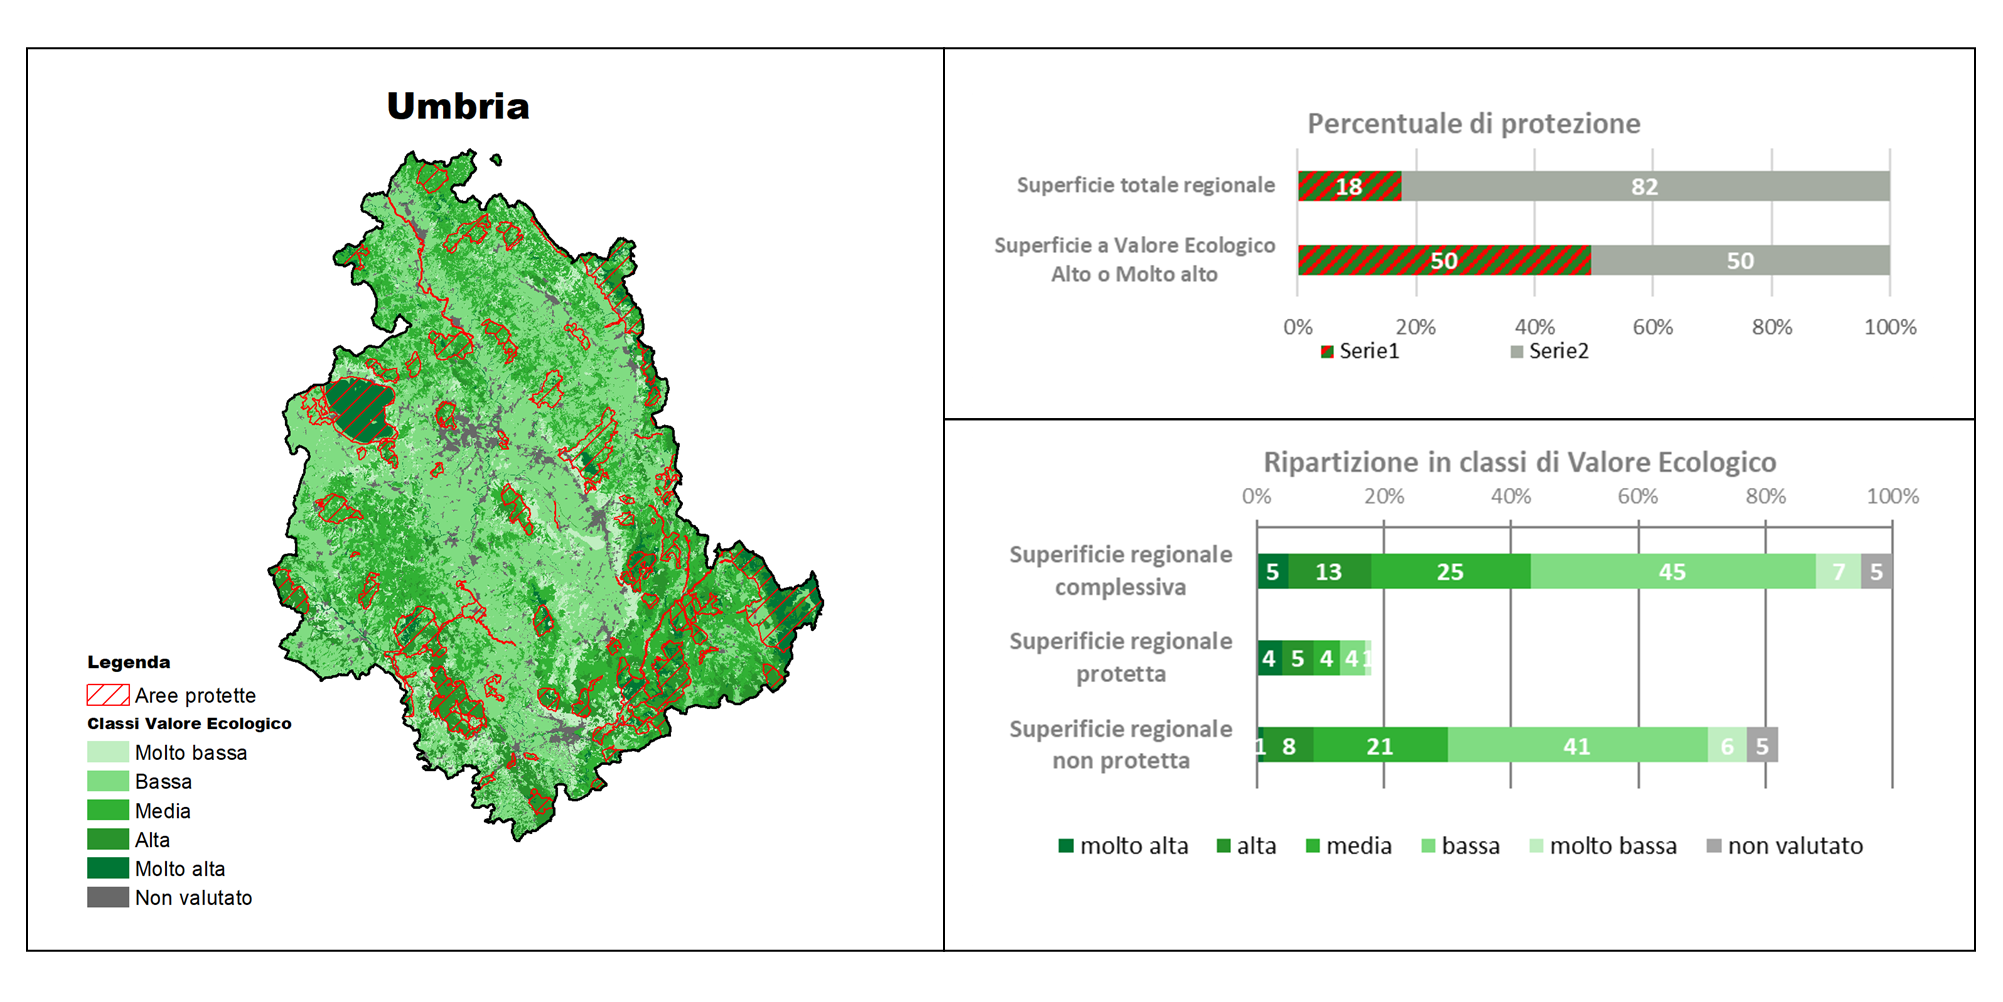
Figure 15: Distribution of Ecological Value in the Umbria Region Fonte
ISPRA, Nature Map Information System, Habitat Map of the Umbria Region (2012) and assessments; ISTAT, administrative boundaries (2011); MASE, Protected Areas boundaries (2017, 2021) |
Thumbnail
Titolo
Figure 16: Distribution of Ecological Value in the Aosta Valley Region Fonte
ISPRA, Nature Map Information System, Habitat Map of the Aosta Valley Region (2008) and assessments; ISTAT, administrative boundaries (2011); MASE, Protected Areas boundaries (2017, 2021) |
Thumbnail
Titolo
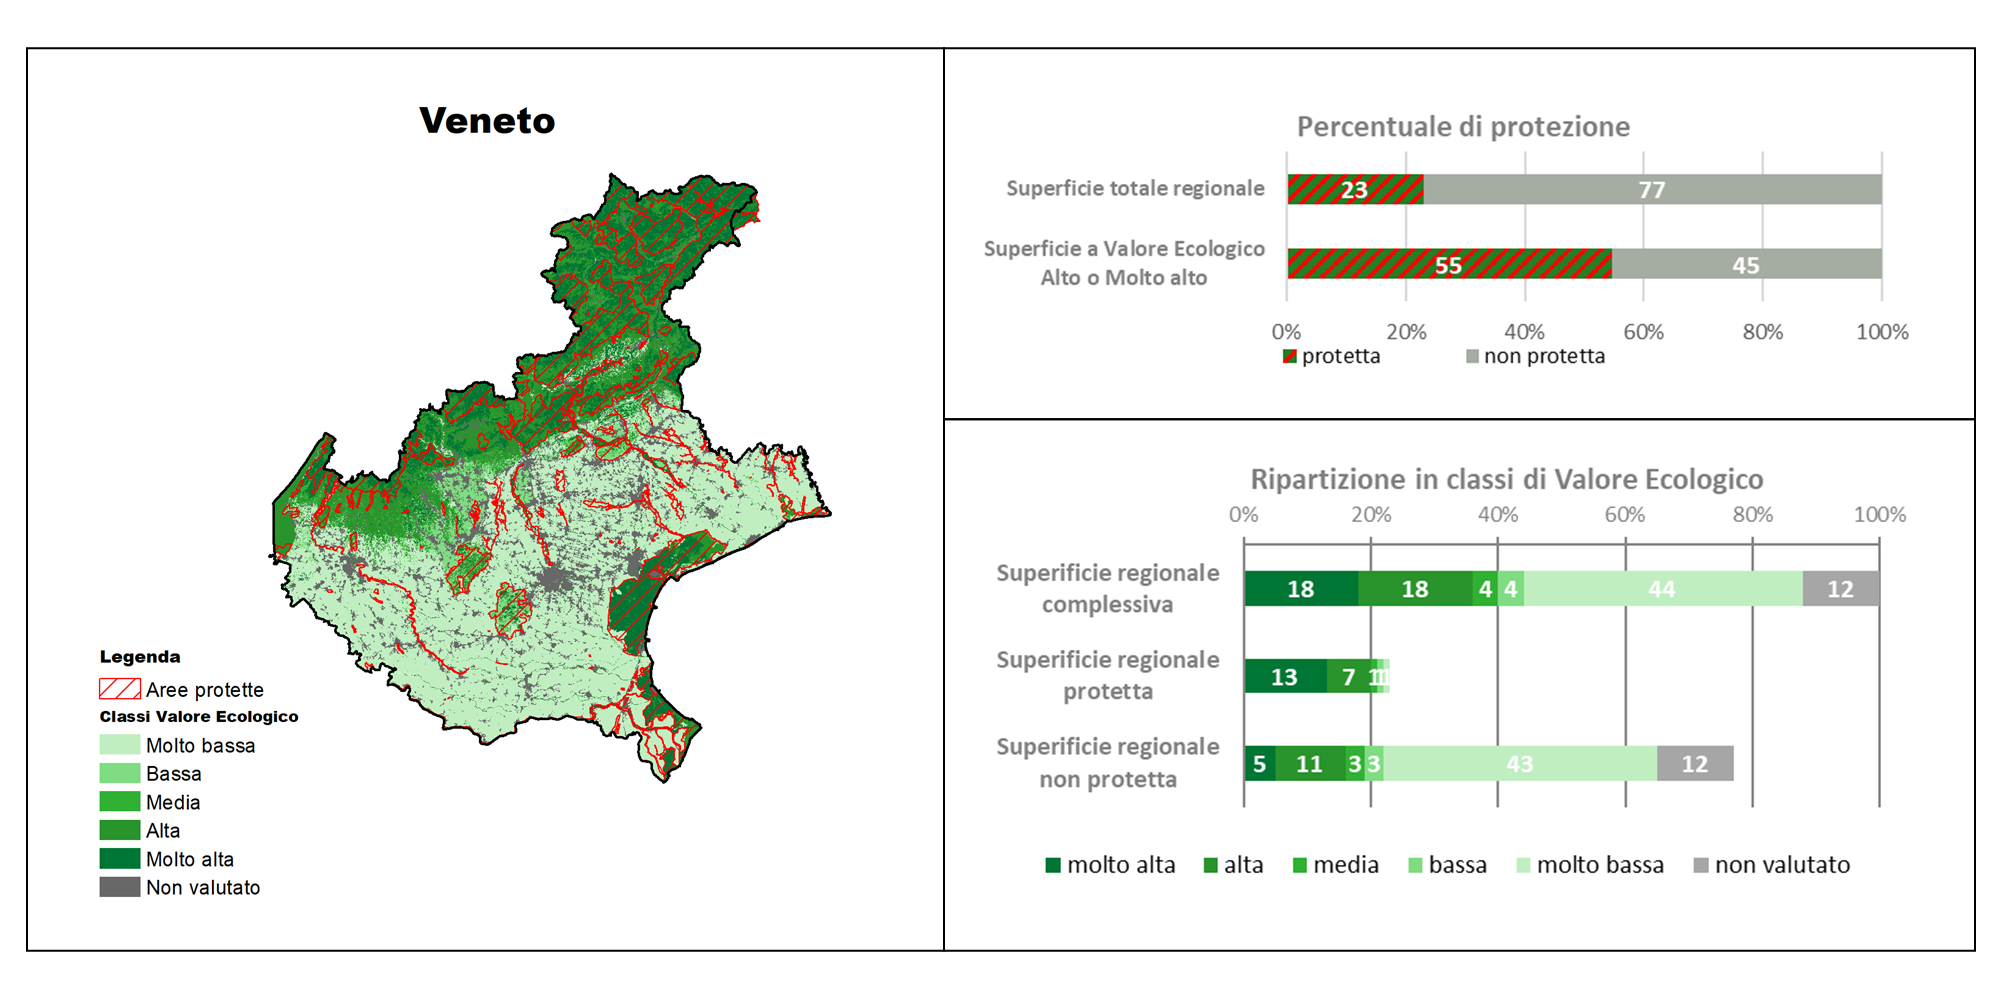
Figure 17: Distribution of Ecological Value in the Veneto Region Fonte
ISPRA, Nature Map Information System, Habitat Map of the Veneto Region (2008) and assessments; ISTAT, administrative boundaries (2011); MASE, Protected Areas boundaries (2017, 2021) |
The regional maps (Figures 1–17) provide a spatial representation that, despite limitations related to graphical resolution, allows insights into each region's environmental mosaic and inter-regional differences. Hilly and mountainous areas generally have higher VE, while plains show lower values. Some regions (Liguria, Sardinia, Valle d’Aosta) exhibit high VE widely distributed; others (Campania, Emilia-Romagna, Friuli-Venezia Giulia, Marche, Puglia, Veneto) show strong contrasts with high VE remnants surrounded by artificial landscapes.
High VE areas are typically natural or semi-natural: forests, shrublands, grasslands, or rocky highlands. Low VE areas are mainly artificial, often agricultural (orchards, croplands, extensive or intensive). Medium VE areas represent transitional environments, including secondary semi-natural habitats serving as ecological corridors or buffer zones crucial for biodiversity conservation.
Built environments excluded from VE calculation include fully artificial urban, residential, industrial, or commercial areas (gray on maps).
Overlaying protected area boundaries shows that protected zones primarily encompass high VE territories but leave varying fractions outside protection—minimal in some regions, extensive in others.
Regarding VE class distribution (Figures 1–17), there is regional heterogeneity: in 3 regions (Friuli-Venezia Giulia, Liguria, Valle d’Aosta), high/very high VE covers over 50% of total territory; conversely, in regions like Campania, Emilia-Romagna, Marche, Puglia, or Veneto, low/very low VE plus non-evaluated areas reach or exceed 60%. Medium VE areas are significant in some regions, like Sardinia (up to 32% of surface).
Analysis inside vs. outside protected areas highlights variability among regions. Protected zones generally show higher shares of high/very high VE and minimal cemented "non-evaluated" areas.
High/very high VE areas range from 7% of total regional territory in Emilia-Romagna (2% very high, 5% high) to 25% in Valle d’Aosta (9% very high, 16% high). Within protected areas, these represent from 55% (Emilia-Romagna) to 84% (Valle d’Aosta), averaging 65% across the 17 regions. Cemented "non-evaluated" zones average under 1.5% inside protected areas.
Outside protected areas, low/very low VE prevails, but high/very high VE share varies: regions like Calabria, Friuli-Venezia Giulia, Liguria, Tuscany, and Valle d’Aosta show significant high VE outside protection (>30%), while others (Campania, Emilia-Romagna, Marche, Puglia, Umbria) fall below 15%.
In some regions, high VE environments extend beyond protected areas, while in others, intense artificialization has reduced natural habitats, increasing conservation relevance of remaining high-value patches embedded in anthropized landscapes.
For each region, the number of fully high/very high VE habitats and their protection status are listed (Table 1). These include both widespread landscape-defining habitats and localized, rare, fragmented, and often threatened ones (e.g., riparian, coastal habitats).
The indicator confirms a strong link between protected areas and high-value territories but also reveals high-value zones still lacking protection. This analysis supports land-use planning, identification of new protection areas, adjustment of existing boundaries, and ecological restoration or connectivity improvement actions.