Marina Colaiezzi
The indicator measures passenger transport demand (according to different modes) and compares its trend with that of economic growth and population. Transport demand is increasingly met by individual road transport (passenger cars and motorcycles), which, due to its growth and modal share (approximately 79% in 2024), remains dominant compared to other transport modes.
The indicator measures passenger transport demand, broken down by mode of transport, and its relative intensity with respect to population and Gross Domestic Product (GDP).
To assess passenger transport demand and relate its evolution to national economic growth and population trends; to compare the different modes of transport and their internal development dynamics, with the aim of achieving a more efficient modal split.
The need to make the transport system sustainable has been repeatedly emphasized at the EU level, particularly in the context of combating climate change (European Parliament, 2008; European Council, 2008). Key objectives for sustainable mobility include decoupling transport growth from economic growth and modal rebalancing.
In May 2018, with the third package of measures of the “Europe on the Move” initiative—aimed at clean, competitive, and connected mobility—the European Commission completed the process started with the “European Strategy for Low Emission Mobility” of 2016 and the previous packages of May and November 2017.
The acceleration of the transition towards sustainable and smart mobility, in view of achieving climate neutrality by 2050, is among the ambitious objectives set out in the 2019 European Green Deal, which includes a 90% reduction in greenhouse gas emissions from transport by 2050 compared to 1990 levels, and in the 2020 Strategy for Sustainable and Smart Mobility.
On 29 July 2021, the European Climate Law (Regulation (EU) No. 1119 of 30 June 2021) entered into force, transforming the political commitment of the European Green Deal for EU climate neutrality by 2050 into a legally binding obligation and increasing the EU’s 2030 emissions reduction target from 40% to 55% compared to 1990 levels.
Moreover, the so-called “Fit for 55” package is currently under discussion, i.e., the set of legislative proposals necessary to achieve the -55% net target by 2030, intended to support the ecological transition process envisaged by the Green Deal and to define the appropriate trajectory for achieving climate neutrality by 2050.
In Italy, the General Mobility Plan Guidelines (MIT, 2007) identified modal integration as an essential condition for making the national transport system efficient.
The Decree of the Ministry of Infrastructure and Transport of 4 August 2017 defined the guidelines for drafting Sustainable Urban Mobility Plans (PUMS), and with Director's Decree No. 417 of 21 December 2018 of the Directorate General for Climate and Energy, the Incentive Programme for Sustainable Urban Mobility (PrIMUS) was approved, aimed at financing sustainable mobility projects in municipalities with a population of not less than 50,000 inhabitants.
In terms of soft mobility, since 15 February 2018, the law for the development of cycling mobility has also been in force, providing for the creation of the national cycling network (Bicitalia).
Also within the framework of national legislation, the National Strategic Plan for Sustainable Mobility is noteworthy, aimed at providing medium-term guidelines to regions and local authorities, in support of sectoral planning activities, and to public transport companies and the related industrial sector, in support of strategic choices concerning the various technological options.
The Plan was implemented with Interministerial Decree (MIT – MISE – MEF) No. 81 of 14 February 2020.
Finally, in February 2023, the decree-law for the implementation of the National Recovery and Resilience Plan (PNRR) was issued, allocating a significant share of resources to the green revolution, ecological transition, and infrastructure for sustainable mobility[1]; and in June 2024, Italy submitted the update of the National Integrated Energy and Climate Plan (PNIEC) as provided for by Article 14 of Regulation (EU) 2018/1999 of the European Parliament and of the Council.
[1] https://www.gazzettaufficiale.it/eli/id/2023/02/24/23G00022/sg
National Account of Infrastructure and Sustainable Mobility 2023–2024
The calculation of the indicator requires the use of algorithms, and only part of the necessary data is currently available at the regional level. From 1991 to 1994, data on passengers per kilometer are not available for some transport modes.
A national and local-level estimate of vehicle mileage would be required.
-
EUROSTAT (Statistical Office of the European Communities)
-
ISPRA
-
ISTAT
-
MIT (Ministry of Infrastructure and Transport)
-
AMECO (annual macro-economic database of DG ECFIN, the European Commission's Directorate General for Economic and Financial Affairs)
-
ACI (Automobile Club of Italy)
-
MIT Data for Total Domestic Passenger Traffic (National Account of Infrastructure and Sustainable Mobility 2022-2023);
-
ISTAT Data for Population (http://demo.istat.it/);
-
Eurostat Database (https://ec.europa.eu/eurostat/data/database) and AMECO (https://ec.europa.eu/info/business-economy-euro/indicators-statistics/economic-databases/macro-economic-database-ameco/ameco-database_en) for GDP data
-
ISPRA Atmospheric Emissions Inventory for vkm data (https://emissioni.sina.isprambiente.it/serie-storiche-emissioni/).
National
1990-2024
The data are obtained through simple mathematical computations. Estimates of the total vehicle mileage are derived from modeling processes provided by the ISPRA National Atmospheric Emissions Inventory section (European model Copert). The estimates consider total fuel consumption, the vehicle fleet, mileage estimates on highways, and periodic studies by trade associations or local authorities. Intensity estimates are derived from mileage estimates, Istat population estimates, and data extracted from the European Commission databases, Eurostat, and AMECO.
-
Passenger-km: unit of measure for transport demand. The quantity is calculated as the sum of the products of the number of passengers transported and their respective distances traveled. Only the distance within the national territory of the reporting country should be considered.
-
Intensity relative to population and GDP, for both pkm and vkm.
In 2024, domestic passenger transport is estimated at approximately 898 billion passenger-kilometres, representing a 1% increase compared to 2023 and returning to levels broadly consistent with the pre-pandemic period. Mobility demand is predominantly met by individual road transport (passenger cars and motorcycles), which, with a modal share of about 79%, continues to represent the dominant mode compared with available alternatives (Table 1, Table 2).
Road transport exerts significant pressure on the infrastructure network and on society as a whole, generating congestion, delays, and numerous negative externalities. Moreover, the increase in its modal share has partially offset the progress achieved in recent years in terms of environmental impact reduction and transport safety improvements, which had been attained through technological innovation and infrastructure investments.
Overall, approximately 90% of passenger transport takes place on the road network, while the remaining share is accounted for by rail transport and air transport, with modal shares of 7.0% and 2.6%, respectively (Table 2).
Over the period 2015–2019, the percentage distribution of passenger transport demand by mode remained largely stable. In 2020, as a result of the pandemic, a sharp increase in the share of individual transport was observed, reaching 84%, the highest value recorded since 1990 (Table 1, Table 2).
In 2024, the modal share of private mobility stands at around 79%, returning to levels consistent with the pre-pandemic period and showing a slight decline compared to 2023 (–1 percentage point) (Table 1).
However, this trend is not consistent with the objectives of development and promotion of intermodal modal shift outlined in the most recent national planning instruments, which envisage a progressive increase in the share of mobility demand satisfied by public and shared transport.
| Allegati |
|---|
Titolo
Table 1: Inland Passenger Traffic in Italy, by Mode of Transport Fonte
National Infrastructure and Transport Report – Years 2022-2023’ (CNIT 2022-2023) and ISPRA processing on ISTAT, EUROSTAT, and AMECO data Legenda
(1) The passenger movements considered are those carried out by national carriers with both origin and destination within Italian territory. For rail traffic, the share of international traffic carried out on national territory is also included.
Note
Estimated data are in italics. Sums may not match totals due to rounding. |
Titolo
Table 2: Percentage of Inland Passenger Traffic in Italy, by Mode of Transport Fonte
ISPRA processing on data from the National Infrastructure and Transport Report – Years 2022-2023’ (CNIT 2022-2023) |
Titolo
Table 3: Intensity of passenger vehicle travel (total and passenger cars only) relative to income and population Fonte
ISPRA processing based on data from ACI, ISTAT, EUROSTAT, and MIT Note
The historical series of travel distances has been recalculated in accordance with the update of the ISPRA National Emission Inventory. |
Thumbnail
Titolo
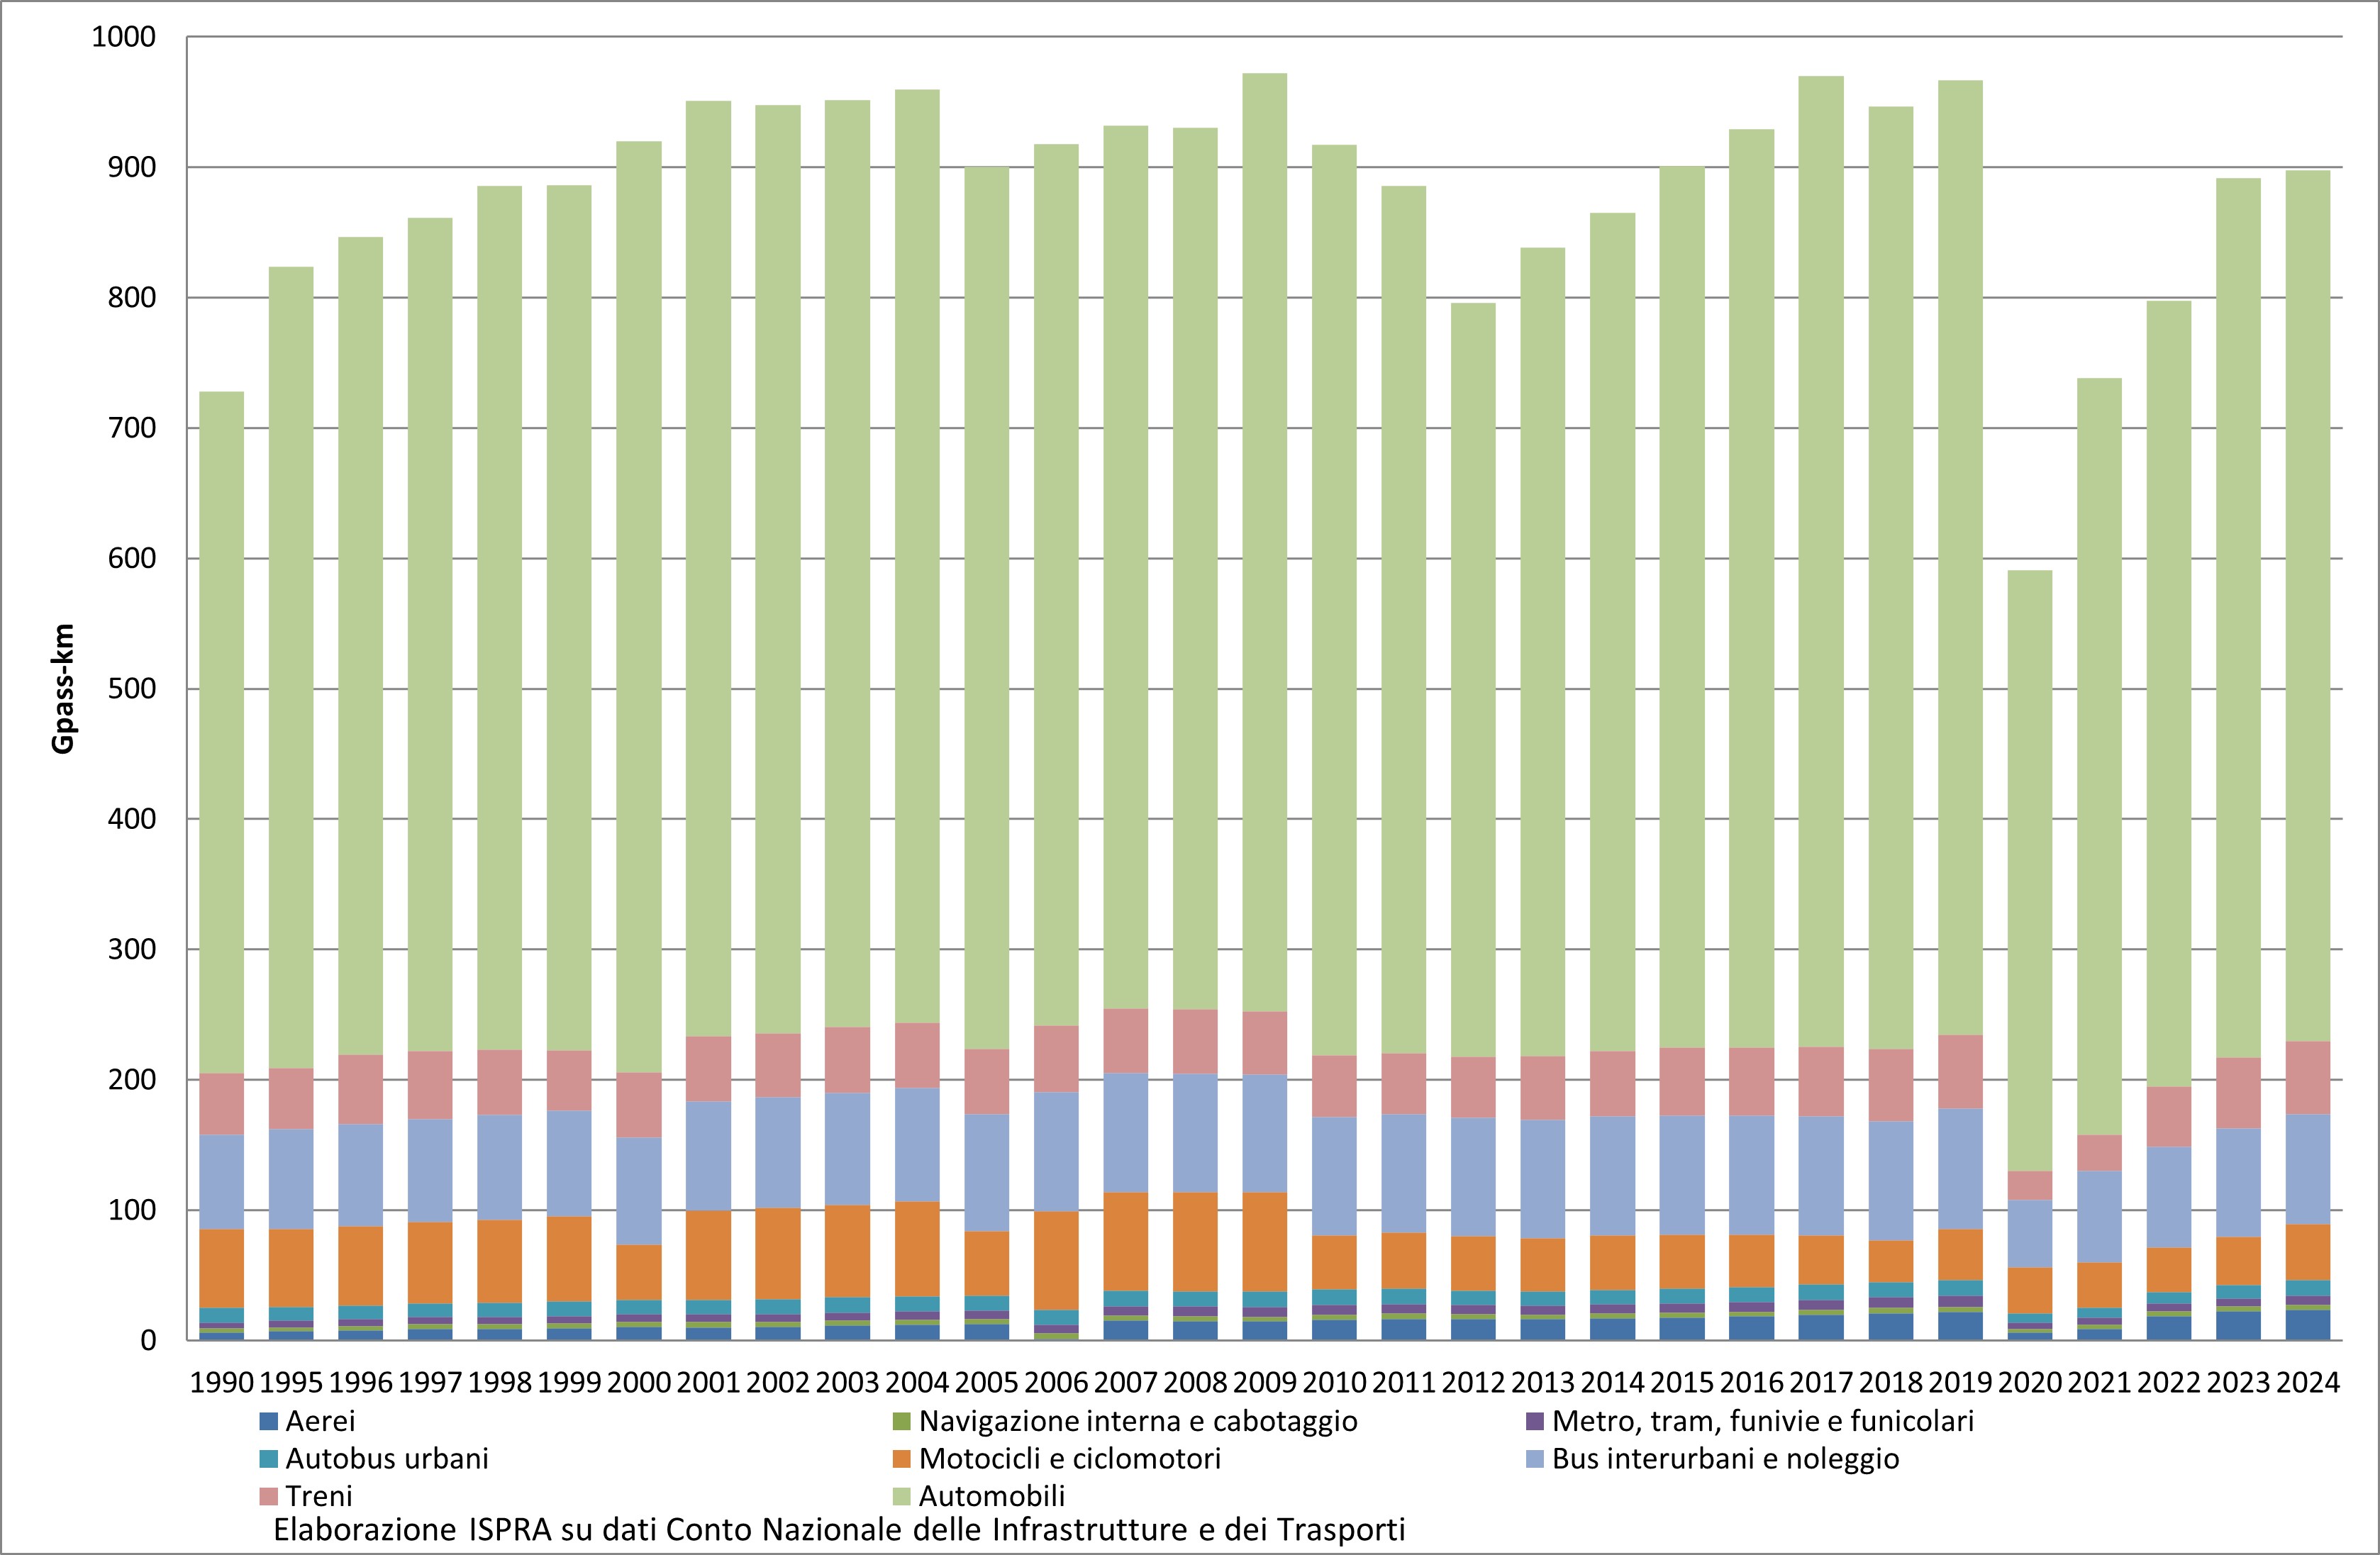
Figure 1: Evolution of total inland passenger traffic, by transport mode Fonte
Source: National Infrastructure and Transport Report – Years 2022-2023’ (CNIT 2022-2023) and ISPRA processing based on data from ISTAT, EUROSTAT, and AMECO Legenda
(1) The movements of passengers made by national carriers with origin and destination within Italy are considered. For rail traffic, the share of international traffic carried out within the national territory is also included. |
Thumbnail
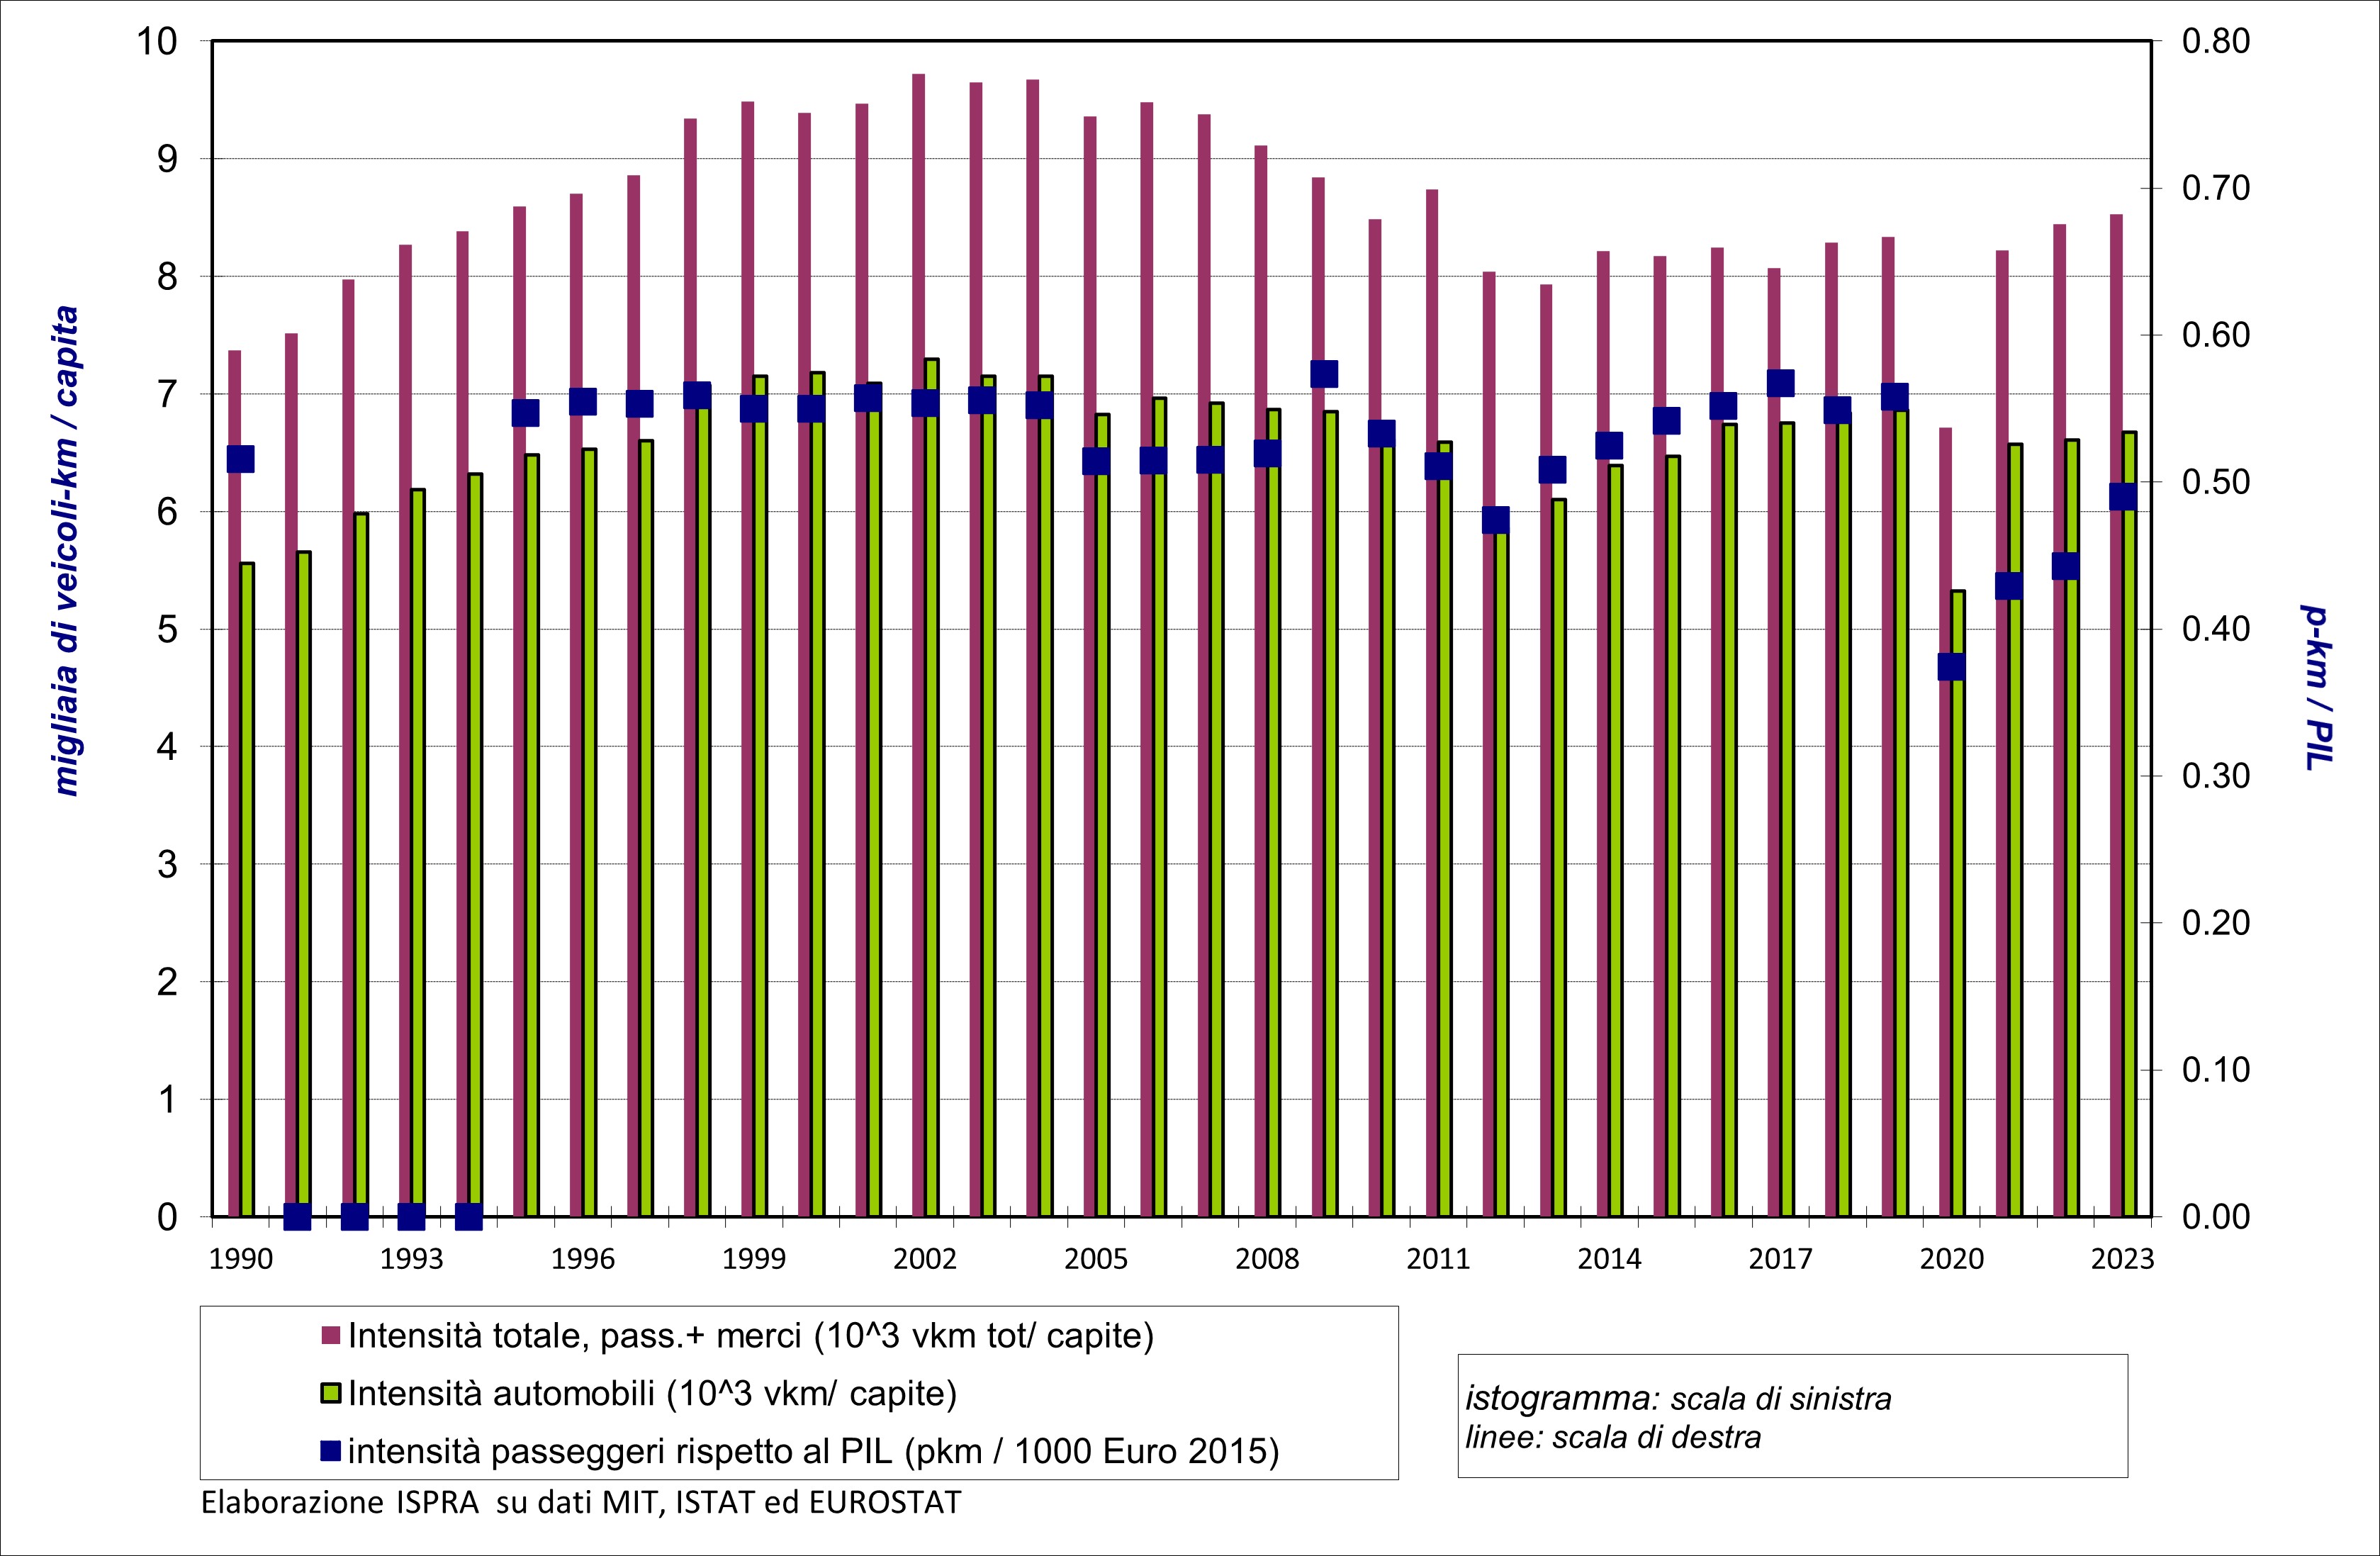
Titolo
Figure 2: Evolution of passenger transport intensity Fonte
ISPRA processing based on data from ACI, ISTAT, EUROSTAT, and MIT |
Over the last thirty years, a significant growth in passenger transport demand has been observed, interrupted only temporarily by the economic crisis during the 2008–2012 period. In 2019, total domestic passenger traffic was approximately 33% higher than in 1990 (Table 1).
In 2020, following the restrictive measures introduced at national and international levels to contain the COVID-19 pandemic, transport demand reached the lowest value of the entire historical series, falling 19% below 1990 levels and 39% below 2019 levels. Air transport was among the sectors most severely affected by the crisis triggered by the health emergency, together with rail transport, recording reductions of 73% and 61%, respectively, compared to the previous year.
Road transport demand has been, and continues to be, met predominantly by individual transport modes (passenger cars and motorcycles), to the detriment of public transport.
The evolution of passenger transport intensity, measured as passenger-kilometres per capita (Table 1), reflects the overall trend in passenger-kilometres, with a peak recorded around 2009. This peak was followed by marked declines during 2010–2012, followed by a growth phase between 2013 and 2016. In 2019, transport intensity again reached levels comparable to those observed in 2009.
In 2024, after the sharp contraction observed during the pandemic years, the indicator returned to 2016 levels, without however recovering the values recorded in 2019.
The trend in passenger transport intensity per unit of income is also uneven and is influenced both by changes in income measurement (expressed in 2015 constant euros) and by estimates of the average vehicle occupancy factor. The highest values of the indicator are observed in 2009 and 2017, while the minimum occurs in 2020, coinciding with a 9% contraction in GDP compared to the previous year (Table 1, Figure 2).
In 2024, the indicator shows substantial stability compared to 2023, in a context of GDP growth estimated at around 1% (Table 1, Figure 2).
Transport intensity, measured as total passenger vehicle-kilometres per capita (Table 3), shows a continuous increase from 1990 to 2002, anticipating the subsequent decline associated with the economic crisis compared to the indicator expressed in passenger-kilometres per capita. Subsequently, the indicator resumed growth up to 2019, without reaching the levels recorded in the early 2000s. After the sharp reduction observed in 2020, in 2023 transport intensity increased again to values comparable to those of 2016, but remained below 2019 levels.
When considering transport intensity measured as total passenger vehicle-kilometres per unit of income, two pronounced declines emerge over the 1995–2012 period, associated with the economic crises of 2005–2007 and 2010–2012. From 2013 onwards, a recovery in overall passenger movements is observed, continuing until 2019. In 2023, a partial recovery relative to the contraction observed in 2020 is recorded, although pre-pandemic levels have not yet been restored.