Marina Colaiezzi
The indicator evaluates the demand for freight transport (also in relation to economic growth) and the evolution over time of modal split. The transport demand is increasingly met by road freight transport, which continues to dominate other transport modes in terms of growth and modal share (approximately 59% in 2024).
The indicator measures freight transport demand, broken down by different transport modes and their respective intensities.
To assess freight transport demand and compare its trend with economic growth, as well as to evaluate the evolution of modal split over time, aiming for a more balanced distribution.
The need for a sustainable transport system has been repeatedly emphasized at the EU level, particularly in the fight against climate change (European Parliament, 2008; European Council, 2008). Key objectives for sustainable mobility include decoupling transport growth from economic growth and rebalancing modal shares. In May 2018, with the third set of measures under "Europe on the Move," an initiative for clean, competitive, and interconnected mobility, the European Commission completed the process initiated with the 2016 "European Strategy for Low-Emission Mobility" and the previous packages of May and November 2017. In Italy, the Guidelines of the General Mobility Plan (MT, 2007) identified modal integration as essential for an efficient transport system.
In December 2019, the "National Integrated Energy and Climate Plan" was submitted to the European Commission, followed in January 2021 by the draft "Italian Long-Term Strategy for Greenhouse Gas Emission Reduction," which outlines measures to shift freight transport from road to rail and from road to sea. Additionally, concerning intermodal exchange, regulatory instruments such as Marebonus and Ferrobonus are key measures for energy efficiency in transport, as modal shift represents a highly cost-effective intervention. Specifically, Marebonus provides incentives to road freight companies for adopting combined road-sea transport, while Ferrobonus offers incentives for combined road-rail transport.
At the end of 2019, the European Commission adopted the European Green Deal, COM(2019) 640 final, a program to achieve net-zero greenhouse gas emissions by 2050. To contribute to carbon neutrality, the Green Deal proposes shifting 75% of inland freight transport from road to rail and inland waterways. These goals were reinforced by Italy’s National Recovery and Resilience Plan (PNRR, January 2021), which highlights that the lack of efficient infrastructure also affects freight transport: without effective rail connections, road transport remains the primary option. In February 2023, the legislative decree for PNRR implementation was issued, and in June 2024, Italy communicated the update of its National Energy and Climate Plan (PNIEC) as required by Article 14 of Regulation (EU) 2018/1999.
To increase rail freight volumes, it is necessary to expand network and node capacity while improving connections between rail networks, ports, and airports. In this context, the EU’s "Strategy for Sustainable and Smart Mobility" sets the goal of increasing rail freight traffic by 50% by 2030 and doubling it by 2050.
[1] https://www.gazzettaufficiale.it/eli/id/2023/02/24/23G00022/sg.
National Infrastructure and Transport Report – Years 2023-2024’ (CNIT 2023-2024)*- MIT – Ministry of Infrastructure and Transport (Italy) (https://www.mit.gov.it/nfsmitgov/files/media/pubblicazioni/2025-12/CNIT%202023-2024_segnalibri_ver3_perStampa.pdf)
*CNIT (Conto Nazionale Infrastrutture e Trasporti): Italy’s official transport accounting system.
Lack of data comparability across transport modes
-
-
EUROSTAT (Statistical Office of the European Communities)
-
ISPRA
-
ISTAT
-
MIT (Ministry of Infrastructure and Transport – Italy)
The information on total freight traffic is compiled by ISPRA using data series derived from surveys conducted by:
Istat (http://demo.istat.it/),
Eurostat (https://ec.europa.eu/eurostat/data/database),
National Infrastructure and Transport Report – Years 2023-2024 (CNIT 2023-2024)* (https://www.mit.gov.it/comunicazione/pubblicazioni),
and the AMECO macro-economic database (https://ec.europa.eu/info/business-economy-euro/indicators-statistics/economic-databases/macro-economic-database-ameco_en).
*CNIT (Conto Nazionale Infrastrutture e Trasporti): Italy’s official transport accounting system.
Nazionale
1990-2024
The indicators are derived through simple mathematical processing based on tonne-kilometre data from the 2023–2024 National Transport and Infrastructure Report (CNIT 2023-2024) and on estimates of total vehicle mileage, provided by the national atmospheric emissions inventory section of ISPRA. These estimates are produced using the European COPERT model. The methodology takes into account overall fuel consumption, actual traffic data from the toll motorway network, and periodic studies conducted by trade associations. Circulation data are further processed by incorporating Istat population estimates and European Commission estimates (sources: Eurostat and AMECO) for Gross Domestic Product (GDP).
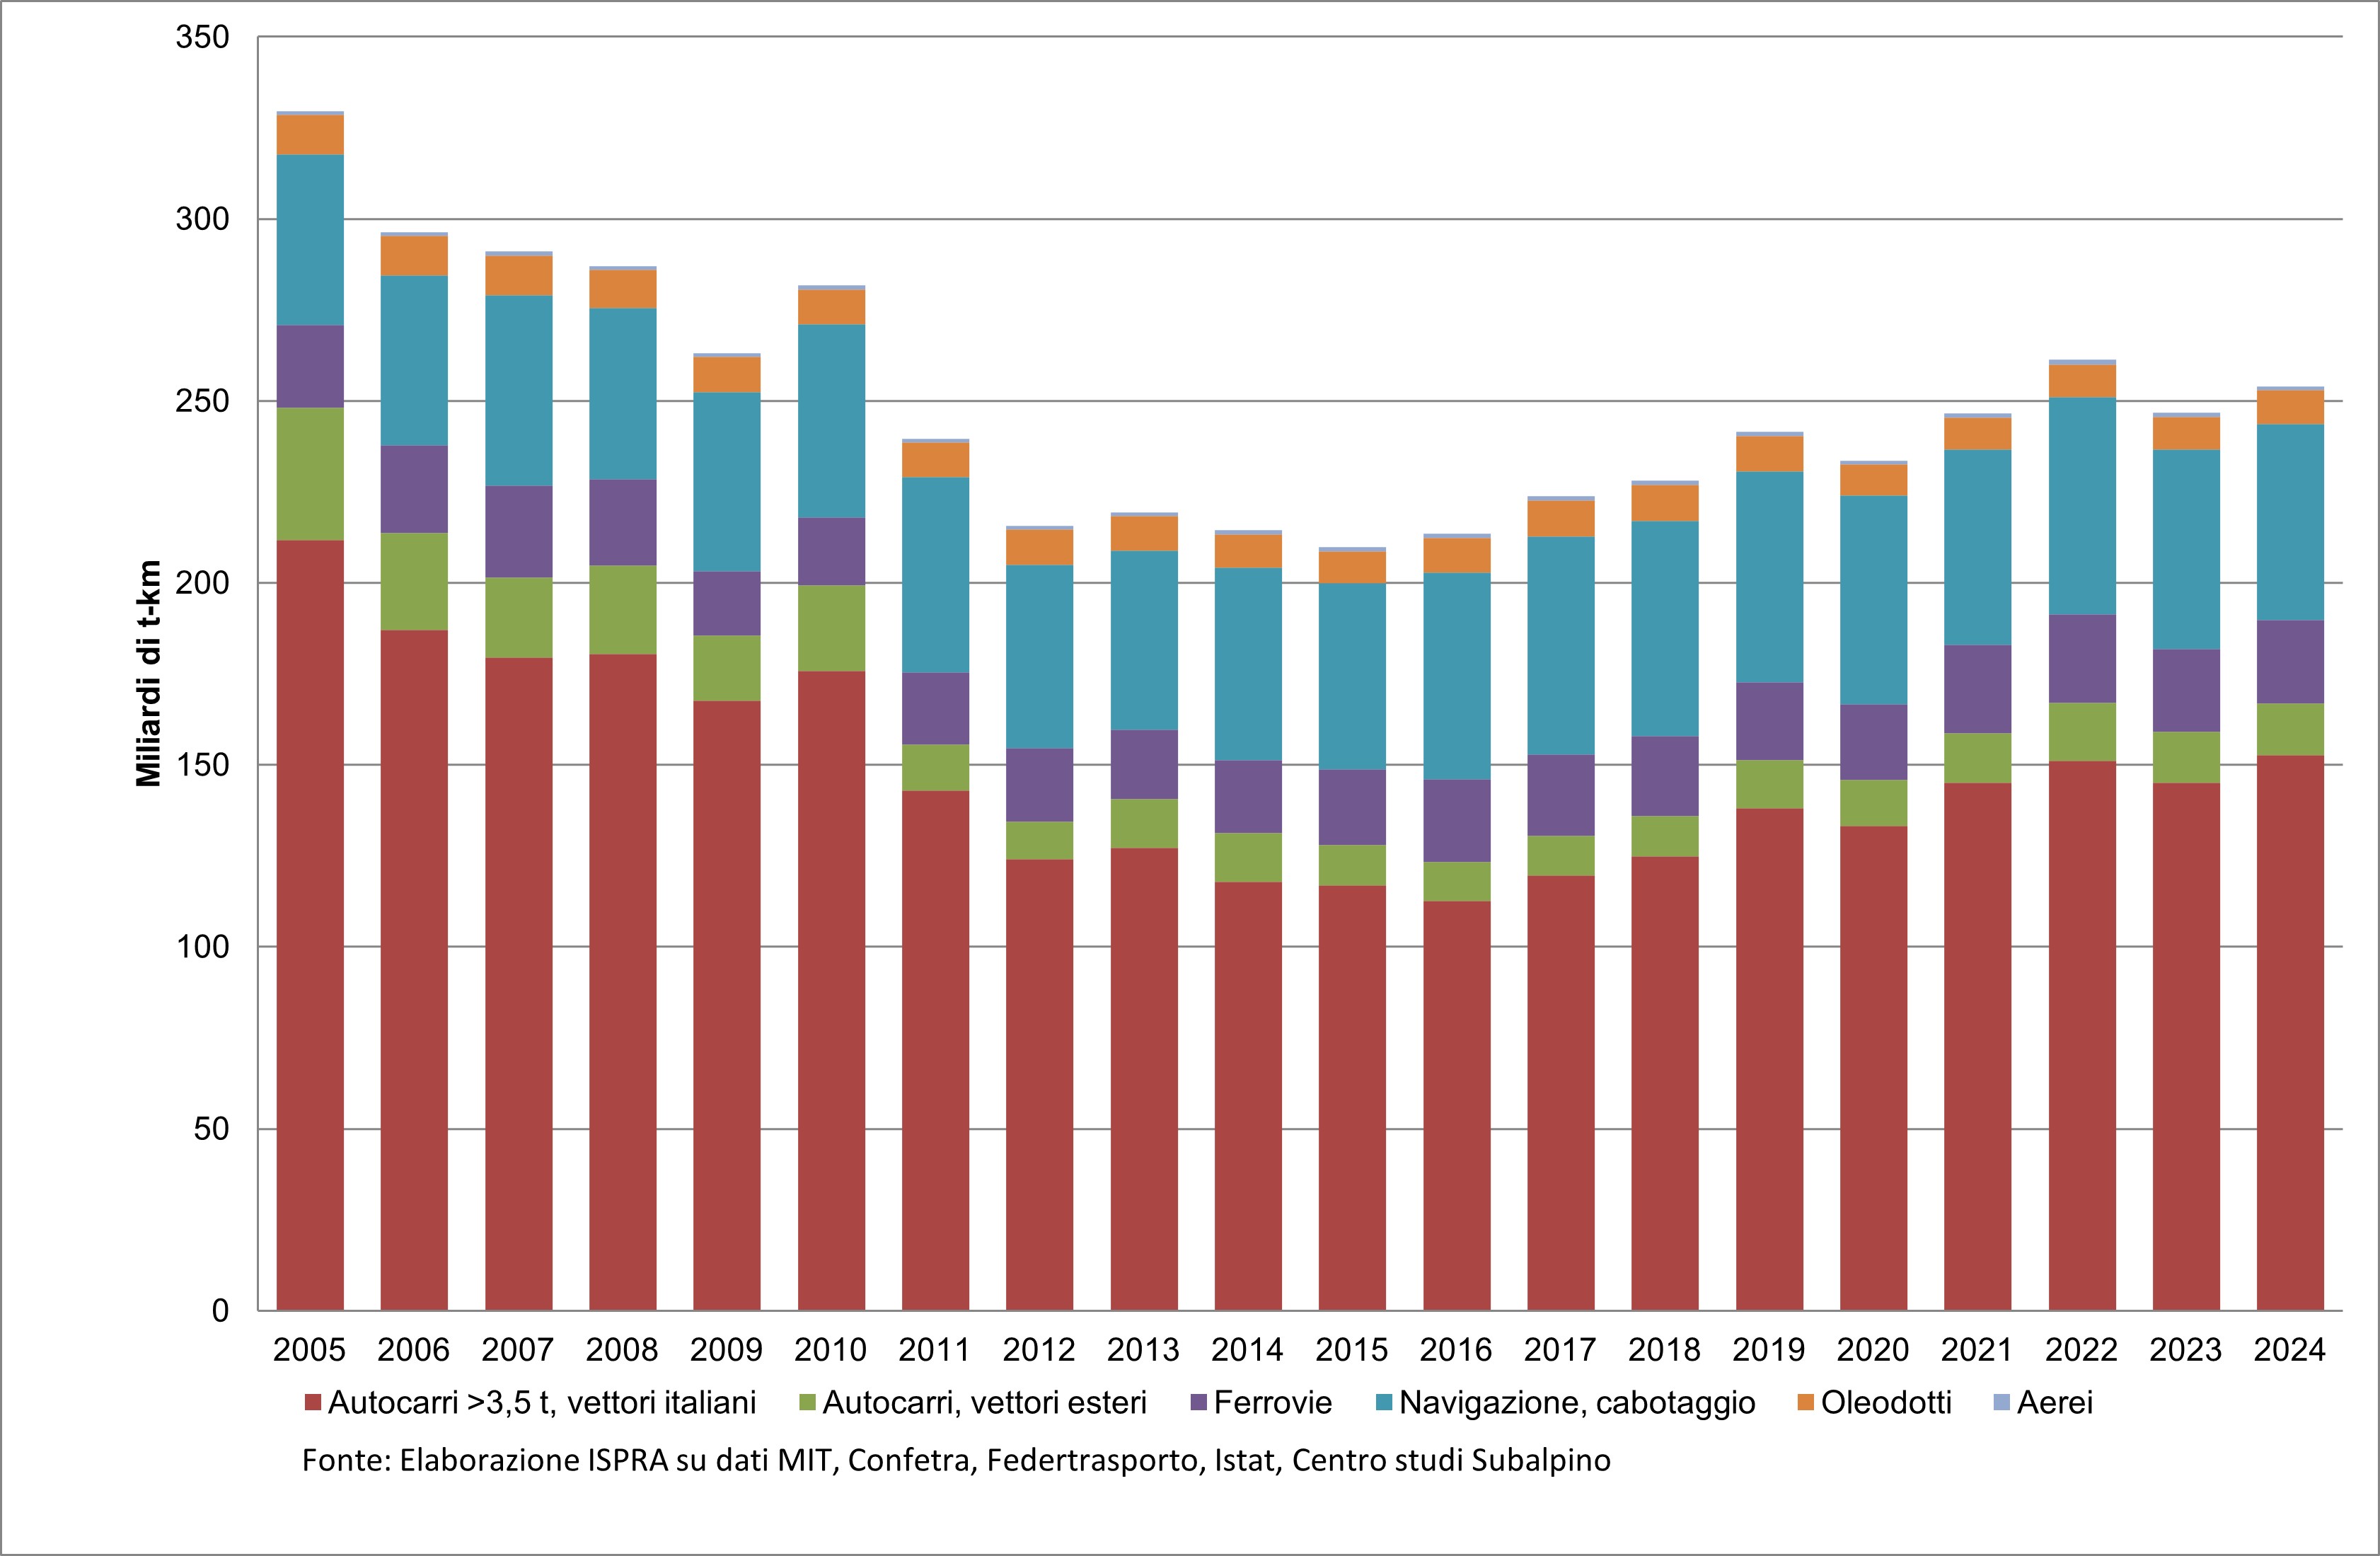
Estimates of domestic freight traffic for 2024 amount to approximately 211 billion tonne-kilometres, marking an increase of around 1.6% compared to 2023. The data series confirms the overwhelming dominance of road transport, which in 2023 accounted for 62.4% of total freight tonne-kilometres (Table 1). Road transport exerts significant pressure on road infrastructure and society as a whole, generating congestion, delays, and other negative externalities. Furthermore, the expansion of its modal share has offset progress made in reducing environmental impacts and improving transport safety—achievements largely due to technological advancements and infrastructure interventions.
For the other modes of transport, in 2024 the following changes compared with the previous year are observed: a decrease of 1.7% for inland and maritime waterways; an increase of 1.1% for rail transport, which, with 22,933 million tonne-kilometres, accounts for 10.9% of total freight traffic; and an increase of 0.5% for air transport, which nevertheless represents a marginal share, as it is mainly devoted to international traffic (Table 1 and Table 2).
The rail share of total freight transport is below the EU average. In 2024, it stood at 10.9% in Italy, compared to 18% at the European level. Moreover, Italy has the lowest railway network density relative to population among major European countries. Therefore, increasing rail usage—for both private and commercial purposes—and enhancing the integration among various transport modes may contribute to decarbonisation efforts and to improving the competitiveness of Southern Italy.
From 1990 to 2005, the modal split of freight transport remained relatively stable (Table 2). Specifically, between 2005 and 2016, road freight transport experienced a decrease of approximately 15 percentage points, followed by an upward trend through to 2024. In contrast, maritime transport saw a steady increase in its share starting in 2002, peaking around 2018, with a slight downward trend in the last years. The share of rail freight has remained fairly constant over the historical series, averaging around 11%, with a slightly more pronounced decline observed between 2009 and 2011.
This evolution cannot be considered satisfactory, as it does not align with the development goals and intermodal shift strategies outlined in recent national planning instruments, which advocate for further modal shift interventions—from road to rail and from road to sea. The current modal distribution still requires greater balance between rail and maritime transport, along with a reduction in the share of road freight.
| Allegati |
|---|
File
Titolo
Table 1: Total inland freight traffic in Italy, by mode of transport Fonte
Data from CNIT and ISPRA elaboration based on information from MIT, Confetra, Federtrasporto, Istat, EUROSTAT, and Centro Studi Subalpino. Note
Italicized values indicate estimated data - Sums may not match totals due to rounding.
|
Titolo
Table 2: Percentage Share of Total Domestic Freight Traffic in Italy, by Mode of Transport Fonte
ISPRA elaboration based on data from the National Account of Infrastructure and Transport (CNIT) 2023–2024
|
Titolo
Table 3: Transport intensity – Total and Freight-Specific – Relative to Income and Population Fonte
ISPRA elaboration using data from:
Note
(1) Analysis restricted to vehicular transport with minimum payload capacity ≥3.5 metric tons. The freight transport operational definition encompasses: (i)trucks, (ii) vans, and (iii) foreign-registered vehicles (considering only the route segments traversing Italian territory). ISTAT has revised road freight transport data on several occasions; as a result, the historical series is not fully representative. The historical mileage series has been recalculated in accordance with updates to the ISPRA National Atmospheric Emissions Inventory. |
Thumbnail
Titolo
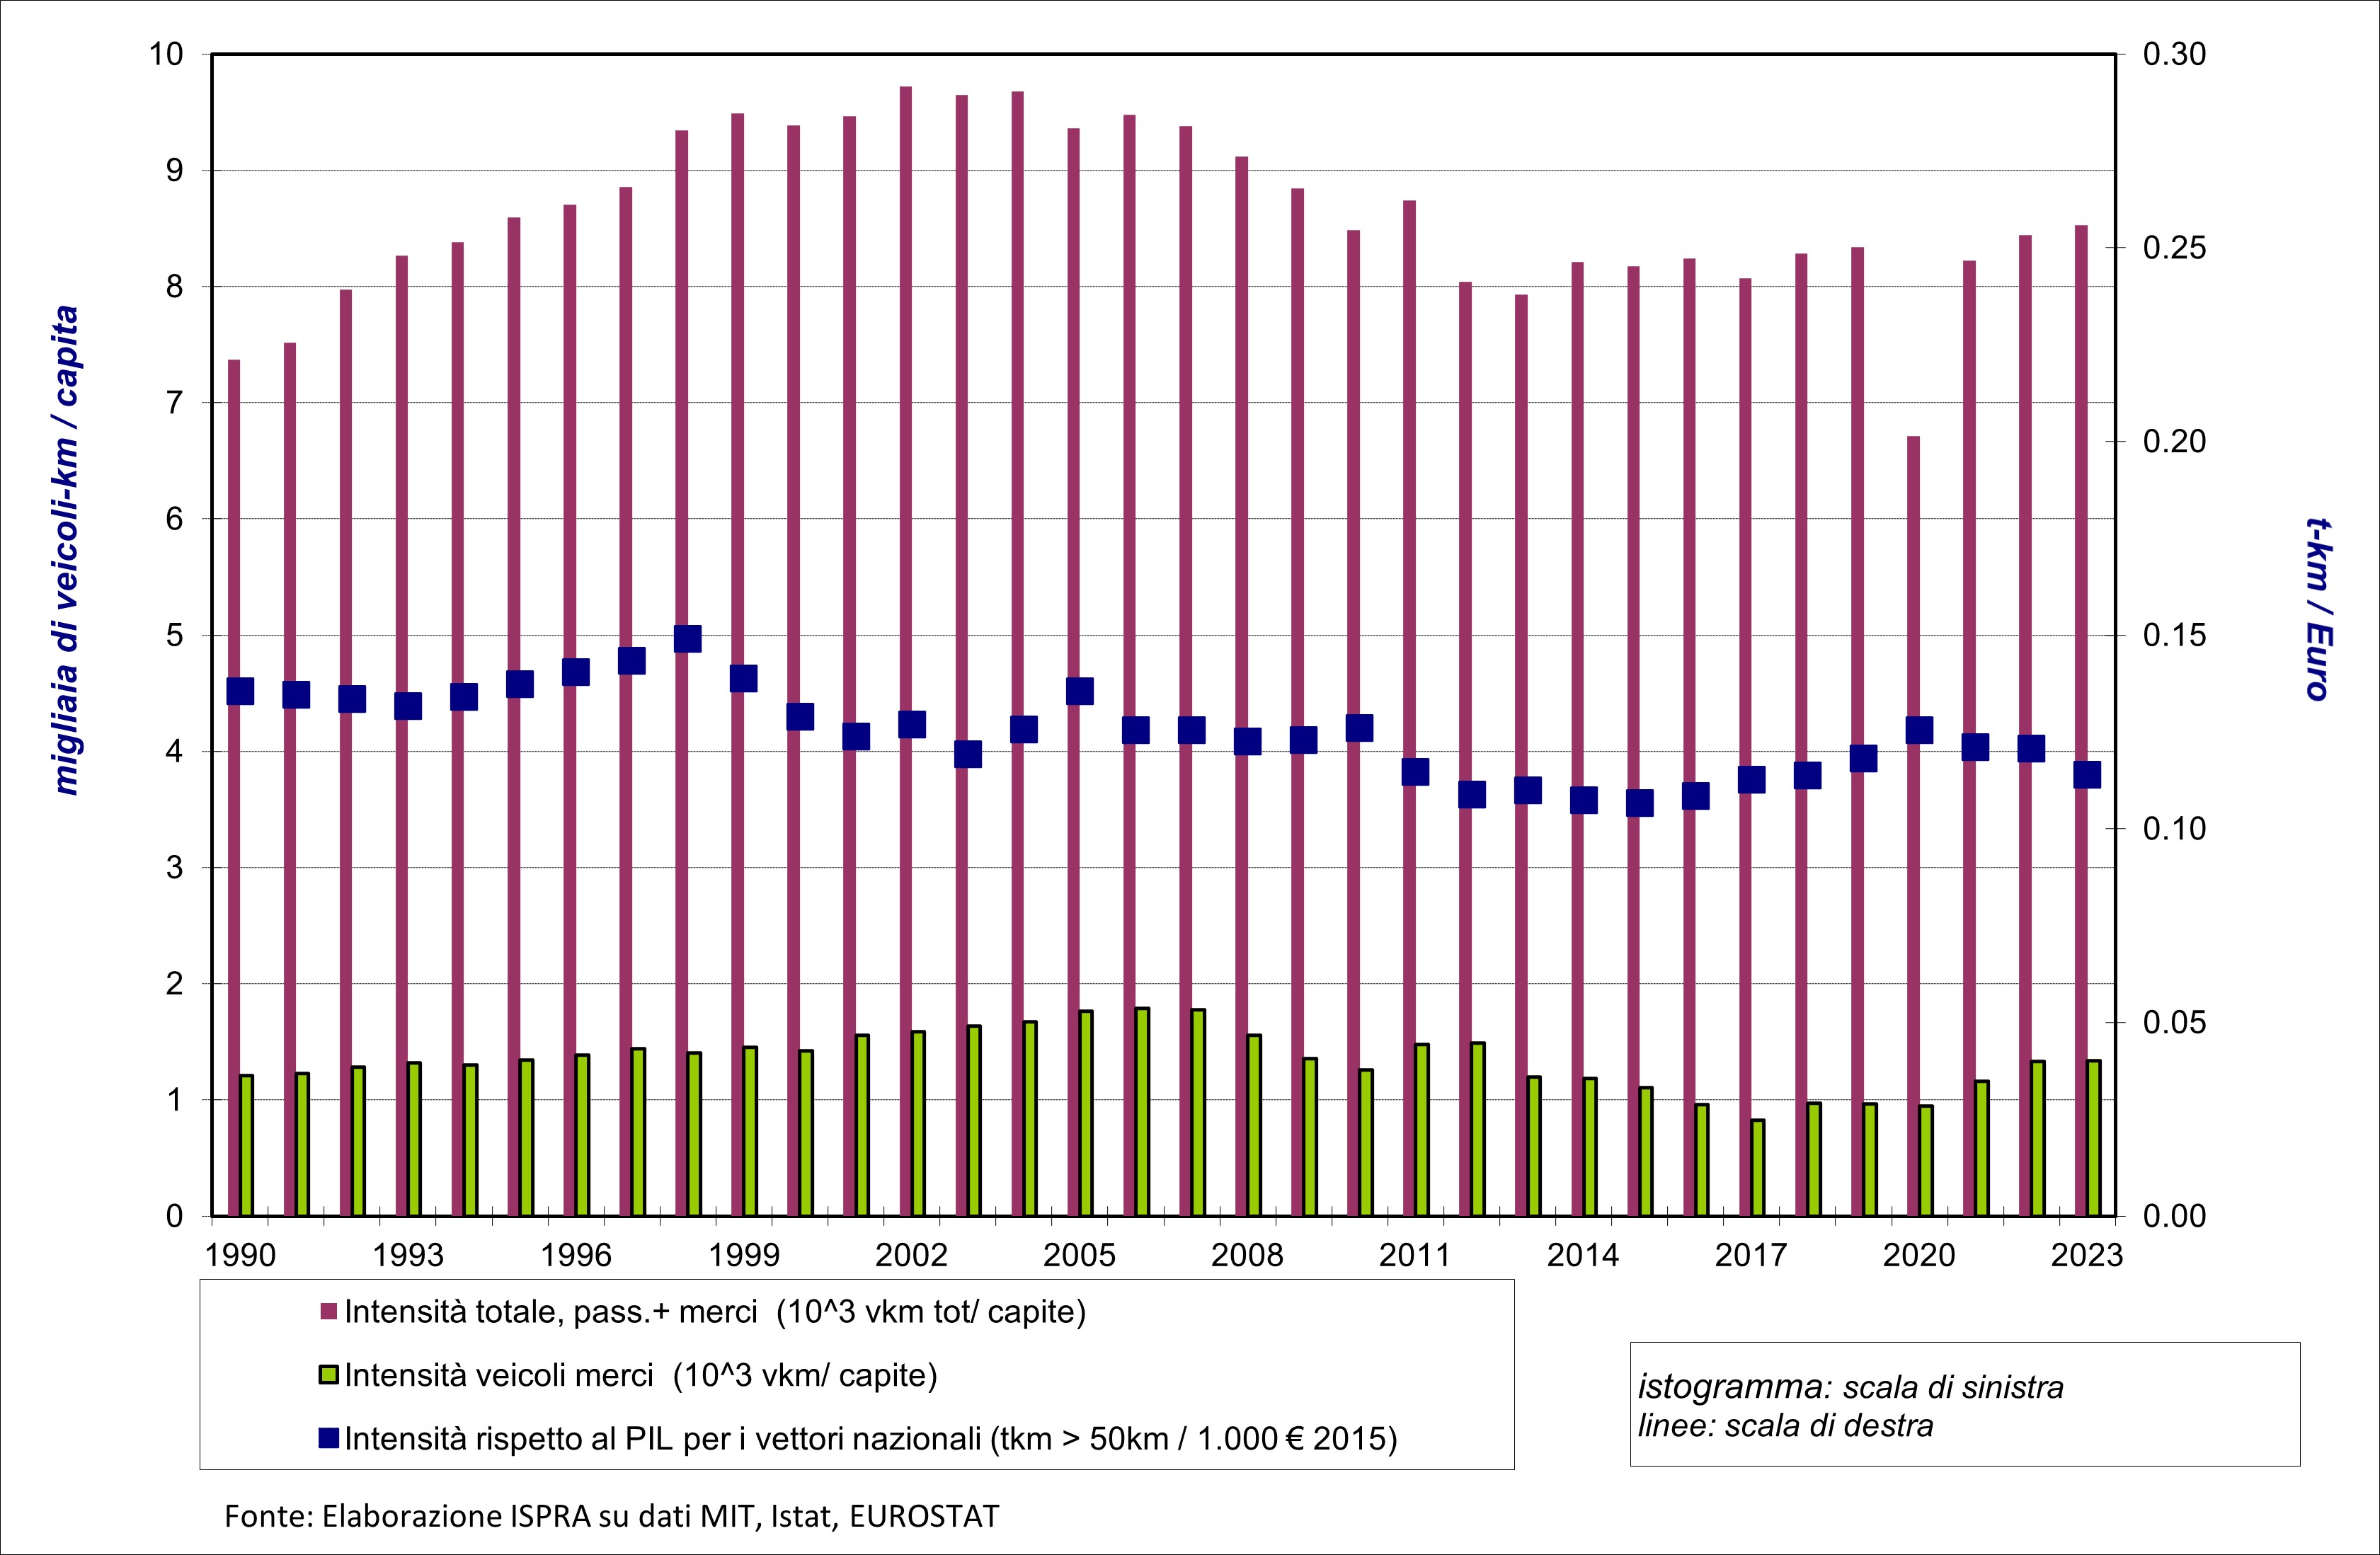
Figure 1: Transport intensity (total and freight-specific) relative to income and population Fonte
Data source: ISPRA processing of data from MIT, ISTAT, and EUROSTAT Note
1) Analysis restricted to vehicular transport with minimum payload capacity ≥3.5 metric tons. The freight transport operational definition encompasses: (i) trucks, (ii) vans, and (iii) foreign-registered vehicles (considering only the route segments traversing Italian territory). ISTAT has revised road freight transport data on several occasions; as a result, the historical series is not fully representative. The historical mileage series has been recalculated in accordance with updates to the ISPRA National Atmospheric Emissions Inventory. |
Thumbnail
Titolo
Figure 2: Total inland freight traffic in Italy, by mode of transport Fonte
CNIT data and ISPRA elaboration based on data from MIT, Confetra, Federtrasporto, ISTAT, EUROSTAT, and Centro Studi Subalpino Note
Italicized values indicate estimated data - Sums may not match totals due to rounding.
|
In Italy, over the period 1990–2016, road freight transport over distances greater than 50 km, performed by Italian carriers using vehicles with a gross vehicle weight exceeding 3.5 tonnes, declined overall by 25.7%. From 2017 onwards, a reversal of this trend can be observed, with a gradual recovery in volumes. For 2024, the National Transport Accounts (MIT) estimate traffic levels comparable to those recorded before the 2011 crisis, as well as a positive year-on-year variation of 3.2% (Table 1).
Over the period 1990–2024, rail freight transport recorded an overall increase of approximately 4.7%. This trend is characterised by a historical minimum in 2009, followed by a growth phase between 2014 and 2016 and a subsequent decline between 2017 and 2020. In 2024, total rail freight traffic amounted to around 23 billion tonne-kilometres, representing a decrease of 1.1% compared to 2023 (Table 1).
Maritime and inland waterway freight transport, whose modal share is estimated at 25.6% of the total in 2024, recorded an increase of 50.8% over the period 1990–2024 (Table 1), largely driven by the growth of containerised traffic. An even more pronounced increase is observed in air freight transport (+76% over the same period), which has recovered and exceeded pre-pandemic levels after the contraction recorded in 2020; however, its share of total freight transport remains very limited in 2024, also due to its predominant orientation towards international traffic, and is essentially stable compared to the previous year.
With reference to freight transport intensity (all modes), measured as tonne-kilometres per unit of income for national carriers (road transport over 50 km), the historical series — while taking into account the limitations in the reliability of the estimates noted in the footnote to Table 3 — shows a significant decline in the period 2011–2015, followed by a growth phase between 2016 and 2020, in conjunction with the economic recovery. In 2023, the indicator shows a slight decrease compared to 2022.
The evolution of road freight transport intensity, measured as vehicle-kilometres relative to income (Table 3), broadly follows the trend of total traffic, with a peak value recorded around 2006.