Tomaso Fortibuoni, Francesca Ronchi, Cecilia Silvestri
Any solid material, manufactured or transformed by man, abandoned or lost in the marine and coastal environment, or which reaches the sea in any way, is defined as marine waste. Italy, with Legislative Decree no. 190/2010 transposing the Framework Directive on the Strategy for the Marine Environment, has been carrying out an intense monitoring program of marine waste since 2015, including beached waste. Twice a year, in spring and autumn, the coastal Regional Environmental Protection Agencies (ARPA) carry out solid waste monitoring in the sample areas of 69 reference beaches along the national coast. To evaluate the degree of beach cleanliness based on the density of waste in the monitored sample areas, the Clean Coast Index (CCI), an indicator developed and applied internationally, was calculated.
In 2024, the CCI was calculated for 66 beaches in spring and 69 in autumn. In spring, 80% of the beaches monitored were clean or very clean, compared to 8% dirty or very dirty. In autumn, 81% of beaches were clean or very clean, while 9% were dirty or very dirty. The rest of the beaches were quite clean. Compared to the previous year, the percentage of clean or very clean beaches increased in autumn (77% in 2023), while in spring it remained almost unchanged. In both spring and autumn there was a decrease in dirty and very dirty beaches, from 12% to 8% and from 12% to 9%, respectively.
The Clean Coast Index (CCI) allows beaches to be classified into 5 categories based on the density of waste present in the monitored beach stretches:
- very clean beach;
- clean beach;
- fairly clean beach;
- dirty beach;
- very dirty beach.
The index was calculated starting from the data collected during monitoring activities conducted according to a methodology defined at European level as part of the Marine Strategy (MSFD Technical Group on Marine Litter, 2023). The monitoring of waste on beaches is carried out by the National System for Environmental Protection (SNPA), with the technical and scientific coordination of the Higher Institute for Environmental Protection and Research (ISPRA). The Ministry of the Environment and Energy Security (MASE) is the competent authority that guarantees the coordination of the activities envisaged as part of the implementation of the Marine Strategy.
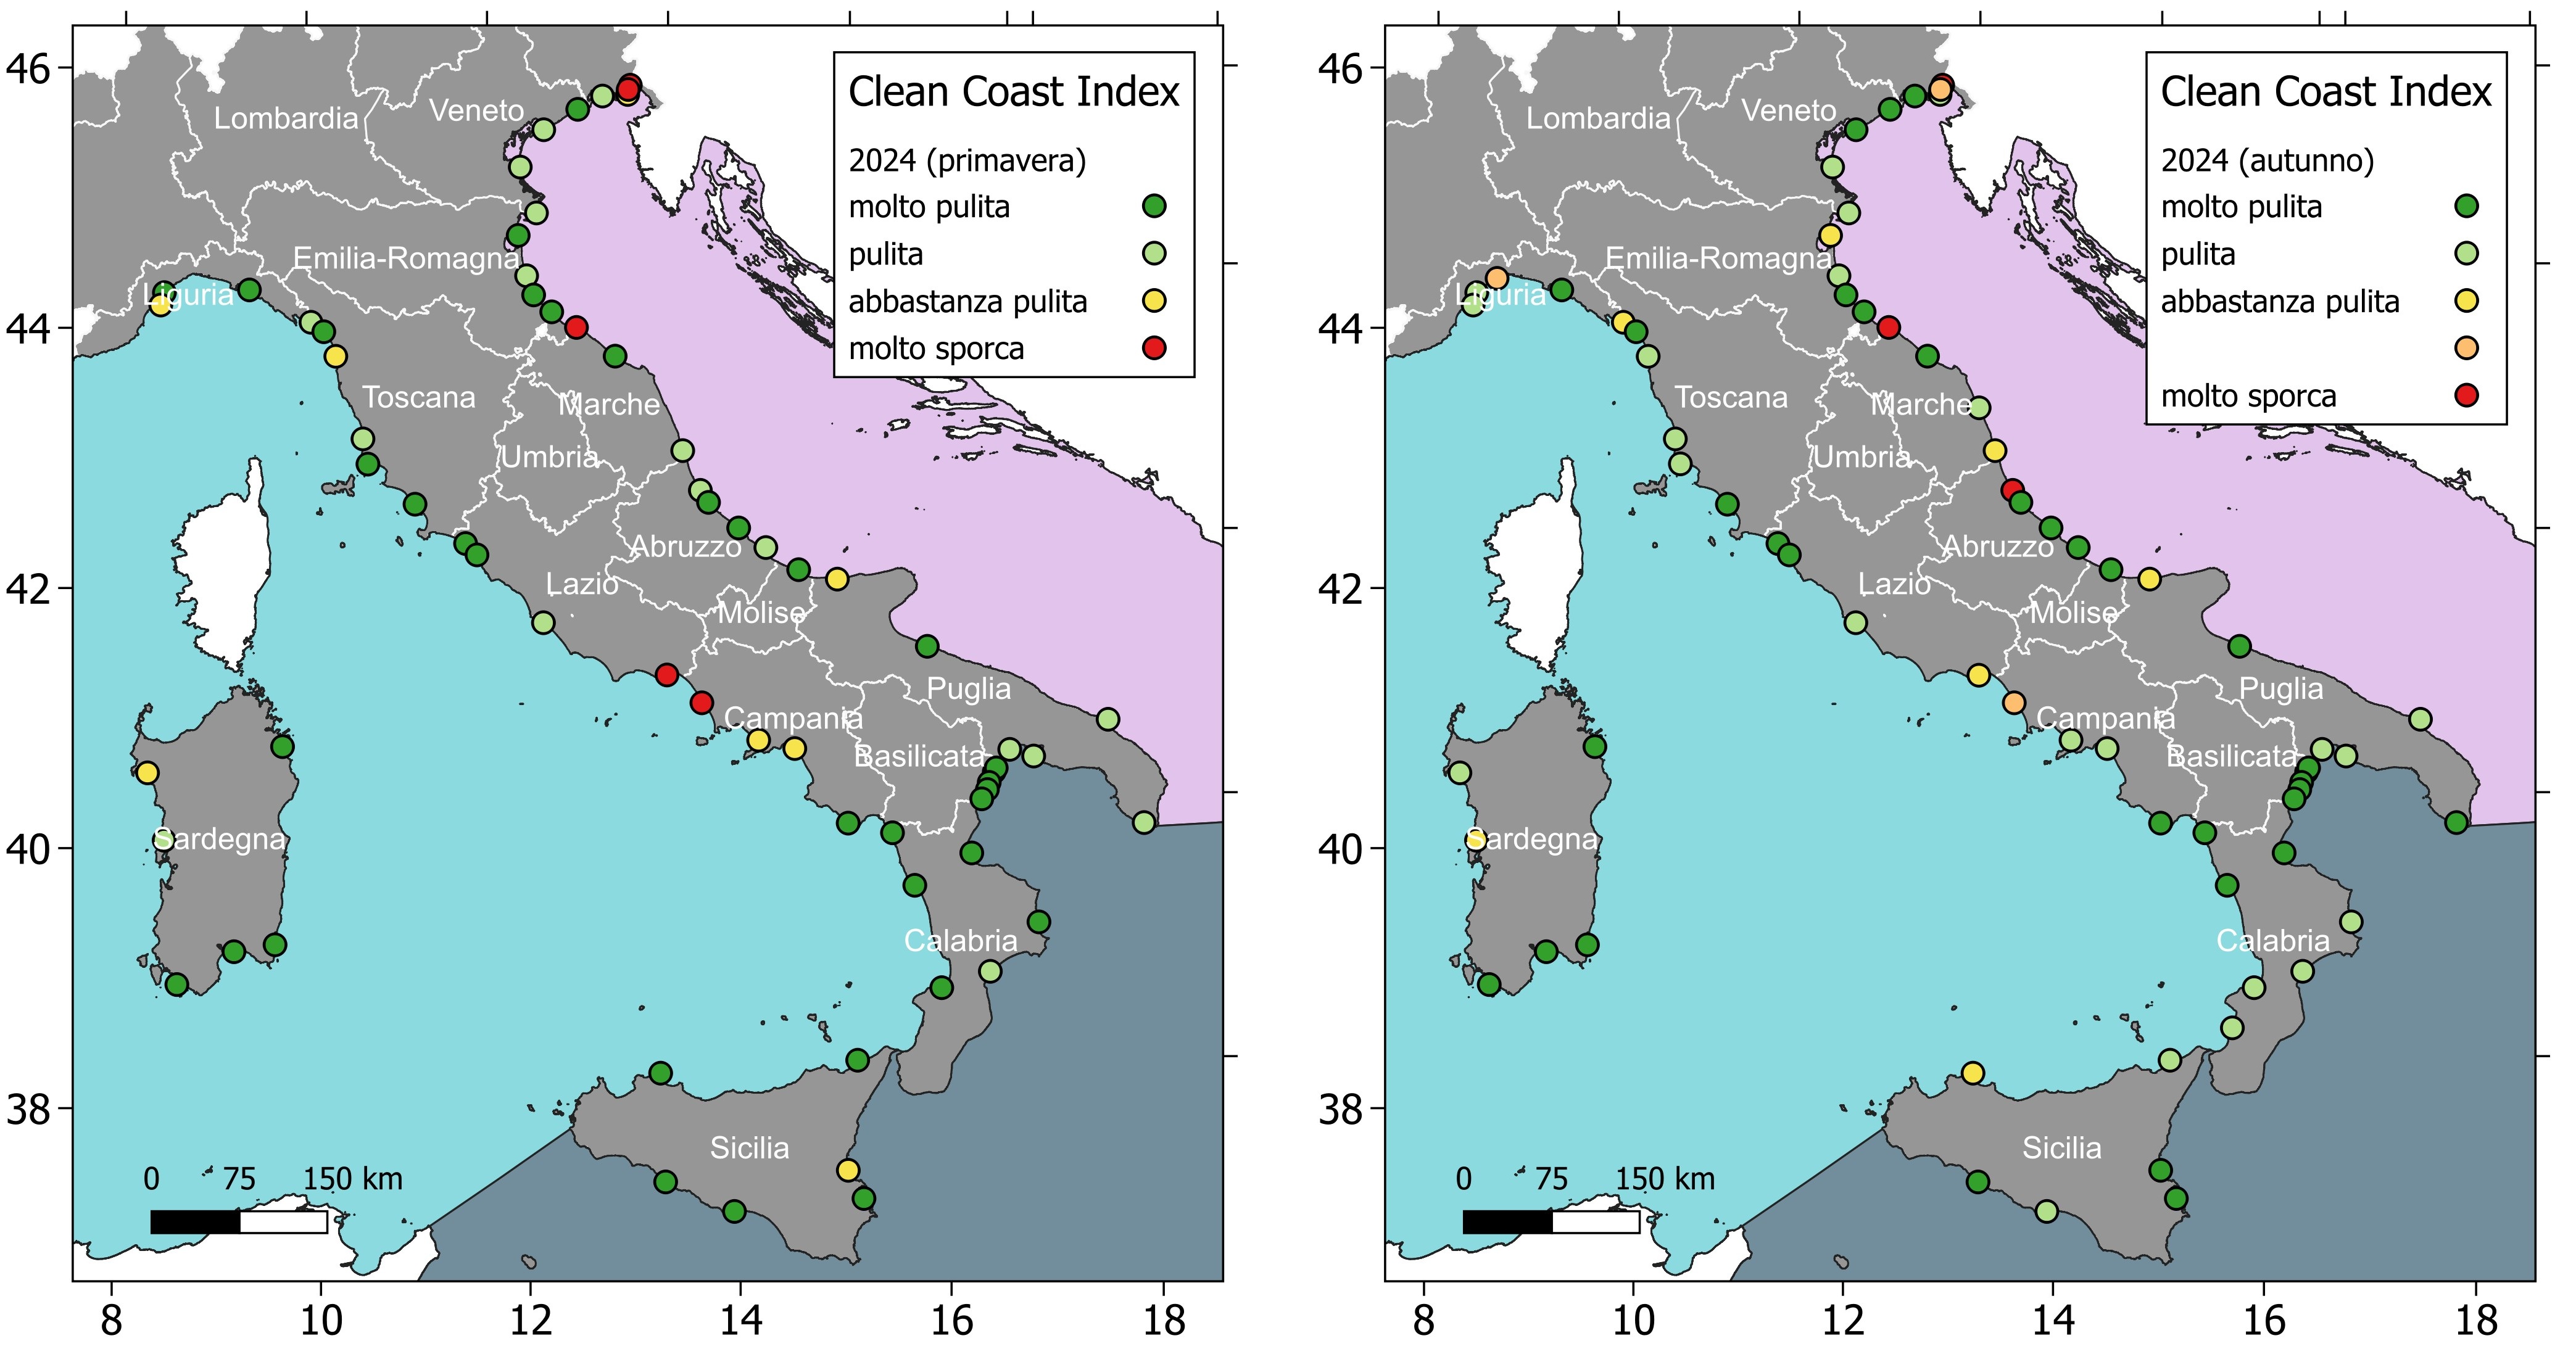
The index is displayed through symbols of different colours, from green to red, positioned on a map corresponding to the monitored coastlines (Figure 1). A representation of the percentage of beaches monitored by sub-region (Adriatic, Ionian and central Mediterranean, western Mediterranean) that present the different values of the index is also provided.
The index reflects the perception that users have of the cleanliness of the beaches (Alkalay et al., 2007; Cruz et al., 2020). It therefore represents an effective communication tool on the state of Italian beaches in terms of waste density. It also allows you to easily verify any reduction in waste on the beaches, identifiable by an increase in the percentage of clean and very clean beaches compared to previous years.
Directive 2008/56/EC of the European Parliament and of the Council of 17 June 2008 establishing a framework for Community action in the field of marine environmental policy (Marine Strategy Framework Directive).
Legislative Decree 13 October 2010, n. 190. Implementation of Directive 2008/56/EC establishing a framework for community action in the field of marine environmental policy.
Decree 11 February 2015. Determination of the indicators associated with the environmental objectives and monitoring programmes, prepared pursuant to articles 10, paragraph 1 and 11, paragraph 1, of Legislative Decree no. 190/2010.
Alkalay R., Pasternak G., Zask A. (2007). Clean-coast index-A new approach for beach cleanliness assessment. Ocean and Coastal Management. 50, 352–362.
Cruz C. J., Muñoz-Perez J. J., Carrasco-Braganza M., Poullet P., Lopez-Garcia P., Contreras A., and Silva R. (2020). Beach cleaning costs. Ocean & Coastal Management, 188: 105118. https://linkinghub. elsevier. com/retrieve/pii/S0964569120300284.
MSFD Technical Group on Marine Litter, Guidance on the Monitoring of Marine Litter in European Seas An update to improve the harmonized monitoring of marine litter under the Marine Strategy Framework Directive, EUR 31539 EN, Publications Office of the European Union, Luxembourg, 2023, ISBN 978-92-68-04093-5, doi:10.2760/59137, JRC133594.
Rangel-Buitrago N., Mendoza A. V., Gracia C A., Mantilla-Barbosa E., Arana V. A., Trilleras J., and Arroyo-Olarte H. (2019). Litter impacts on cleanliness and environmental status of Atlantic department beaches, Colombian Caribbean coast. Ocean & Coastal Management, 179: 104835. Elsevier. https://linkinghub. elsevier. com/retrieve/pii/S0964569119301887.
SNPA
http://www. db-strategiamarina. isprambiente. it/app/#/datiMonitoraggio20182023
https://www. emodnet-chemistry. eu/marinelitter
National
2018-2024
The index is calculated as the product between the density (objects/m²) of waste larger than 2.5 cm present in a portion of the beach of known surface area and a constant K, to which the value 20 is conventionally assigned (Alkalay et al., 2007). While in its original formulation the CCI was calculated only by considering plastic waste (Alkalay et al., 2007), in this context the formulation proposed by Rangel-Buitrago et al. Was adopted. (2019) which considers the sum of all waste as the numerator, not just plastic waste.
CCI = (total waste/monitored area) * 20
The numerical index is then coded as follows:
- very clean beach (CCI: = 0–2);
- clean beach (CCI = 2–5);
- fairly clean beach (CCI = 5–10);
- dirty beach (CCI = 10–20);
- very dirty beach (CCI > 20).
Waste detection is carried out twice a year, in spring and autumn.
At a national level (Figure 1), approximately half of the beaches monitored were very clean (55% in spring and 48% in autumn) or clean (26% in spring and 33% in autumn), while the percentage of dirty or very dirty beaches was low in both seasons (around 8%). In the Ionian and Central Mediterranean subregion, almost all beaches were very clean or clean in both seasons. The Adriatic, on the other hand, has the highest percentages of dirty or very dirty beaches (13% in spring and 17% in autumn), even if over half of the beaches are clean or very clean (78% in spring and 71% in autumn). In the Western Mediterranean sub-region only 2 beaches were very dirty in spring and none in autumn, while there were only 2 dirty beaches in autumn and none in spring.
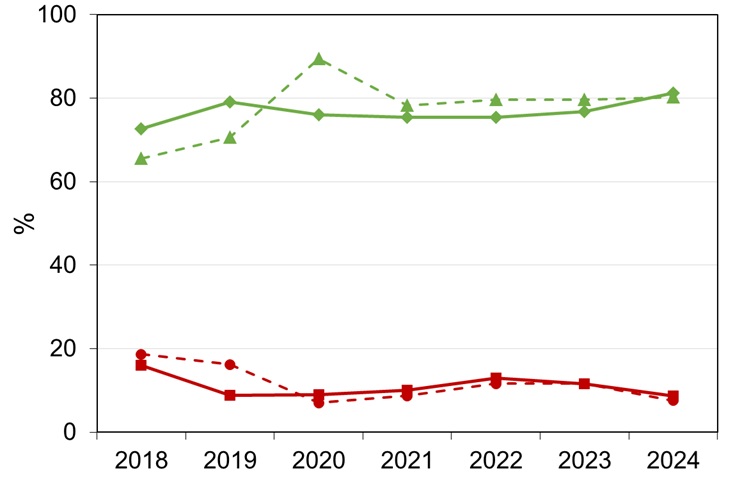
In 2024 the trend of decrease in the percentage of dirty and very dirty beaches is confirmed, which went from 2018 to 2024 from 19% to 8% in spring and from 16% to 9% in autumn. Conversely, the percentage of clean or very clean beaches increased from 66% to 80% in spring and from 73% to 81% in autumn (2018 vs 2024). Note how, in the spring of 2020, the percentage of very clean and clean beaches reached the maximum value of the available historical series (89%), a period in which many human activities were suspended or reduced due to the lockdown linked to the COVID-19 pandemic (Figure 2).
| Data |
|---|
Thumbnail
Titolo
Figure 1: Map of beaches monitored in spring and autumn classified according to the Clean Coast Index Fonte
ISPRA processing on ARPA data Legenda
The index is displayed through different colored symbols, from green to red, positioned on a map corresponding to the monitored coastlines |
Thumbnail
Titolo
Figure 2: Percentage of very clean and clean (green lines) and dirty and very dirty (red lines) beaches over the years (2018-2024) Fonte
ISPRA processing on ARPA data |
Thumbnail
Titolo
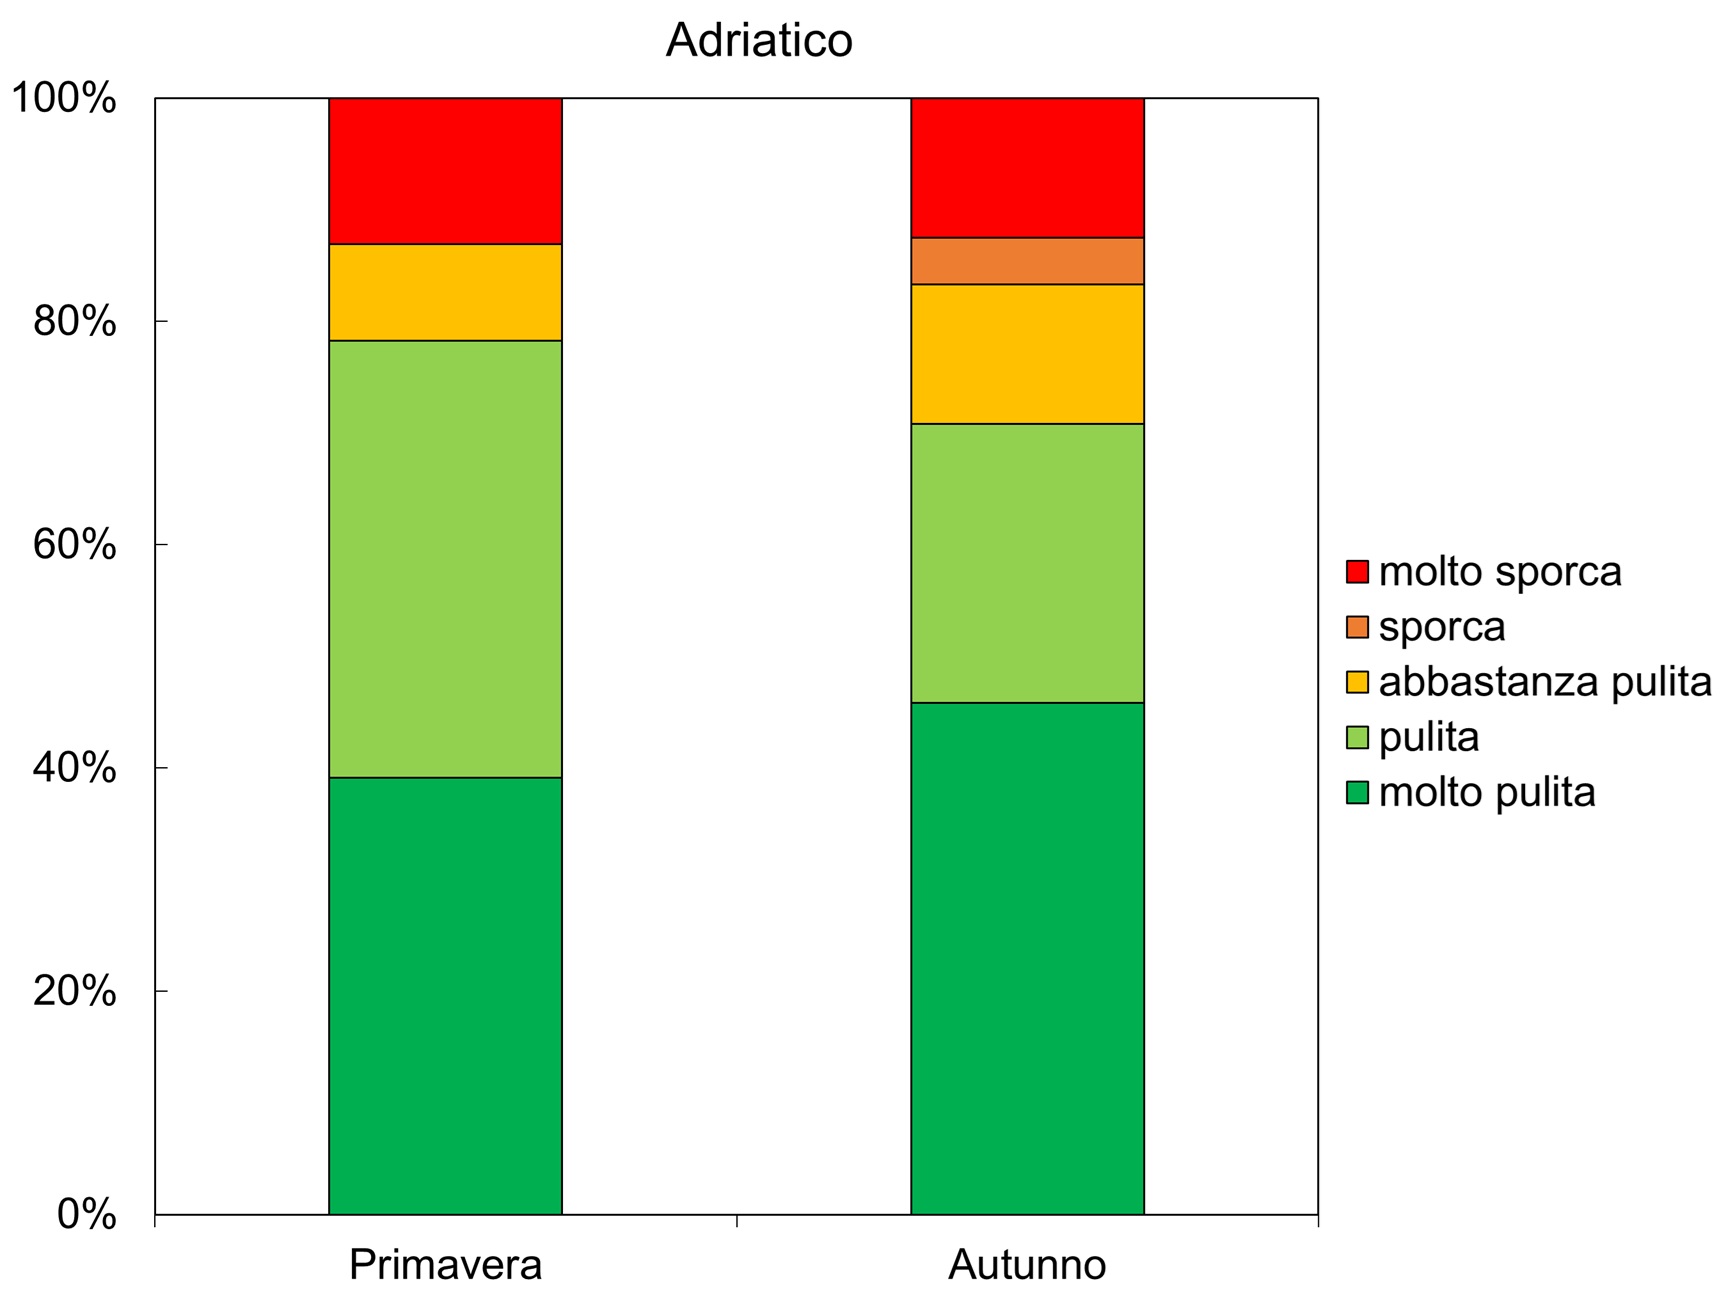
Figure 3: Breakdown in percentage terms of the different beach categories classified according to the Clean Coast Index in the Adriatic subregion (2024) Fonte
ISPRA processing on ARPA data |
Thumbnail
Titolo
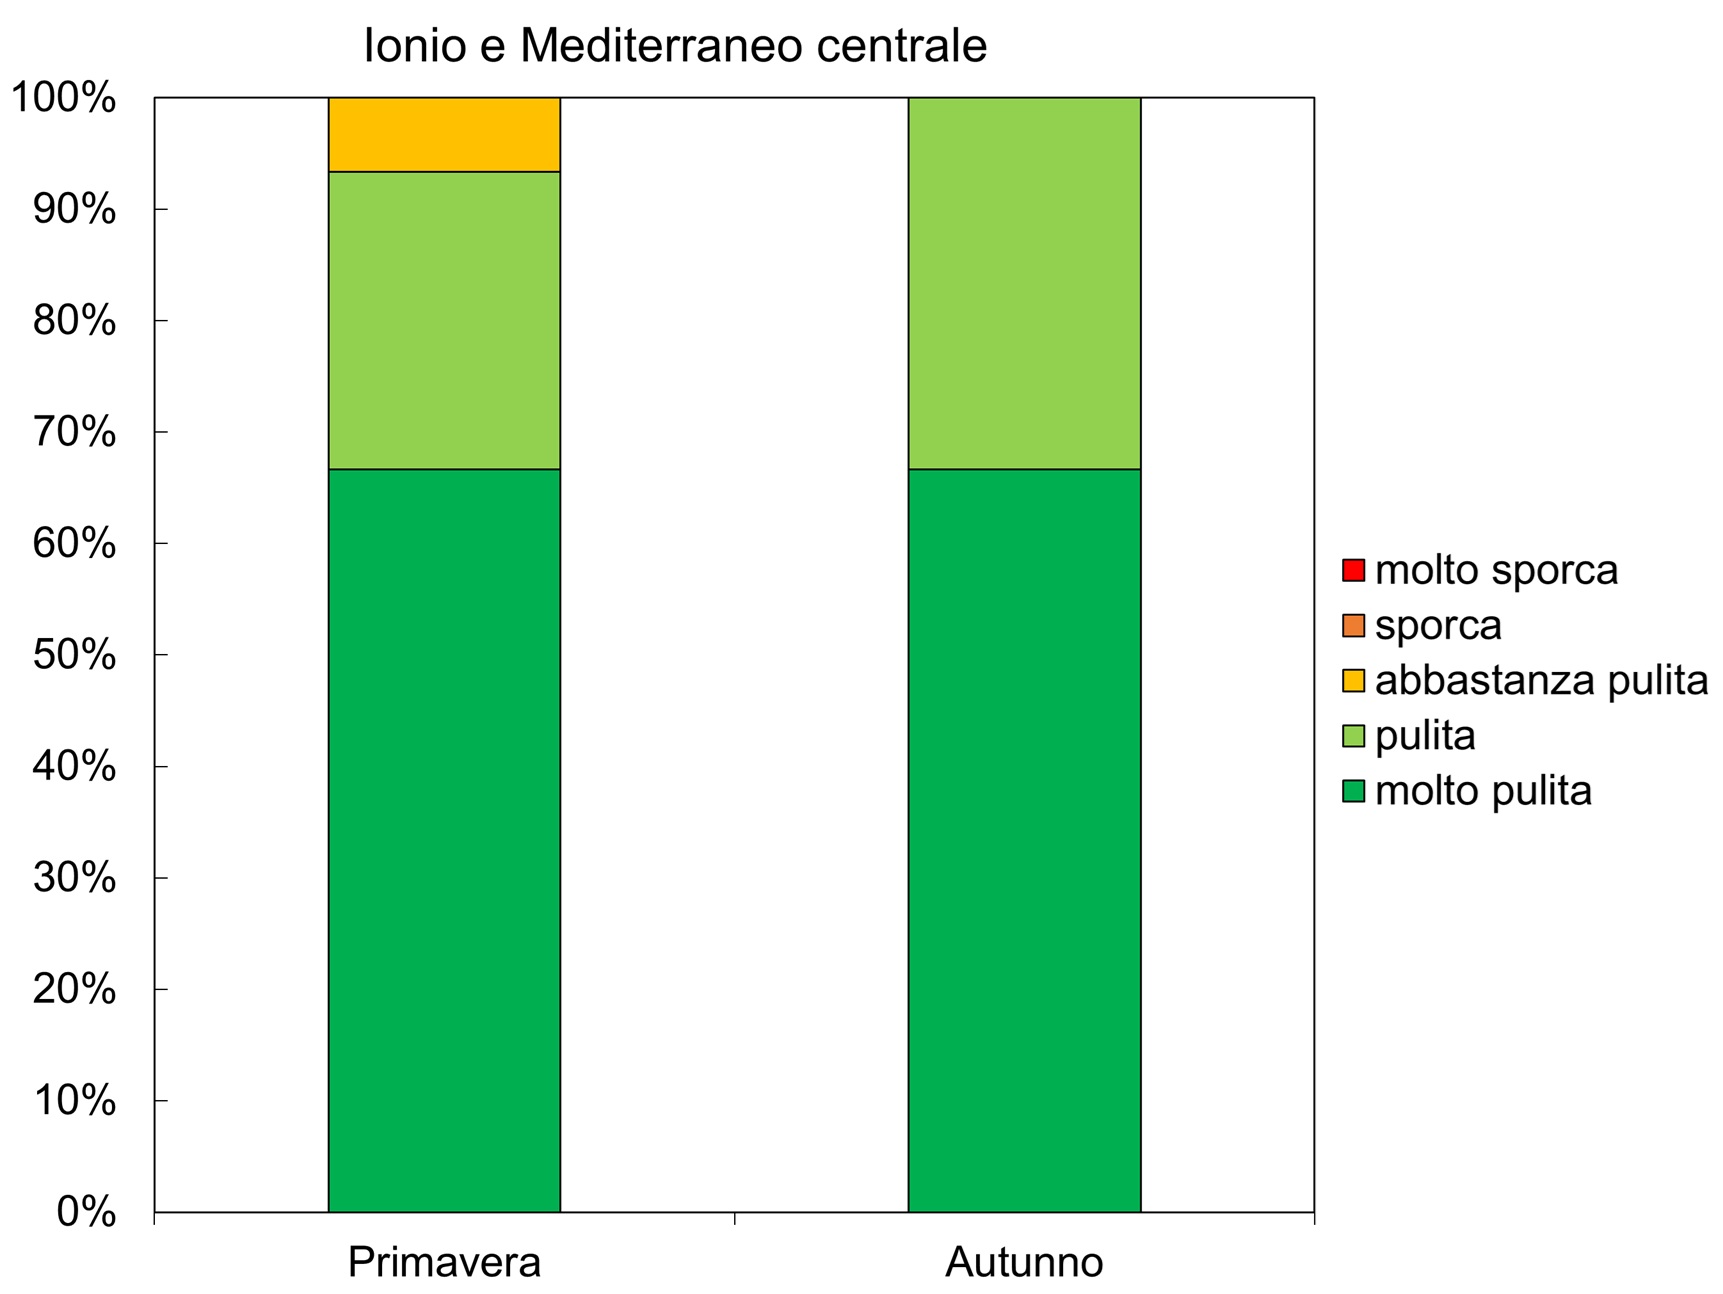
Figure 4: Breakdown in percentage terms of the different beach categories classified according to the Clean Coast Index in the Ionian and Central Mediterranean sub-region (2024) Fonte
ISPRA processing on ARPA data |
Thumbnail
Titolo
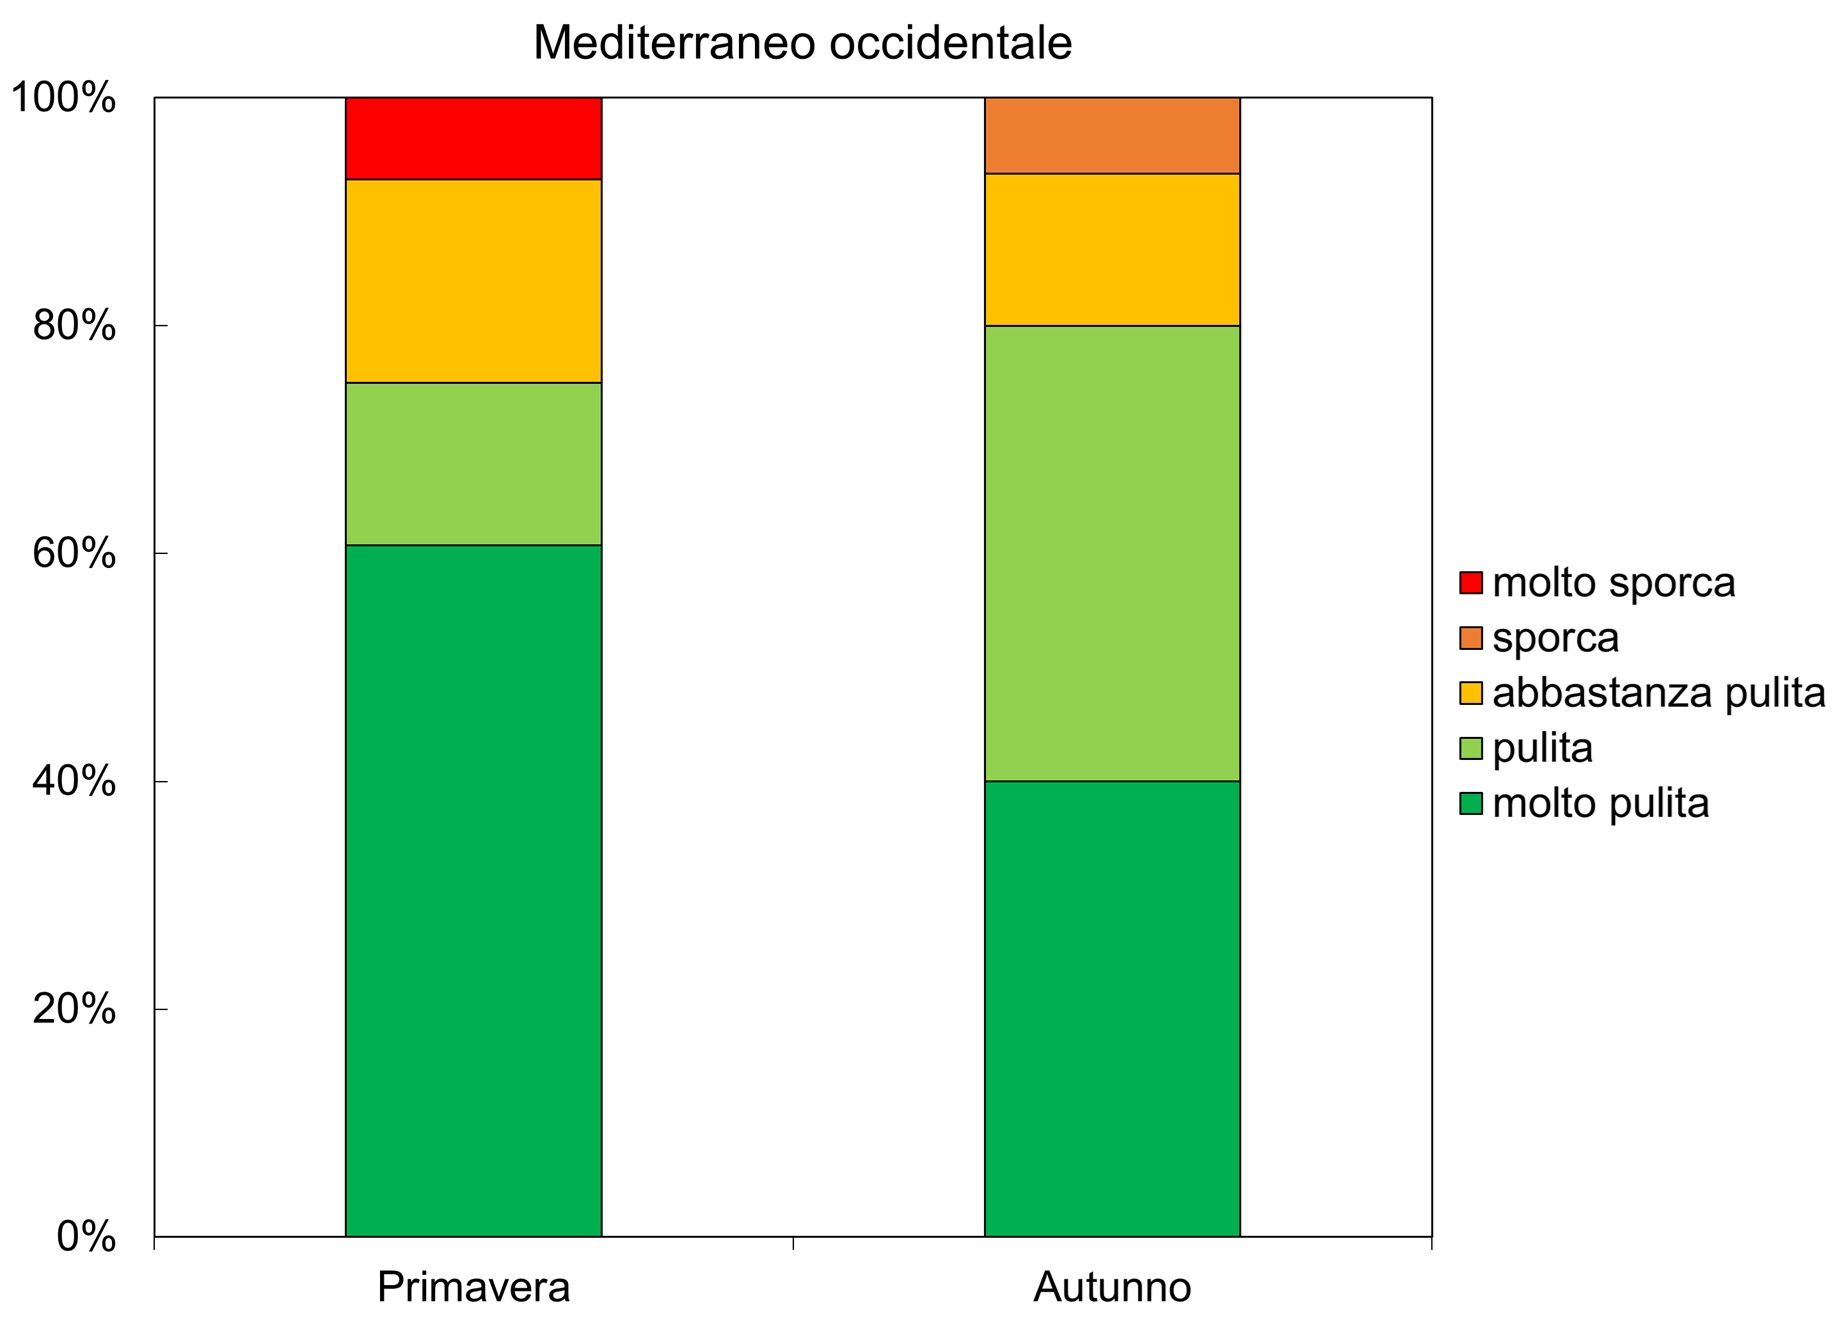
Figure 5: Breakdown in percentage terms of the different beach categories classified according to the Clean Coast Index in the Western Mediterranean sub-region (2024) Fonte
ISPRA processing on ARPA data |
In 2024, in spring and autumn, in the Adriatic, 78% and 71% of the monitored beaches were clean or very clean, while 13% and 17% were classified as dirty or very dirty (Figure 3). In the Ionian and Central Mediterranean sub-region almost all beaches were clean or very clean in both seasons (93% in spring and 100% in autumn) (Figure 4). Finally, in the western Mediterranean, 75% of beaches were clean or very clean in spring and 80% in autumn; dirty or very dirty beaches were equal to 7% in both seasons (Figure 5). The remaining portion of beaches in each subregion were found to be fairly clean.
The situation of Italian beaches in 2024 appears similar to what was observed in 2023, with high percentages of clean and very clean beaches and low percentages of dirty or very dirty beaches.