Angela Cimini, Pasquale Dichicco, Chiara Giuliani, Lorella Mariani.
The percentage of consumed soil within the first 300 metres from the coastline is more than three times the national average for the rest of the country. In two of the 15 coastal regions, it affects almost half of the total area, with a maximum in Liguria (48.15%) and Marche (45.64%).
Soil consumption remains above the national average in 9 out of 15 regions in the belt between 300 and 1,000 metres from the coastline, with a maximum in Emilia-Romagna (35.67%), and in 9 out of 15 regions also in the belt between 1,000 and 10,000 metres from the coastline.
The indicator provides an overview of the percentage of soil consumption due to artificial land cover in Italian coastal areas. Land cover is related to but distinct from land use. According to Directive 2007/2/EC, land cover refers to the biophysical surface of the Earth, including artificial surfaces, agricultural land, forests, semi-natural areas, wetlands, and water bodies. Soil sealing is the most evident form of artificial land cover. Other forms of artificial cover include:
- Total loss of soil resources through excavation and open-pit mining activities.
- Partial loss of soil functionality, often remediable, due to contamination, compaction, and the presence of industrial plants, infrastructure, buildings, permanent material deposits, or transport routes.
Coastal areas hold irreplaceable ecological, cultural, and economic resources, making them unique ecological assets. Soil consumption in these regions leads to irreversible alterations in landscapes and ecological balances, affecting sedimentology and geomorphology, increasing salinization processes, and contributing to pollution of soil, surface water, and groundwater, with direct impacts on marine water quality.
To quantify the extent of artificial land cover in coastal areas and monitor the temporal evolution of the phenomenon, particularly in regions where tourism pressure and urbanization from new infrastructure are most intense.
European Environmental Action Programmes and Agenda 21 identify the sustainable use of land and the protection of nature and biodiversity as key overarching objectives. For several years, the European Commission has been committed to promoting more sustainable land and soil use.
The new proposal for a Directive on soil monitoring and resilience (COM(2023) 416 final – Soil Health Law) highlights the importance of healthy soils capable of delivering essential ecosystem services and the need to introduce good practices to mitigate the negative effects of soil sealing on soil functions. These objectives were already set out in previous European strategic documents, including the Roadmap to a Resource-Efficient Europe and the Thematic Strategy on the Urban Environment (COM/2005/0718).
On 5 July 2023, the European Commission adopted the proposal for a directive entitled Soil Monitoring and Resilience. Compared with the long-awaited Soil Health Law announced in the EU Soil Strategy for 2030, the Commission opted for a two-step approach, prioritising soil monitoring and quality assessment ahead of the introduction of binding legal limits, which are postponed to the evaluation phase of the directive, six years after its approval.
On 18 August 2024, the Nature Restoration Law entered into force, adopted through Regulation (EU) 2024/1991 of the European Parliament and of the Council of 24 June 2024. Its main objective is to halt and reverse biodiversity loss in the EU, achieve climate neutrality by 2050, adapt to climate change, and improve food security. The Regulation establishes specific obligations for different ecosystem types, including agricultural land, forests, and urban ecosystems, and—together with the objectives of the EU Biodiversity Strategy for 2030—creates a framework within which Member States implement effective restoration measures aimed at:
- restoring 20% of degraded ecosystems by 2030 and all ecosystems in need of restoration by 2050;
- restoring at least 30% of terrestrial, coastal, freshwater, and marine ecosystems that are not in good condition by 2030, with particular attention to protected habitats and Natura 2000 areas;
- removing artificial barriers to restore at least 25,000 km of free-flowing rivers;
- planting at least three billion trees by 2030 to enhance biodiversity and urban ecosystems.
At regional level, several regulations establish objectives for the progressive containment of land consumption. With specific reference to coastal areas, Law No. 431/1985, known as the Galasso Law, introduced a landscape protection constraint and an absolute ban on building within the first 300 metres from the coastline.
Munafò, M. (ed.), 2025. Land consumption, territorial dynamics and ecosystem services. 2025 edition. SNPA environmental reports, 46/2025
Difficulty in the availability of very high-resolution imagery for certain areas.
The availability of very high-resolution imagery is instrumental in improving the quality of the indicator, making estimates of land consumption within coastal areas more consistent and accurate.
- ISPRA
- SNPA (National System for Environmental Protection)
For data on land consumption: (http://groupware.sinanet.isprambiente.it/uso-copertura-e-consumo-di-suolo/library/consumo-di-suolo)
National, Regional
2006, 2012, 2015-2024
Using GIS tools, the 2024 national ultra-high-resolution land consumption map was overlaid with buffers of 300 metres, 1,000 metres, and 10 km from the coastline, and the percentage of consumed land was calculated for each distance band.
By comparing these data with revised figures from previous years, the new land consumption affecting coastal areas between 2006 and 2024 was estimated. The availability of new satellite data made it possible to refine estimates for the entire historical time series, improving the overall results.
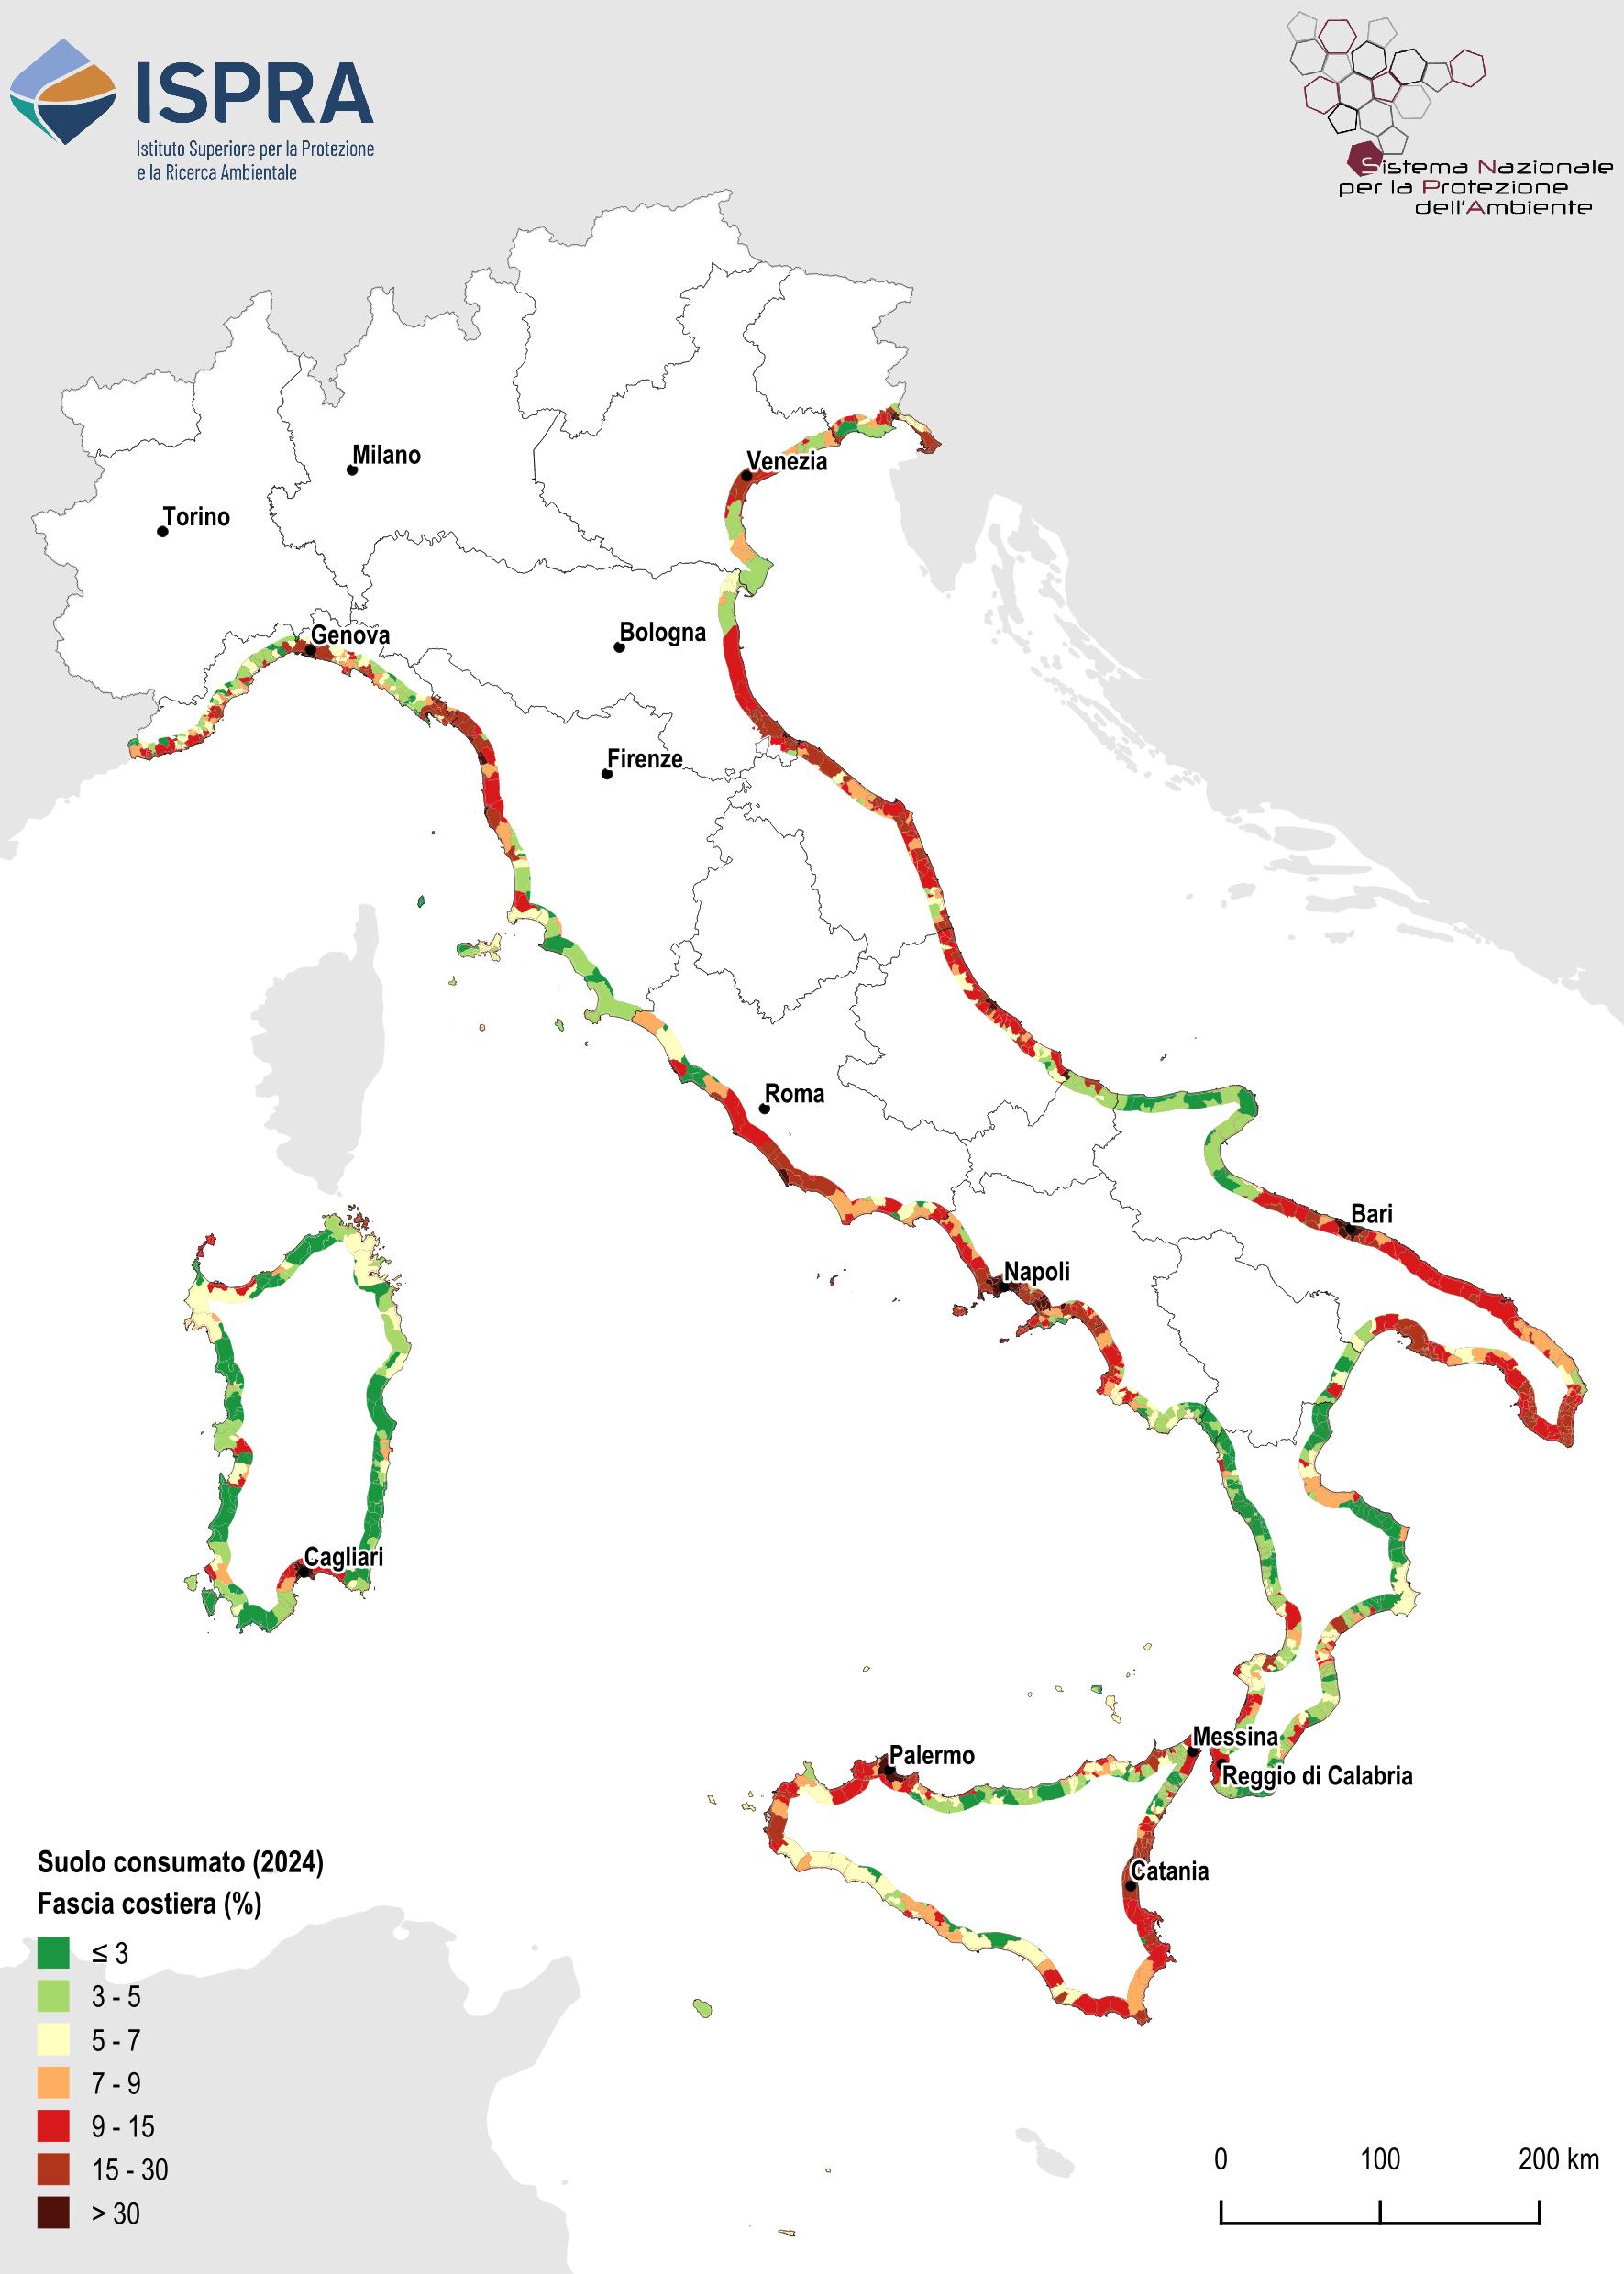
Despite the fact that coastal ecosystems are fragile areas characterised by high biological productivity, in 2024 land consumption within the first 300 metres from the coastline is about three times higher than the national average (22.9% compared with 7.17%; see the indicator “Soil Sealing and Land Consumption”) (Figure 2 and Table 1).
Analysis of the historical time series from 2006 to 2024 (Table 5) shows that Basilicata and Molise are the regions with the highest increase in consumed hectares in the immediate coastal strip (0–300 m), with increases of 12.2% and 6.7%, respectively.
Apulia, Lazio, Marche, Tuscany, Campania, Liguria, and Sardinia show increases below the national average (2.8%).
In the belt between 300 and 1,000 metres, Basilicata ranks first with an increase of over 14%, followed by Calabria with 8.5%.
In the zone between 1 and 10 km from the coast, Lazio, Basilicata, Emilia-Romagna, and Molise show increases exceeding 10%. A similar situation is observed in the outermost belt (beyond 10 km), where Apulia (10.4%) and Basilicata (8.4%) record the highest values, followed by Sicily and Abruzzo with increases above 7%.
Liguria and Tuscany consistently show increases below the national average across all distance bands considered.
| Data |
|---|
Headline
Table 1: Regional distribution of soil consumption in coastal areas (within 300 metres) Data source
ISPRA processing on SNPA cartography Note
2024 update |
Headline
Table 2 – Regional distribution of soil consumption in coastal areas (between 300 and 1,000 m) Data source
ISPRA processing on SNPA cartography Note
2024 update |
Headline
Table 3 – Regional distribution of soil consumption in coastal areas (between 1 and 10 km) Data source
ISPRA processing on SNPA cartography Note
2024 update |
Headline
Table 4 – Regional distribution of soil consumption in coastal areas (beyond 10 km) Data source
ISPRA processing on SNPA cartography Note
2024 update |
Headline
Table 5: Percentage variation in consumed hectares in coastal areas Data source
ISPRA processing on SNPA cartography Note
2024 update |
Thumbnail
Titolo
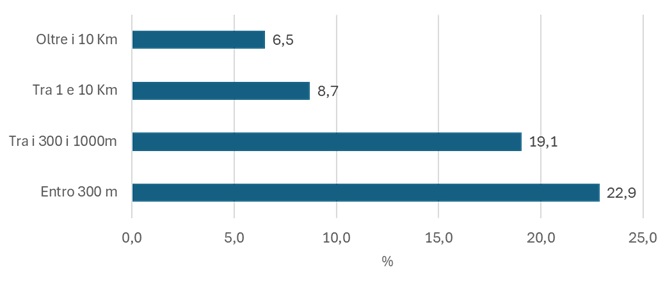
Figure 1: Percentage of soil consumption in the coastal belt Fonte
ISPRA |
Thumbnail
Titolo
Figure 2: Soil consumption in coastal areas (2024) Fonte
ISPRA |
Soil consumption in coastal areas is assessed by analysing different distance bands from the coastline: 0–300 m (where almost one quarter of the territory is artificialised), 300–1,000 m (19.0%), 1–10 km (8.7%), and beyond 10 km (6.5%) (Tables 2, 3, and 4).
Results show that the highest percentage of consumed land occurs in the first band (0–300 m), where values are around 30% in many regions, with maximum values in Liguria (48.2%) and Marche (45.7%). In Abruzzo, Emilia-Romagna, Campania, Lazio, Apulia, Calabria, and Sicily, values approach or exceed 30%, while in the remaining regions they are below the national average (22.9%) (Table 1).
With the sole exception of Basilicata and, to a lesser extent, Sardinia, the percentage of consumed land in the 2023–2024 period tends to increase as proximity to the coastline increases.
Between 300 and 1,000 metres, the regions with land consumption values equal to or greater than 30% are Campania (30.3%), Marche (30.8%), Abruzzo (32.8%), and Emilia-Romagna (35.7%) (Figure 1 and Table 2).
Over the last 15 years, in the belt beyond 10 km from the coastline, Veneto consistently exceeds 11% of consumed land; in the 1–10 km belt, Campania ranks first with values above 16%; while in the 300–1,000 m belt, Emilia-Romagna shows values above 35% (Tables 1, 2, 3, and 4).