SOIL CONSUMPTON IN COASTAL AREAS
Data aggiornamento scheda:
The percentage of consumed soil within the first 300 metres from the coastline is more than three times the national average for the rest of the country. In two of the 15 coastal regions, it affects almost half of the total area, with a maximum in Liguria (48.15%) and Marche (45.64%).
Soil consumption remains above the national average in 9 out of 15 regions in the belt between 300 and 1,000 metres from the coastline, with a maximum in Emilia-Romagna (35.67%), and in 9 out of 15 regions also in the belt between 1,000 and 10,000 metres from the coastline.
SOIL CONSUMPTION IN LEGALLY PROTECTED AREAS
Data aggiornamento scheda:
Legislative Decree No. 42/2004 (the Urbani Code) is the main regulatory reference for the protection, conservation, and enhancement of cultural heritage (cultural assets and landscape).
As of 2024, protected areas show a percentage of consumed land lower than the national average (5.42%), with an increase in the last year of just over 1,520 hectares. Campania is the region with the highest percentage of land consumption within protected areas (11.05%).
The largest increase in land consumption occurred in Lombardy (+146.11 hectares), followed by Emilia-Romagna (+131.43 hectares), Sardinia (+123.46 hectares), and Lazio (+121.08 hectares).
The highest land consumption density is recorded in Apulia (3.61 m²/ha).
SOIL SEALING AND SOIL CONSUMPTION
Data aggiornamento scheda:
The indicator quantifies soil consumed as a result of a change from a non-artificial soil cover to an artificial soil cover, according to the principle of net land take, i.e. net of transformations from consumed soil back to non-consumed soil (generally the restoration of construction sites and other areas that in the previous year fell under reversible soil consumption).
Gross soil consumption recorded in 2024 affected 8,370 hectares of territory, causing the often irreversible loss of natural, semi-natural, and agricultural areas and their related ecosystem services.
LAND USE
Data aggiornamento scheda:
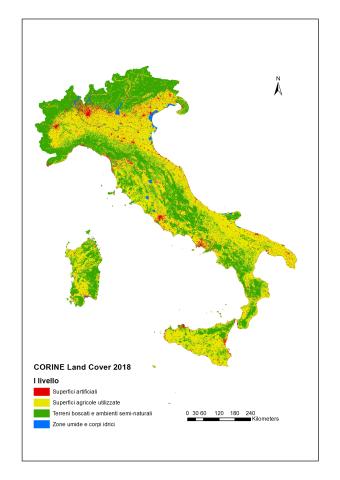
The indicator describes land use (agricultural, urban, industrial or commercial, infrastructure, recreational, natural and semi-natural, water bodies, etc.), reporting the territorial surfaces associated with different classes according to the CORINE Land Cover classification system. Between 2012 and 2018, there was a continued general increase in artificial urban areas, primarily at the expense of agricultural land. In Italy, as in the rest of Europe, cultivated areas show a contraction, linked not only to urbanization processes but also to agricultural land abandonment.