Panel 1
Marco Di Leginio
The indicator describes land use (agricultural, urban, industrial or commercial, infrastructure, recreational, natural and semi-natural, water bodies, etc.), reporting the territorial surfaces associated with different classes according to the CORINE Land Cover classification system. Between 2012 and 2018, there was a continued general increase in artificial urban areas, primarily at the expense of agricultural land. In Italy, as in the rest of Europe, cultivated areas show a contraction, linked not only to urbanization processes but also to agricultural land abandonment.
The indicator describes the quantitative variation of different types of areas classified as homogeneous in their use (agricultural, urban, industrial or commercial, infrastructure, recreational, natural and semi-natural, water bodies, etc.), at the study scale and according to the CORINE Land Cover classification system. Depending on the type of area considered, land use changes may result from economic processes, crop changes, industrialization, urbanization, or infrastructure development.
The indicator is based on data from CORINE Land Cover (CLC) projects for the years 1990, 2000, 2006, 2012, and 2018. These projects are a joint initiative of the European Environment Agency (EEA) and the European Commission, covering nearly all European countries. Each country has a designated National Authority (for Italy, ISPRA), responsible for developing the national CLC project.
For the years 2012 and 2015, Copernicus high-resolution land cover data (High Resolution Layers - HRL) were also available. These data, aimed at monitoring land cover in Europe concerning key environmental themes (soil sealing and built-up areas, forests, permanent grasslands, wetlands, and permanent water bodies), were integrated with the ISPRA/SNPA soil consumption map (2017) and CLC 2018 data (which refers to 2017 satellite imagery). This integration allowed for a new mapping of land use in Italy at a higher geometric resolution than CORINE (100 m² vs. 25 hectares).
The classification system included three primary-level classes (urban, agricultural, and natural) and six subcategories integrating artificial and non-artificial land cover (artificial in urban areas, non-artificial in urban areas, artificial in agricultural areas, non-artificial in agricultural areas, artificial in natural areas, and non-artificial in natural areas). This system is not directly comparable to CLC data, which, despite its limitations in spatial resolution, remains highly valuable in thematic resolution, offering a hierarchical system of 44 classes across three levels and providing a historical series, as the initiative began in 1985 at the European level.
To describe the type and extent of major human activities in the territory, enabling the identification of land use changes in agriculture and urban areas and the evolution of semi-natural land cover.
There are no specific targets in international and national regulations. However, European environmental action programs set general objectives for sustainable land use, nature protection, and biodiversity conservation. The European Commission has been working for years to promote more sustainable land and soil use.
The 2006 Thematic Strategy for Soil Protection emphasized the need to implement good practices to mitigate the negative effects of soil sealing on soil functions. This general goal was further detailed in 2011 with the Roadmap to a Resource-Efficient Europe, which proposed that by 2020, EU policies should consider their impact on land use, aiming for a net-zero land take by 2050.
The Proposal for a Directive on Soil Protection (COM/2006/232) and the Thematic Strategy on the Urban Environment (COM/2005/0718), later withdrawn, also identified soil sealing as a major issue. The EU has since developed policies and adopted legislative tools that impact land use and soil sealing.
In 2012, the European Commission published the report "Guidelines on Best Practices to Limit, Mitigate or Compensate Soil Sealing," which outlines good practices to reduce, mitigate, and compensate for soil sealing.
Panel 2
The main limitation of the indicator is related to the technique used for CORINE Land Cover mapping, where the minimum cartographic unit is 25 hectares for land cover and 5 hectares for land use changes.
Data quality assessment
ISPRA (Italian Institute for Environmental Protection and Research), SNPA (National System for Environmental Protection)
http://groupware.sinanet.isprambiente.it/uso-copertura-e-consumo-di-suolo/library/copertura-del-suolo/corine-land-cover
National
1990; 2000; 2006; 2012; 2018
Indicator assessment
For CORINE Land Cover 2018, information was obtained through high-resolution satellite image interpretation (Sentinel-2, 2017), stored in a 1:100,000-scale vector-based geographic database. The classification identifies 44 land use classes organized into three hierarchical levels (5 classes in the first level, 15 in the second, and 44 in the third).
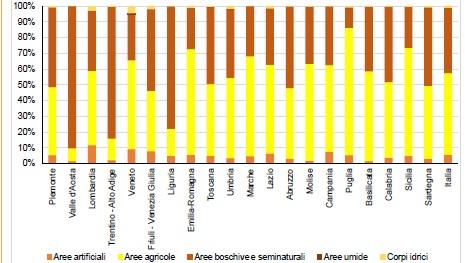
The regional summary of the indicator was developed using the five first-level CLC classes:
- Class 1: Artificial areas
- Class 2: Agricultural areas
- Class 3: Forest and semi-natural areas
- Class 4: Wetlands
- Class 5: Water bodies
For ISPRA land use mapping, the following datasets were used:
- CLC 2018 data, particularly for distinguishing agricultural areas, artificial areas, wetlands, and water bodies.
- High-Resolution Layers (HRL) for 2015, to better identify tree-covered surfaces, permanent water bodies, and wetlands.
- The 2017 National Soil consumption Map, to provide more detailed urban area classifications, distinguishing green urban spaces.
.
Between 2012 and 2018, at the national scale, there was a general increase in artificial areas, mainly at the expense of agricultural areas and, to a lesser extent, forest and semi-natural areas. In Italy, as in the rest of Europe, cultivated areas are declining due to both farmland abandonment and urbanization, while urban areas continue their expansion trend. Both processes were also observed during the 1990-2000 decade (see previous editions).
However, during 2000-2006, a trend reversal was noted for forest and semi-natural areas: after increasing by nearly 60,000 hectares in the last decade of the 20th century, these areas lost over 10,000 hectares in the cited period and another 6,600 hectares between 2006 and 2012 (see previous editions). This trend appears to have nearly halted when comparing CLC 2012 and CLC 2018, with only 386 hectares lost (Table 10.20).
Data
Table 4: Land use by first-level CLC classes (2012rev)
ISPRA/SNPA
Table 6: Differences in land use by first level CLC classes (2012 rev - 2018)
ISRPA/SNPA
Table 7: Predominant land use areas (hectares and percentage) in Italy in 2018, broken down by the three classes.
ISPRA


The construction of the indicator was based on data from the CORINE Land Cover project for the years 1990, 2000, 2006, 2012, and 2018, at a scale of 1:100,000, with a minimum cartographic unit of 25 hectares for land use maps (Tables 1, 2, 3, 4, and 5) and 5 hectares for land use changes (not reported in the tables). The land use change database is the primary product of the project, while the land cover/use database is derived from the intersection of the revised previous land cover (rev.) with land use changes.
The CLC 2018 data mainly come from photointerpretation of high-resolution satellite imagery (Sentinel 2017). These data are archived and stored in a Geographic Information System (GIS) using a classification system consisting of 44 land use classes (class 5.2.3 Seas and Oceans is not included in this indicator), divided into three hierarchical levels (5 classes at the first level, 15 at the second level, and 44 at the third level).
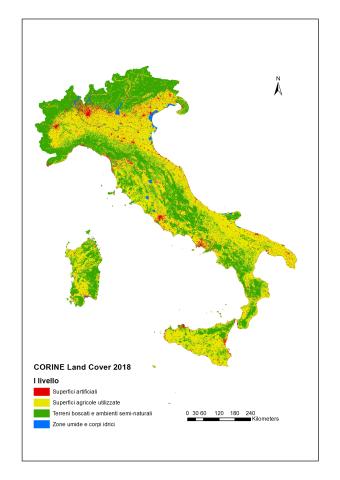
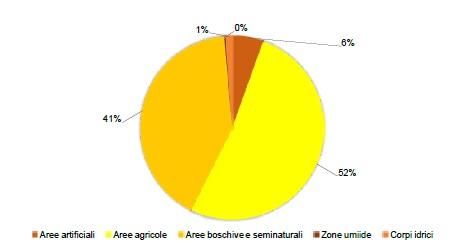
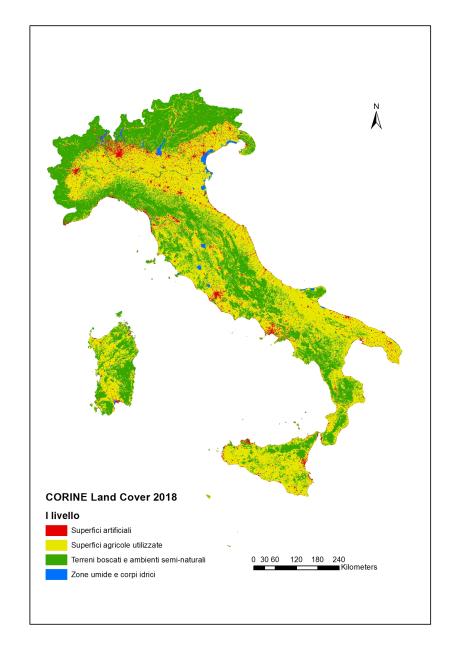
The national summary of the indicator was constructed using the five first-level CLC land cover classes (Figures 1, 2, and 3):
The most significant increases compared to 2012 concern artificial areas, with the largest growth recorded in Lombardy, Emilia-Romagna, and Veneto. Urbanization primarily occurs at the expense of agricultural areas, which continue to decline at a national average of nearly 1,500 hectares per year, with the Po Valley regions experiencing the most significant losses (Table 6).
According to ISPRA land use mapping, agricultural land represents the largest area (15,509,775 hectares), followed by natural areas (12,975,448 hectares) and urban areas (1,654,502 hectares). This highlights Italy’s agricultural vocation and the vast extent of natural areas, especially in the Alpine and Apennine mountain regions (Table 7).
The percentage change between 2012 and 2018 indicates a 0.17% loss of agricultural areas, with a 0.67% increase in urban areas and a 0.12% increase in natural areas (Table 7).