Marco d'Antona, Marco Di Leginio, Valentina Falanga
Legislative Decree No. 42/2004 (the Urbani Code) is the main regulatory reference for the protection, conservation, and enhancement of cultural heritage (cultural assets and landscape).
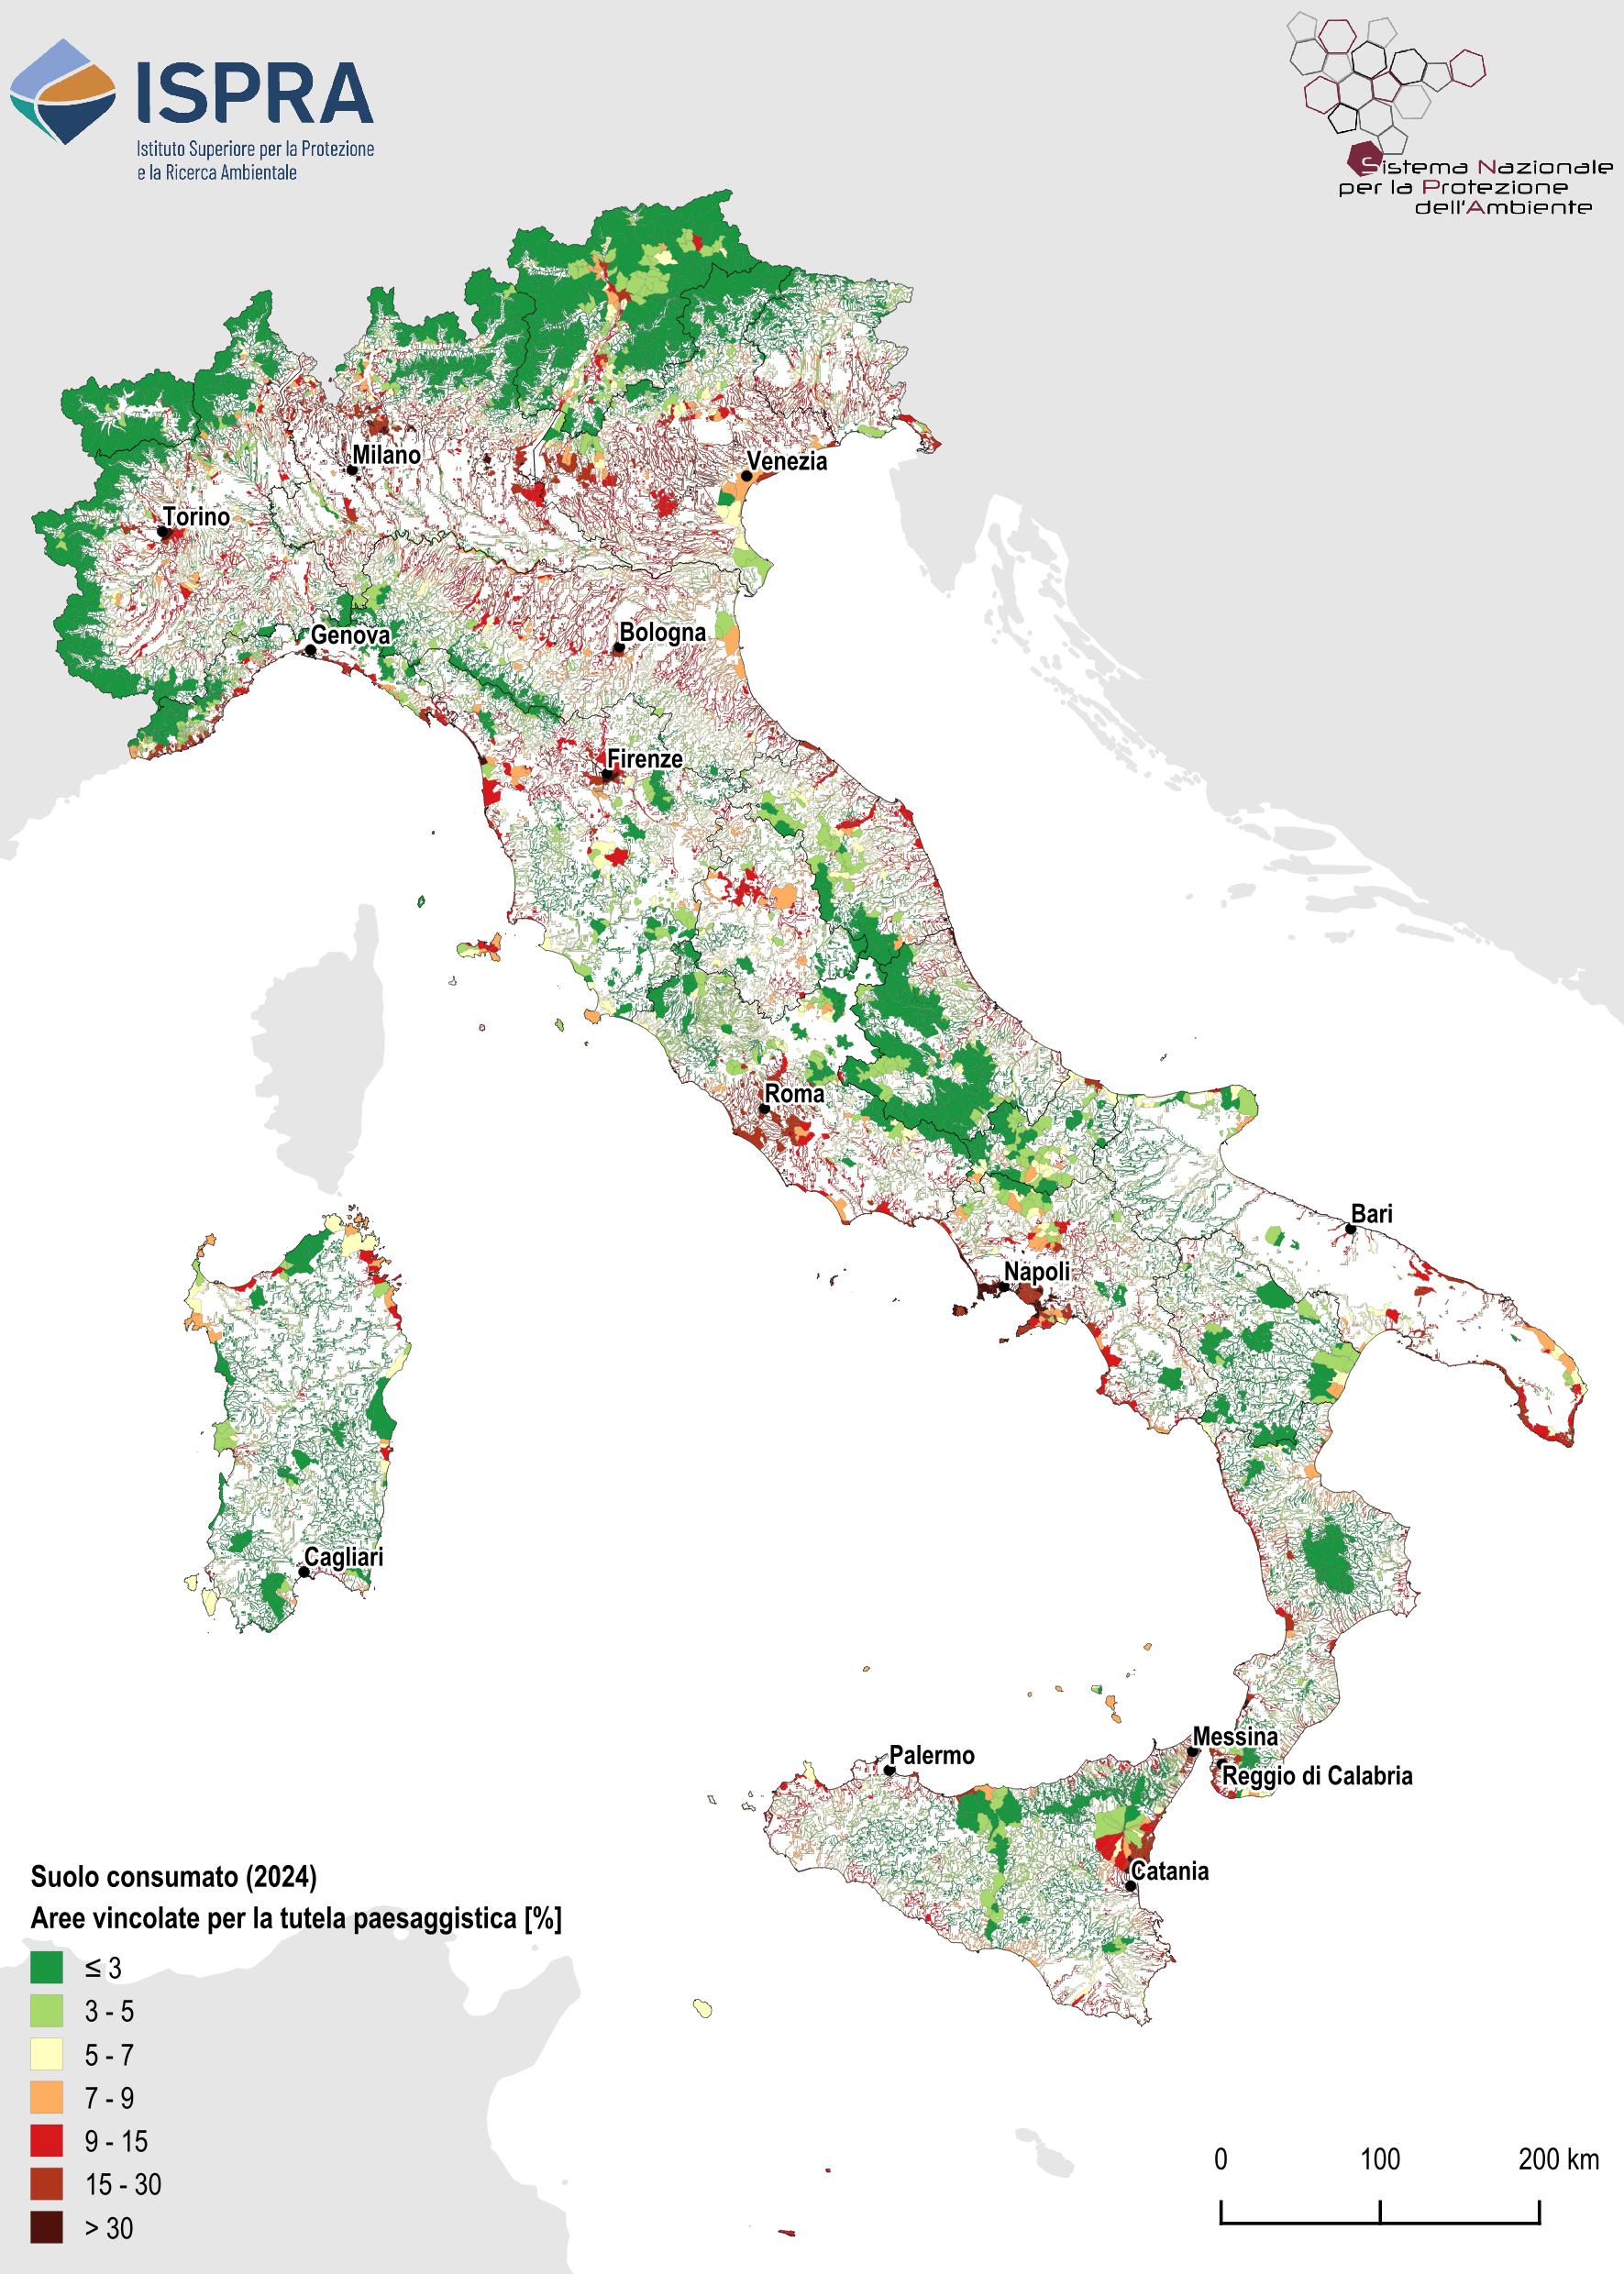
As of 2024, protected areas show a percentage of consumed land lower than the national average (5.42%), with an increase in the last year of just over 1,520 hectares. Campania is the region with the highest percentage of land consumption within protected areas (11.05%).
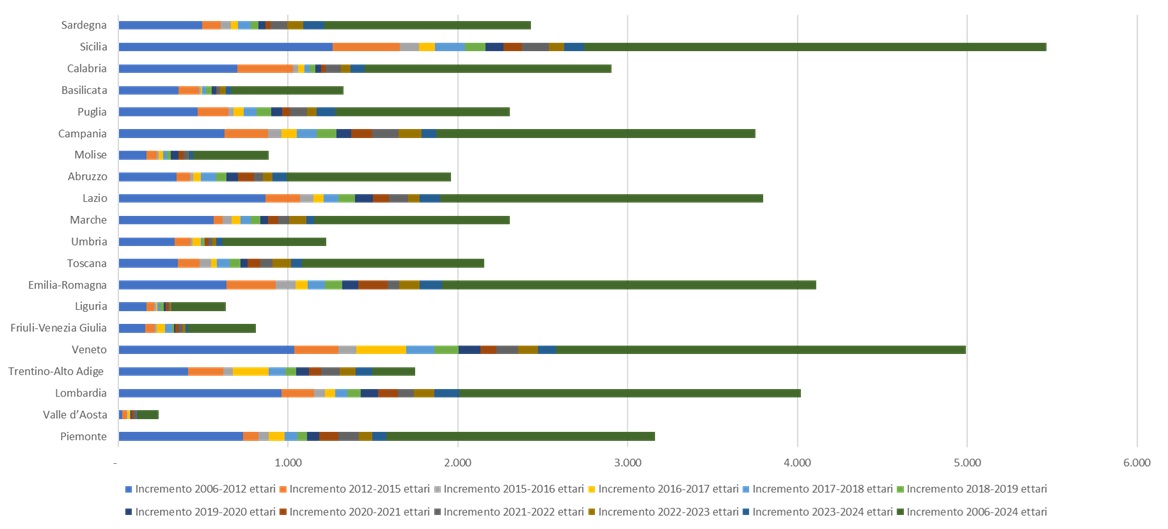
The largest increase in land consumption occurred in Lombardy (+146.11 hectares), followed by Emilia-Romagna (+131.43 hectares), Sardinia (+123.46 hectares), and Lazio (+121.08 hectares).
The highest land consumption density is recorded in Apulia (3.61 m²/ha).
Soil consumption changes were analyzed within the following legally protected areas, limited to spatially defined assets (source: Environmental and Landscape Territorial Information System - SITAP), as defined in D.Lgs. 42/2004 (Codice Urbani):
- Article 142, Paragraph 1:
- (a) Coastal territories within 300 meters from the shoreline, including elevated lands (coasts).
- (b) Territories adjacent to lakes within 300 meters from the shoreline, including elevated lands (lakes).
- (c) Rivers, streams, and watercourses listed under the unified law on water and electrical installations (Regio Decreto No. 1775 of December 11, 1933), including their banks or embankments within 150 meters each (rivers).
- (d) Mountains above 1,600 meters above sea level in the Alps and 1,200 meters in the Apennines and islands (mountains).
- (l) Volcanic areas (volcanoes).
- Article 136: Properties and areas of significant public interest (ope legis).
To assess soil consumption changes in protected areas under D.Lgs. 42/2004 (Codice Urbani) between two consecutive years.
For areas subject to protection constraints, the reference framework is Legislative Decree No. 42/2004 (Urbani Code). Actions concerning land, land take, and territory are a global priority and are included in the 2030 Agenda through several Sustainable Development Goals. In particular, target 11.3 aims to promote inclusive urbanization by introducing indicators to monitor land consumption in relation to population growth, thereby supporting sustainable urban planning, more resilient cities, and improved access to green spaces.
The EU Soil Strategy (2021) establishes a framework for healthy soils by 2050, with intermediate targets for 2030, and introduces the “land take hierarchy”, which sets the following priority order:
- avoid land take and soil sealing;
- reuse already sealed land;
- use degraded land only if unavoidable;
- mitigate and compensate for losses of ecosystem services.
The EU Directive on Soil Monitoring and Resilience (Soil Monitoring Law), approved on 23 October 2025, establishes a harmonized framework for assessing soil health across the EU, defining common indicators and standardized methodologies for monitoring, sustainable management, and contamination prevention, with the objective of achieving healthy and resilient soils by 2050.
The directive introduces the definitions of sealed soils (“soil surface that has been subject to sealing”) and soil removal (“temporary or long-term, total or partial removal of soil in an area”) and requires Member States to monitor their evolution at least every three years. With regard to land take mitigation principles, the directive provides that, in the case of new soil sealing or soil removal, losses in the soil’s capacity to deliver ecosystem services should be avoided or minimized as much as possible and, where feasible, compensated, while promoting the restoration of already sealed soils and the rehabilitation of removed areas.
Overall, EU legislation emphasizes the protection of soil ecological functions and encourages de-sealing interventions and the restoration of areas affected by soil removal.
On 18 August 2024, the Nature Restoration Law entered into force, adopted through Regulation (EU) 2024/1991 of the European Parliament and of the Council of 24 June 2024. Its main objective is to halt and reverse biodiversity loss in the EU, achieve climate neutrality by 2050, adapt to climate change, and improve food security. The Regulation establishes specific obligations for different ecosystem types, including agricultural land, forests, and urban ecosystems, and—together with the objectives of the EU Biodiversity Strategy for 2030—creates a framework within which Member States implement effective restoration measures aimed at:
- restoring 20% of degraded ecosystems by 2030 and all ecosystems in need of restoration by 2050;
- restoring at least 30% of terrestrial, coastal, freshwater, and marine ecosystems that are not in good condition by 2030, with particular attention to protected habitats and Natura 2000 sites;
- removing artificial barriers to restore at least 25,000 km of free-flowing rivers;
- planting at least three billion trees by 2030 to enhance biodiversity and urban ecosystems.
Munafò, M. (ed.), 2025. Land consumption, territorial dynamics and ecosystem services. 2025 edition. SNPA environmental reports, 46/2025
Difficulties in the availability of very high-resolution imagery for certain areas.
The availability of very high resolution images is preparatory to perfecting the quality of the indicator, making estimates within the areas subject to restrictions more homogeneous and precise.
http://groupware. sinanet. isprambiente. it/uso-copertura-e-consumo-di-suolo/library/consumo-di-suolo www. sitap. beniculturali. it
National, Regional
2006; 2012; 2015-2024
The indicator is derived from the overlay of the land consumption change map with protected assets, limited to area-based constraints. Specifically, the indicator considers areas subject to protection under Legislative Decree No. 42/2004 (Urbani Code), Articles 136 and 142, as recorded in the SITAP database (Environmental and Landscape Territorial Information System of the Directorate-General for Landscape, Fine Arts, Architecture and Contemporary Art of the Ministry of Culture).
Within these areas, the portion affected by land consumption was assessed using the National Land Consumption Map produced by the National System for Environmental Protection (SNPA). By comparing 2024 data with revised data for previous years, new land consumption affecting protected areas was estimated for the last year (between 2023 and 2024) and for other time intervals considered (2006, 2012, 2015–2024).
The availability of new satellite data made it possible to refine and improve estimates for the entire historical time series. Results are expressed in hectares and percentages, referring to the 20 administrative regions and the national territory.
Within protected areas, during 2024, the increase in consumed land amounted to 1,521 hectares (Table 1), raising the total national value of consumed land to approximately 560,866 hectares, equal to 5.4% of the total area of these protected zones (Figure 1). This percentage is significantly lower than the national average (7.17%; see Table 1, indicator “Soil Sealing and Land Consumption”), mainly due to the protection regime that ensures greater preservation compared to the rest of the national territory.
| Data |
|---|
Headline
Table 1: Soil consumed (2024) and net soil consumption (2023-2024) in the constraints art. 136 and art. 142 considered overall Data source
ISPRA processing on SNPA and SITAP cartography |
Headline
Table 2: Net annual soil consumption (2006–2024) in areas subject to constraints under Articles 136 and 142, considered jointly Data source
ISPRA processing on SNPA and SITAP cartography |
Headline
Table 3: Consumed soil (2024) and net annual soil consumption (2023–2024) in areas subject to landscape protection constraints – Coasts, lakes and rivers (former Legislative Decree 42/2004). Data source
ISPRA processing on SNPA and SITAP cartography |
Headline
Table 4: Consumed soil (2024) and annual soil consumption (2023–2024) in areas subject to landscape protection constraints – Mountains (former Legislative Decree 42/2004). Data source
ISPRA processing on SNPA and SITAP cartography |
Headline
Table 5: Consumed soil (2024) and annual soil consumption (2023–2024) in areas subject to landscape protection constraints – Volcanoes (former Legislative Decree 42/2004). Data source
ISPRA processing on SNPA and SITAP cartography |
Headline
Table 6: Consumed soil (2024) and annual soil consumption (2023–2024) in areas subject to landscape protection constraints (former Legislative Decree 42/2004 – Article 136). Data source
ISPRA processing based on SNPA and SITAP cartography |
Thumbnail
Headline
Figure 1: Soil consumption in legally protected areas Data source
ISPRA processing on SNPA and SITAP cartography |
Thumbnail
Headline
Figure 2: Net land soil consumption in Italy (2006–2024): Annual increases and regional variations Data source
ISPRA processing on SNPA and SITAP cartography |
Legislative Decree No. 42/2004 (Urbani Code) is the main regulatory reference for the protection, conservation, and enhancement of cultural heritage (cultural assets and landscape). Land consumption and its changes were therefore analyzed within protected assets, limited to area-based constraints, as defined by Article 142(1)(a), (b), (c), (d), (i), and Article 136 (Figure 1).
Considering all the protection regimes analyzed, the regions with the greatest increase in consumed land area are Lombardy (146 hectares), Emilia-Romagna (132 hectares), followed by Sardinia (124 hectares). These four regions account for about one third of the total national land consumption within these areas, equal to 1,521 hectares (Table 1).
From 2006 to 2024, more than 24,400 hectares were consumed in these areas, with over 2,000 hectares concentrated in three regions (Lombardy, Veneto, and Emilia-Romagna – Table 2).
The protection regime under Article 142(1)(a), (b), and (c) (coasts, lakes, rivers) shows consumed land equal to 7.4% of its total extent (Table 3), in line with the national average (7.1%). Regions with the highest percentage of consumed land in these protected areas are Veneto, Campania, and Lombardy (12.4%, 11.1%, and 10.9%, respectively).
Land consumption within mountainous areas (Article 142(d)) is influenced by the orographic characteristics of the territory, with values reaching 1% of their extent only in two cases (Tuscany and Calabria). The region with the highest land consumption in these areas between 2023 and 2024 is Lombardy, with 16.7 hectares (Table 4).
With regard to volcanic areas (Article 142(l)), the percentage of consumed land is mainly attributable to Campania, where volcanic areas are artificially covered over 27.5% of their total extent. Sicily is also noteworthy, with consumed land values of 12% and an increase of 27 hectares between 2022 and 2023 (Table 5).
Finally, the protection regime under Article 136 shows consumed land values of about 5.3% of the protected territory. Calabria has the highest percentage of consumed land (13.8%), while in terms of increases between 2023 and 2024, the regions with the highest values are Apulia and Sardinia (92 hectares), followed by Trentino–Alto Adige (84 hectares). The lowest values are recorded in Valle d’Aosta (3 hectares), followed by Liguria and Friuli–Venezia Giulia, both with 2 hectares (Table 6).