Luca Congedo, Ines Marinosci, Michele Munafò, Andrea Strollo
The indicator quantifies soil consumed as a result of a change from a non-artificial soil cover to an artificial soil cover, according to the principle of net land take, i.e. net of transformations from consumed soil back to non-consumed soil (generally the restoration of construction sites and other areas that in the previous year fell under reversible soil consumption).
Gross soil consumption recorded in 2024 affected 8,370 hectares of territory, causing the often irreversible loss of natural, semi-natural, and agricultural areas and their related ecosystem services.
Soil consumption is a phenomenon associated with the loss of a fundamental environmental resource, due to the occupation of an area originally agricultural, natural, or semi-natural. It refers to an increase in artificial soil cover, linked to settlement and infrastructure dynamics. It is a process mainly driven by the construction of new buildings and settlements, urban expansion, densification or conversion of soil within urban areas, and the development of infrastructure.
Soil consumption can therefore be defined as a change from non-artificial soil cover (non-consumed soil) to artificial soil cover (consumed soil).
Net soil take is the balance between soil consumption and the increase in agricultural, natural, and semi-natural surfaces resulting from recovery measures, demolition, de-sealing, renaturalisation, or other actions (European Commission, 2012).
A new classification system was subsequently introduced, dividing changes into two main categories (permanent and reversible), which constitute the second level of classification, consistent with the definitions adopted in the new directive (respectively “soil sealing” and “soil removal”). Where possible, depending on the availability of ultra-high-resolution imagery, land is classified at a third level according to the following system:
- Permanent soil consumption: buildings and structures; paved roads; railway track; airports (runways and impermeable/paved manoeuvring areas); ports (quays and impermeable/paved manoeuvring areas); other impermeable/paved non-built-up areas (yards, parking areas, courtyards, sports fields); permanently paved greenhouses; landfills;
- Reversible soil consumption: unpaved roads; construction sites and other compacted-earth areas (yards, parking areas, courtyards, sports fields, permanent material storage areas); non-renaturalised extraction areas; quarries below the water table; ground-mounted photovoltaic plants; other artificial covers whose removal restores the original soil conditions.
To assess soil consumption at national, regional, provincial, and municipal level.
Actions for soil and land are a global priority and are included in the 2030 Agenda through several Sustainable Development Goals. In particular, target 11.3 aims to promote inclusive urbanisation by introducing indicators to monitor land consumption in relation to population growth, thereby supporting sustainable urban planning, more resilient cities, and improved access to green spaces.
The EU Soil Strategy (2021) provides a framework for healthy soils by 2050, with intermediate targets for 2030, and introduces the “land take hierarchy”, establishing the following priority order:
- avoid land take and soil sealing;
- reuse already sealed land;
- use degraded land only if unavoidable;
- mitigate and compensate for losses of ecosystem services.
The EU Directive on Soil Monitoring and Resilience (Soil Monitoring Law), approved on 23 October 2025, establishes a harmonised framework for assessing soil health across the EU, defining common indicators and standardised methodologies for monitoring, sustainable management, and contamination prevention, with the objective of achieving healthy and resilient soils by 2050.
The directive introduces the definitions of sealed soils (“soil surface that has been subject to sealing”) and soil removal (“temporary or long-term, total or partial removal of soil in an area”) and requires Member States to monitor their evolution at least every three years. With regard to land take mitigation principles, the directive provides that, in the case of new soil sealing or soil removal, losses in the soil’s capacity to deliver ecosystem services should be avoided or minimised as much as possible and, where feasible, compensated, while promoting the restoration of already sealed soils and the rehabilitation of removed areas. In short, EU legislation emphasises the protection of soil ecological functions and encourages de-sealing interventions and the restoration of areas affected by soil removal.
On 18 August 2024, the Nature Restoration Law entered into force, adopted through Regulation (EU) 2024/1991 of the European Parliament and of the Council of 24 June 2024. Its main objective is to halt and reverse biodiversity loss in the EU, achieve climate neutrality by 2050, adapt to climate change, and improve food security. The Regulation establishes specific obligations for different ecosystem types, including agricultural land, forests, and urban ecosystems, and—together with the objectives of the EU Biodiversity Strategy for 2030—creates a framework within which Member States implement effective restoration measures aimed at:
- restoring 20% of degraded ecosystems by 2030 and all ecosystems in need of restoration by 2050;
- restoring at least 30% of terrestrial, coastal, freshwater, and marine ecosystems that are not in good condition by 2030, with particular attention to protected habitats and Natura 2000 areas;
- removing artificial barriers to restore at least 25,000 km of free-flowing rivers;
- planting at least three billion trees by 2030 to enhance biodiversity and urban ecosystems.
Pending national transposition of the new EU Soil Monitoring and Resilience Directive, at regional level various regulations have been adopted that set objectives for the progressive containment of land consumption and the regeneration of already built-up areas.
Munafò, M. (ed.), 2025. Land consumption, territorial dynamics and ecosystem services. 2025 edition. SNPA environmental reports, 46/2025
Difficulty in obtaining ultra-high-resolution imagery for some areas.
The availability of ultra-high-resolution imagery is a prerequisite for improving the quality of the indicator, making estimates at national, regional, provincial, and municipal level more homogeneous and accurate.
ISPRA
SNPA (National System for Environmental Protection)
National; Regional
2006;2012;2015-2024
Annual processing follows a consistent methodology including the following steps:
- acquisition of input data (Sentinel-1 and Sentinel-2 imagery, other available satellite images, ancillary data);
- data preprocessing;
- semi-automatic classification of the complete time series for the current year and the previous year (Sentinel-1 and Sentinel-2);
- production of a preliminary map;
- complete multi-temporal photo-interpretation of the entire territory and editing at a detailed scale (≥ 1:5,000);
- revision of the previous year with correction of potential omission/commission errors;
- rasterisation;
- validation;
- national mosaicking and reprojection into an equal-area system;
- processing and delivery of data and indicators.
In 2024, new artificial soil covers affected a further 8,370 hectares (Table 2), with a net soil consumption of 7,850 hectares (Table 1), i.e. on average almost 23 hectares per day, 15.6% more than the previous year. This represents a sharp acceleration compared with last year’s value and remains well above the average of the previous period (2012–2023), equal to 18.9 hectares per day. Over the last year, Italy lost soil at a rate of 2.7 square metres per second.
Even though there is not yet a national law transposing the recently approved EU directive, the country is still far from the “zero net land take” objective set by the Eighth Environment Action Programme.
From 2006 to 2024, soil consumption increased by almost 133,000 hectares, with nearly 40% concentrated mainly in northern regions, in particular Lombardy, Veneto, Emilia-Romagna, and Piedmont (Table 3).
| Data |
|---|
Headline
Table 1: Estimate of consumed soil, net soil consumption, and soil consumption density at regional level and by geographical breakdown Data source
ISPRA processing on SNPA cartography Note
The variation with respect to the 2023 data is due exclusively to revisions applied to the penultimate monitoring year. |
Headline
Table 2: Types of soil consumption (second-level classification) Data source
ISPRA processing on SNPA cartography Note
The variation with respect to the 2023 data is due exclusively to revisions applied to the penultimate monitoring year. |
Headline
Table 3: Variation in consumed soil from 2006 to 2024 at regional level and by geographical breakdown Data source
ISPRA processing on SNPA cartography Note
The variation with respect to the 2023 data is due exclusively to revisions applied to the penultimate monitoring year. |
File
Headline
Table 4: Variation in soil consumption in relation to population change Data source
ISPRA processing on SNPA cartography Data legend
* = Semilogarithmic ratio between the rate of change in soil consumption and the rate of change in population |
Thumbnail
Titolo
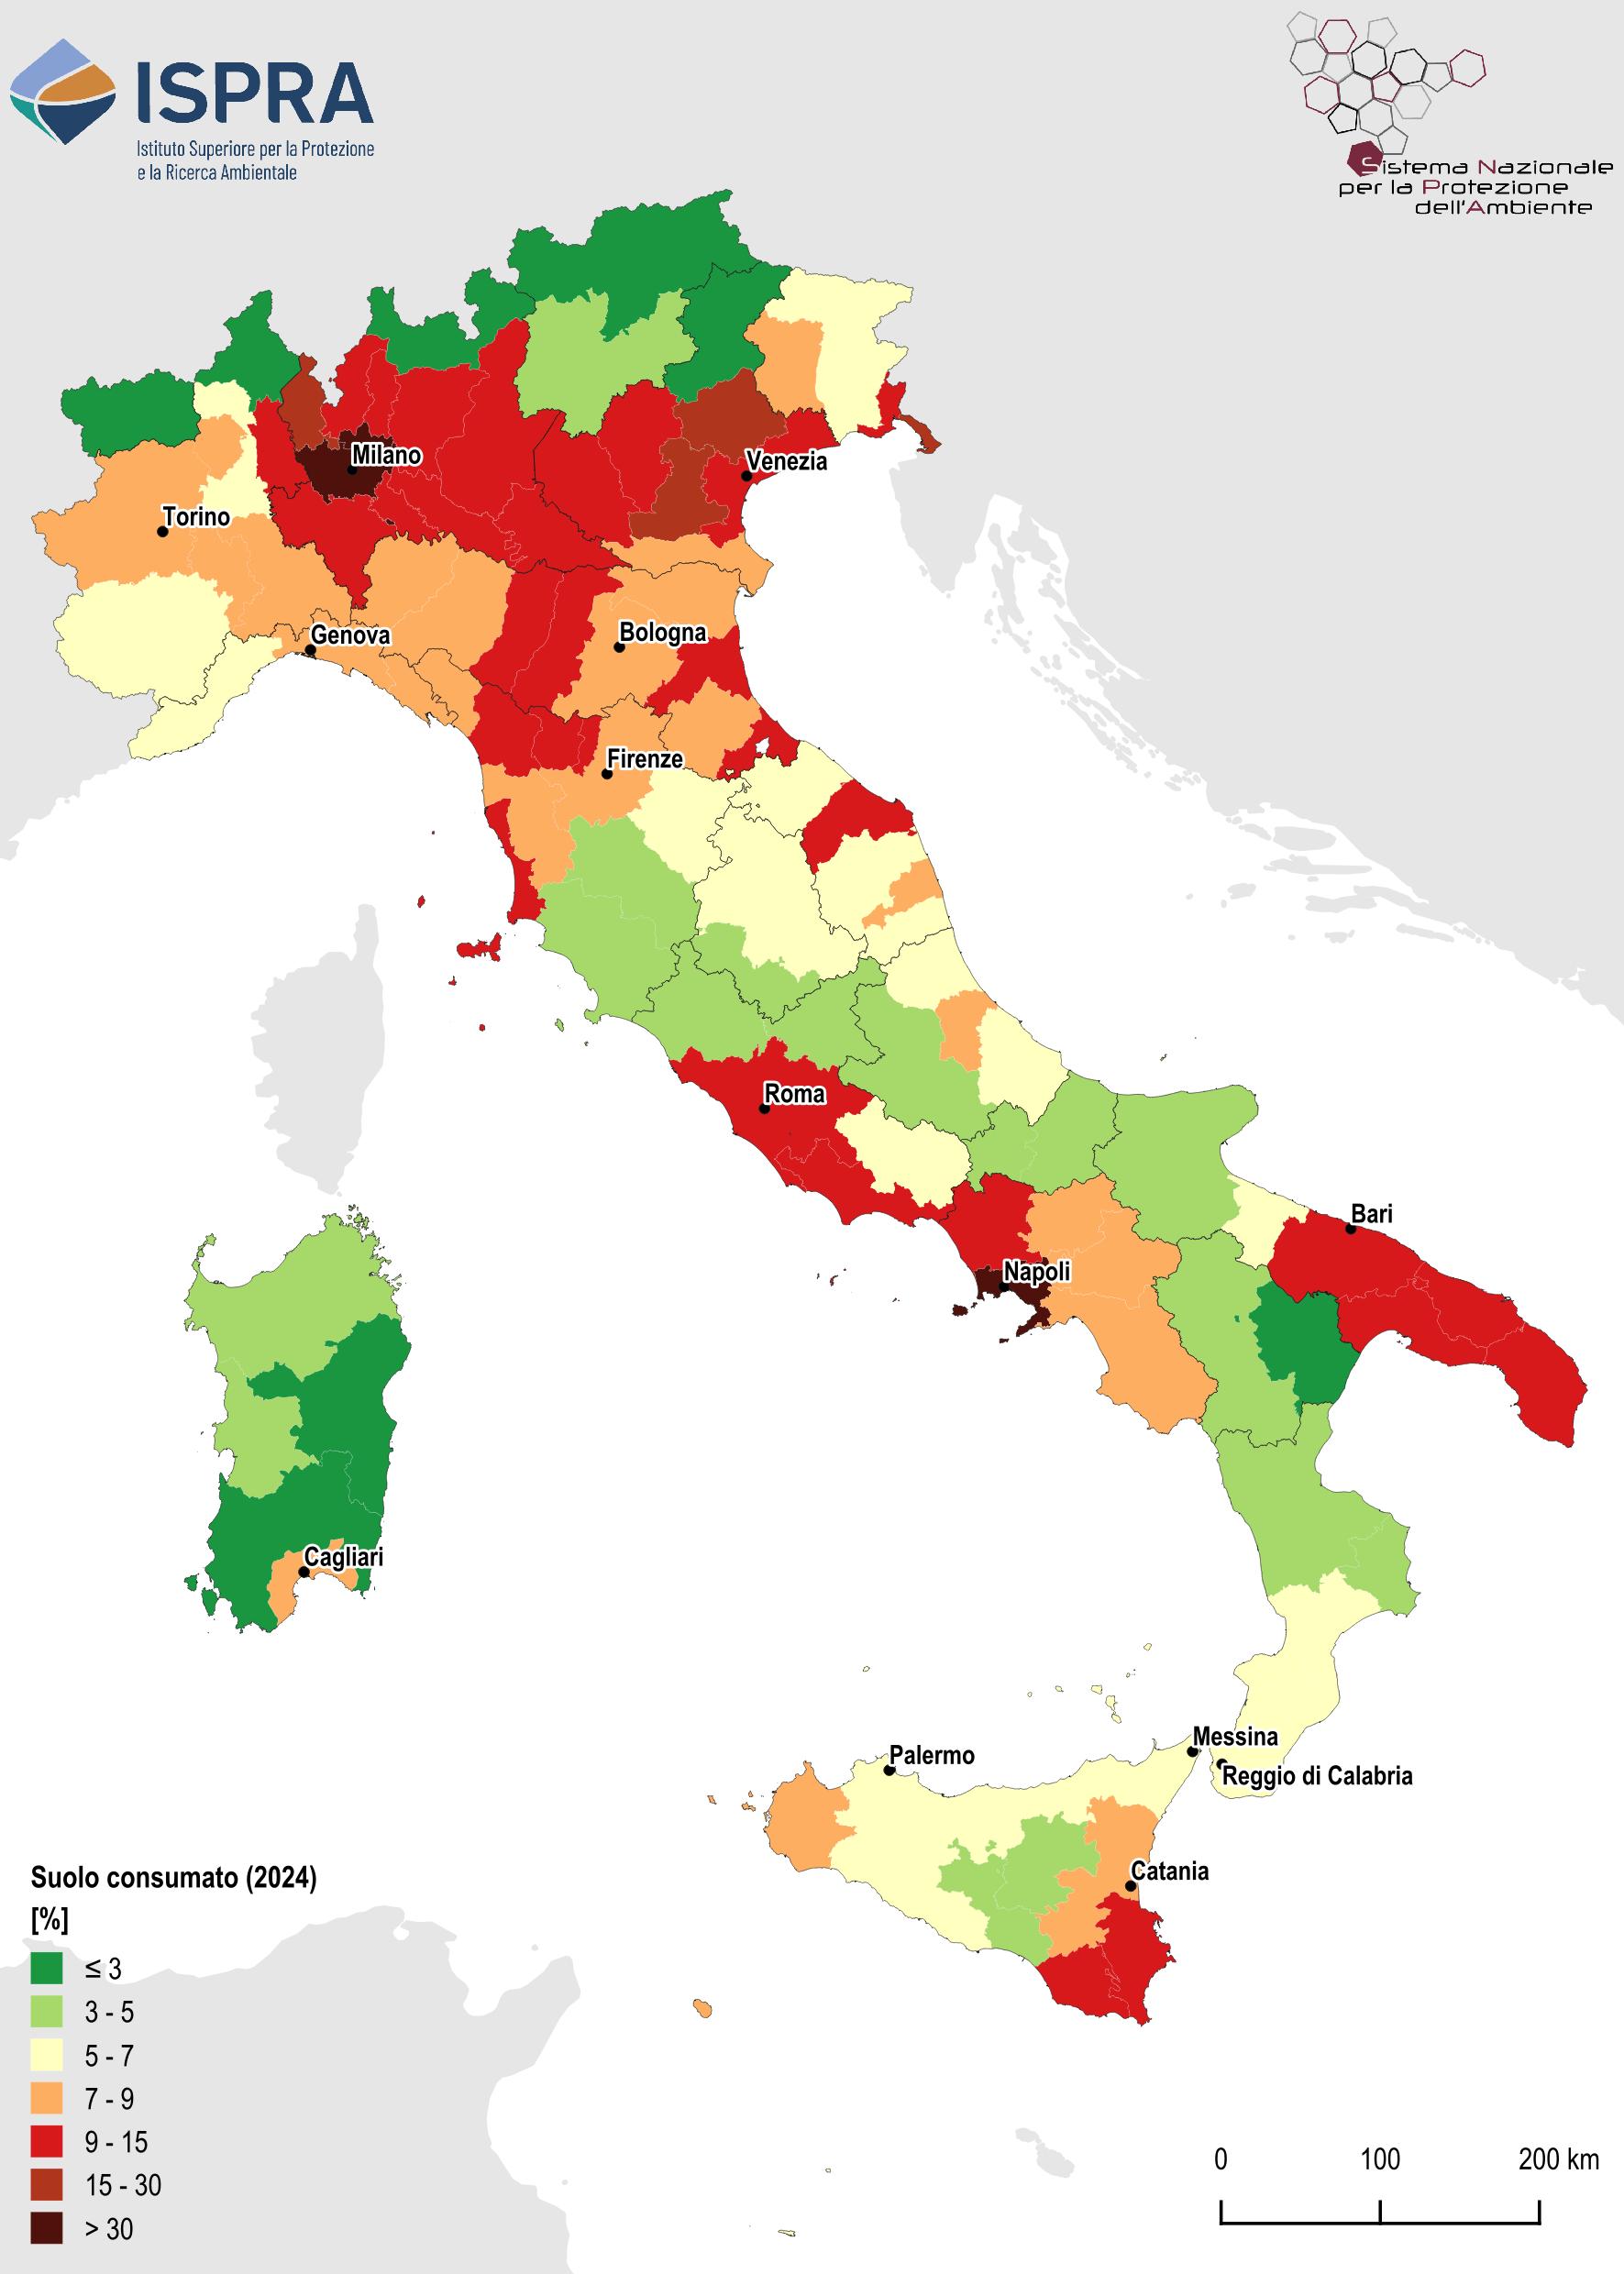
Figure 1: Consumed soil at provincial level Fonte
ISPRA |
Thumbnail
Titolo
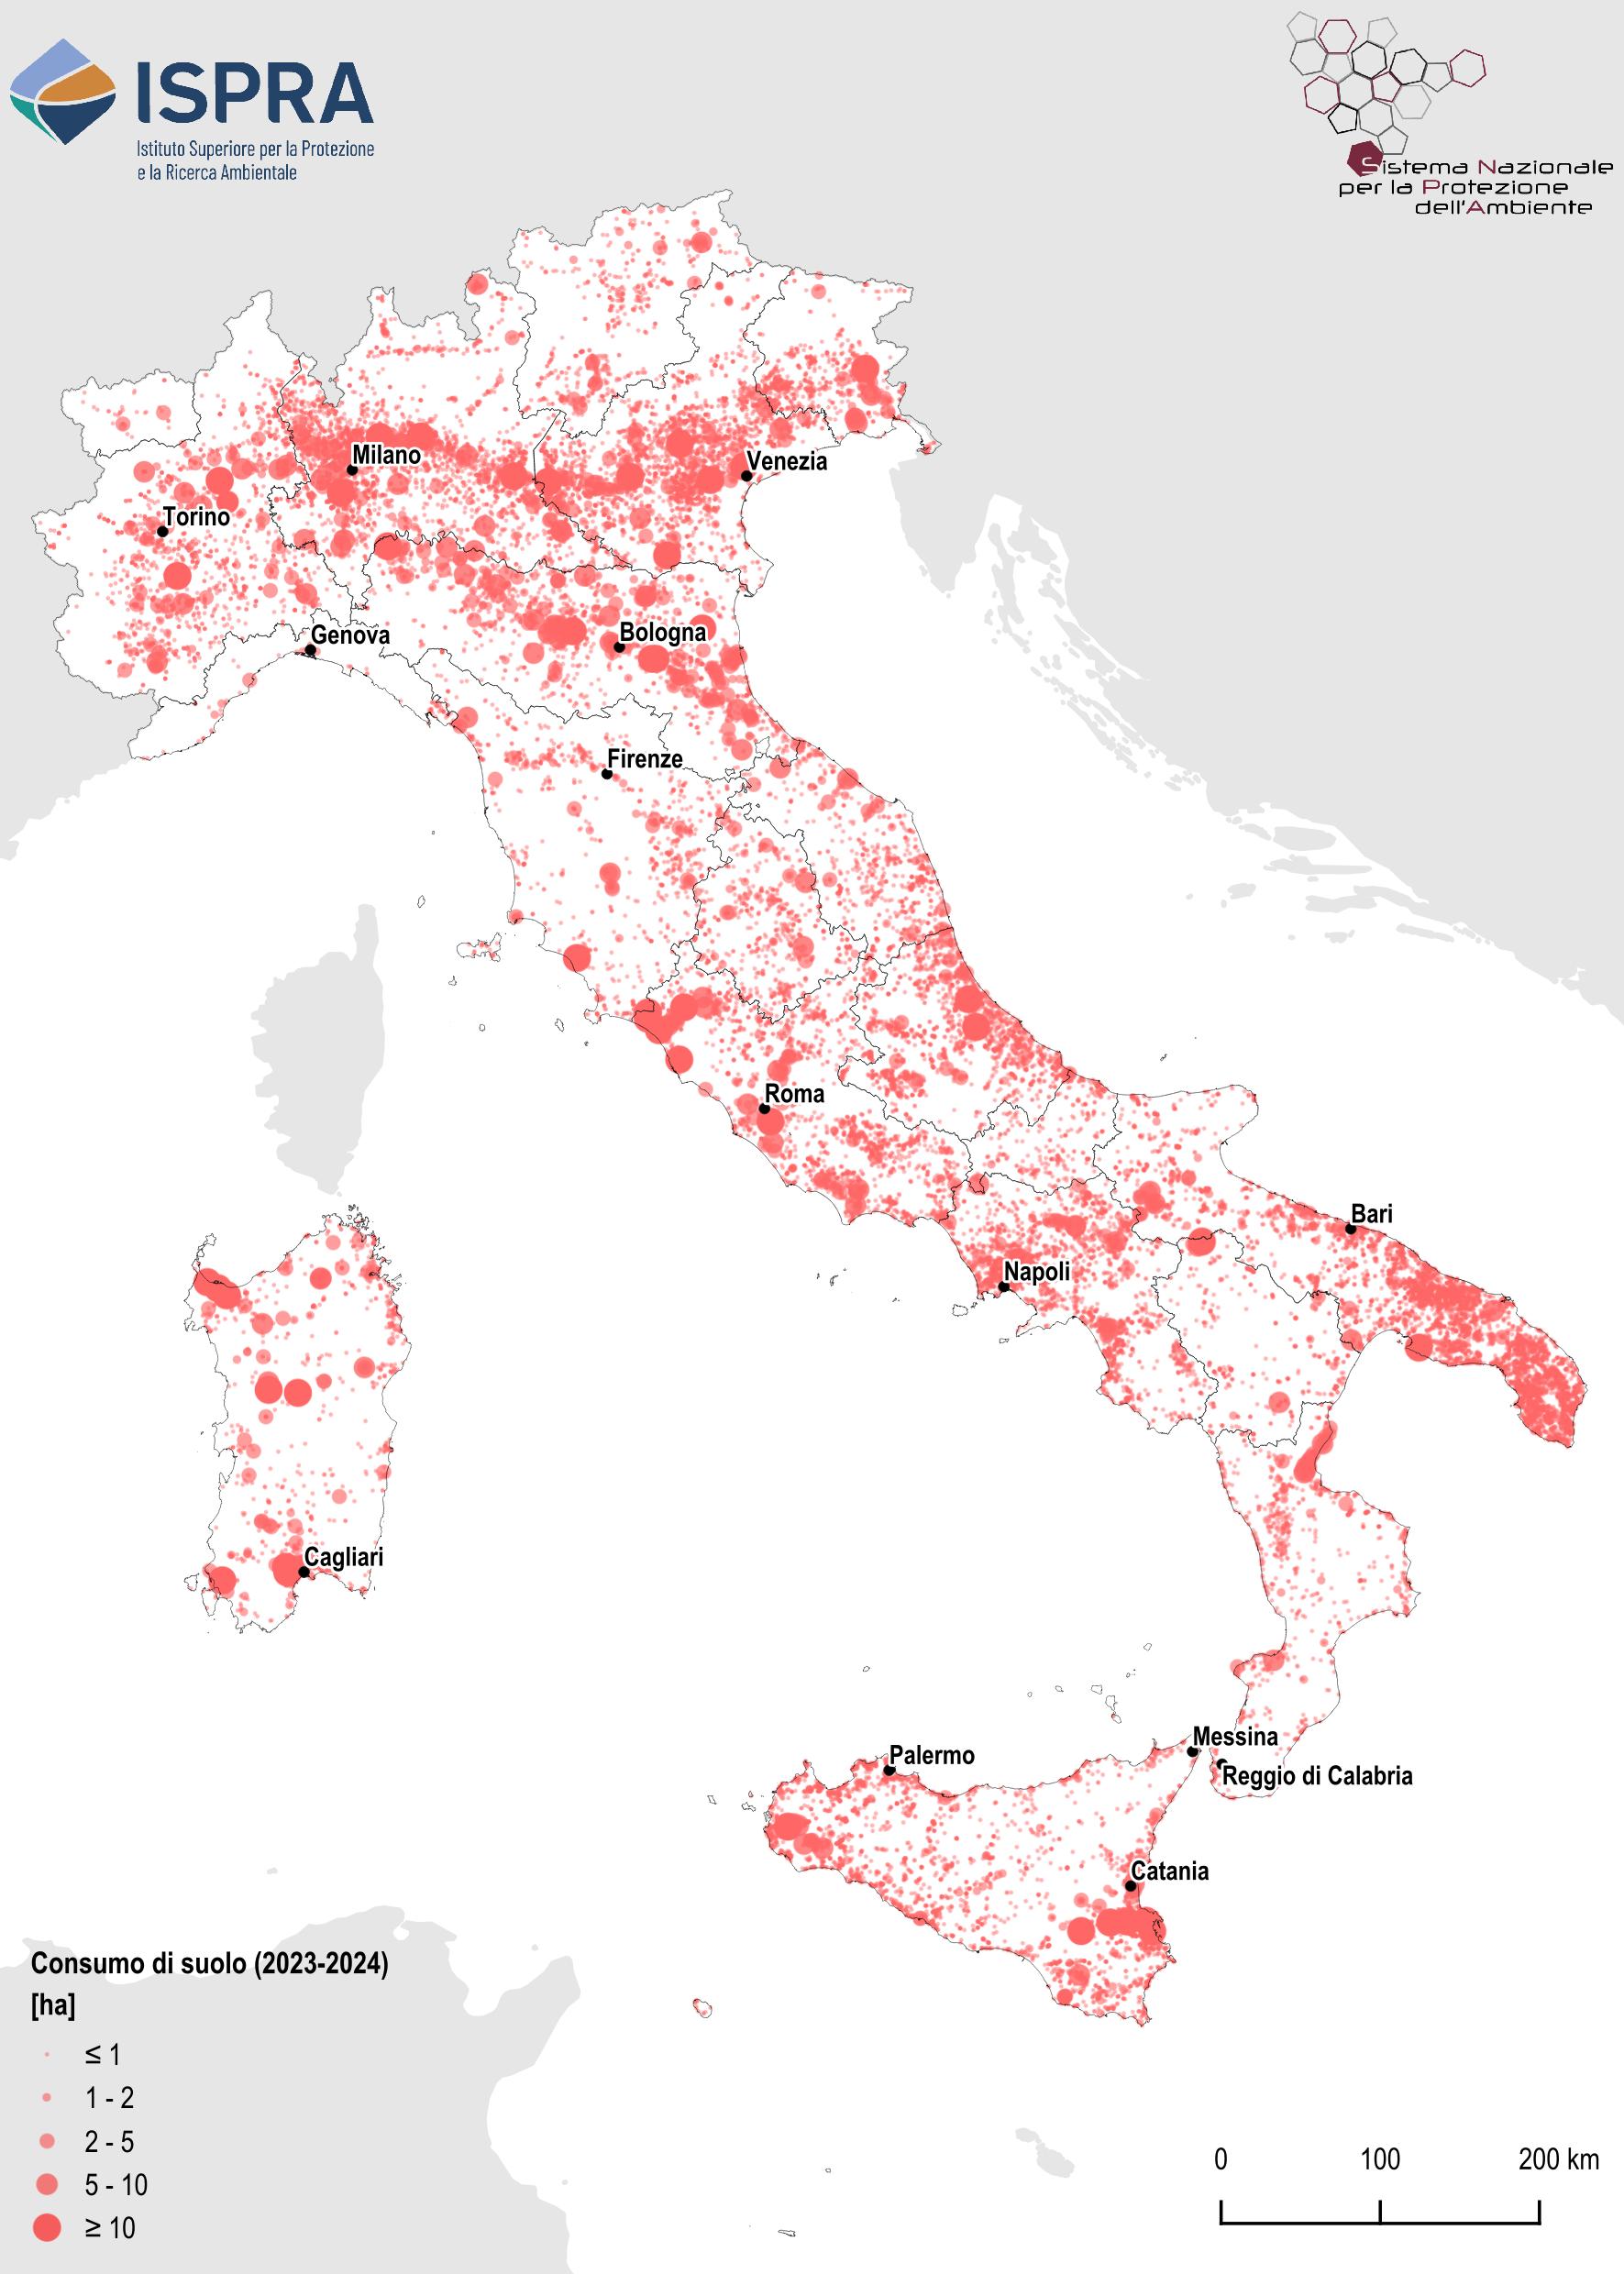
Figure 2: Spatial distribution of soil consumption, 2022–2023 Fonte
ISPRA |
Thumbnail
Titolo
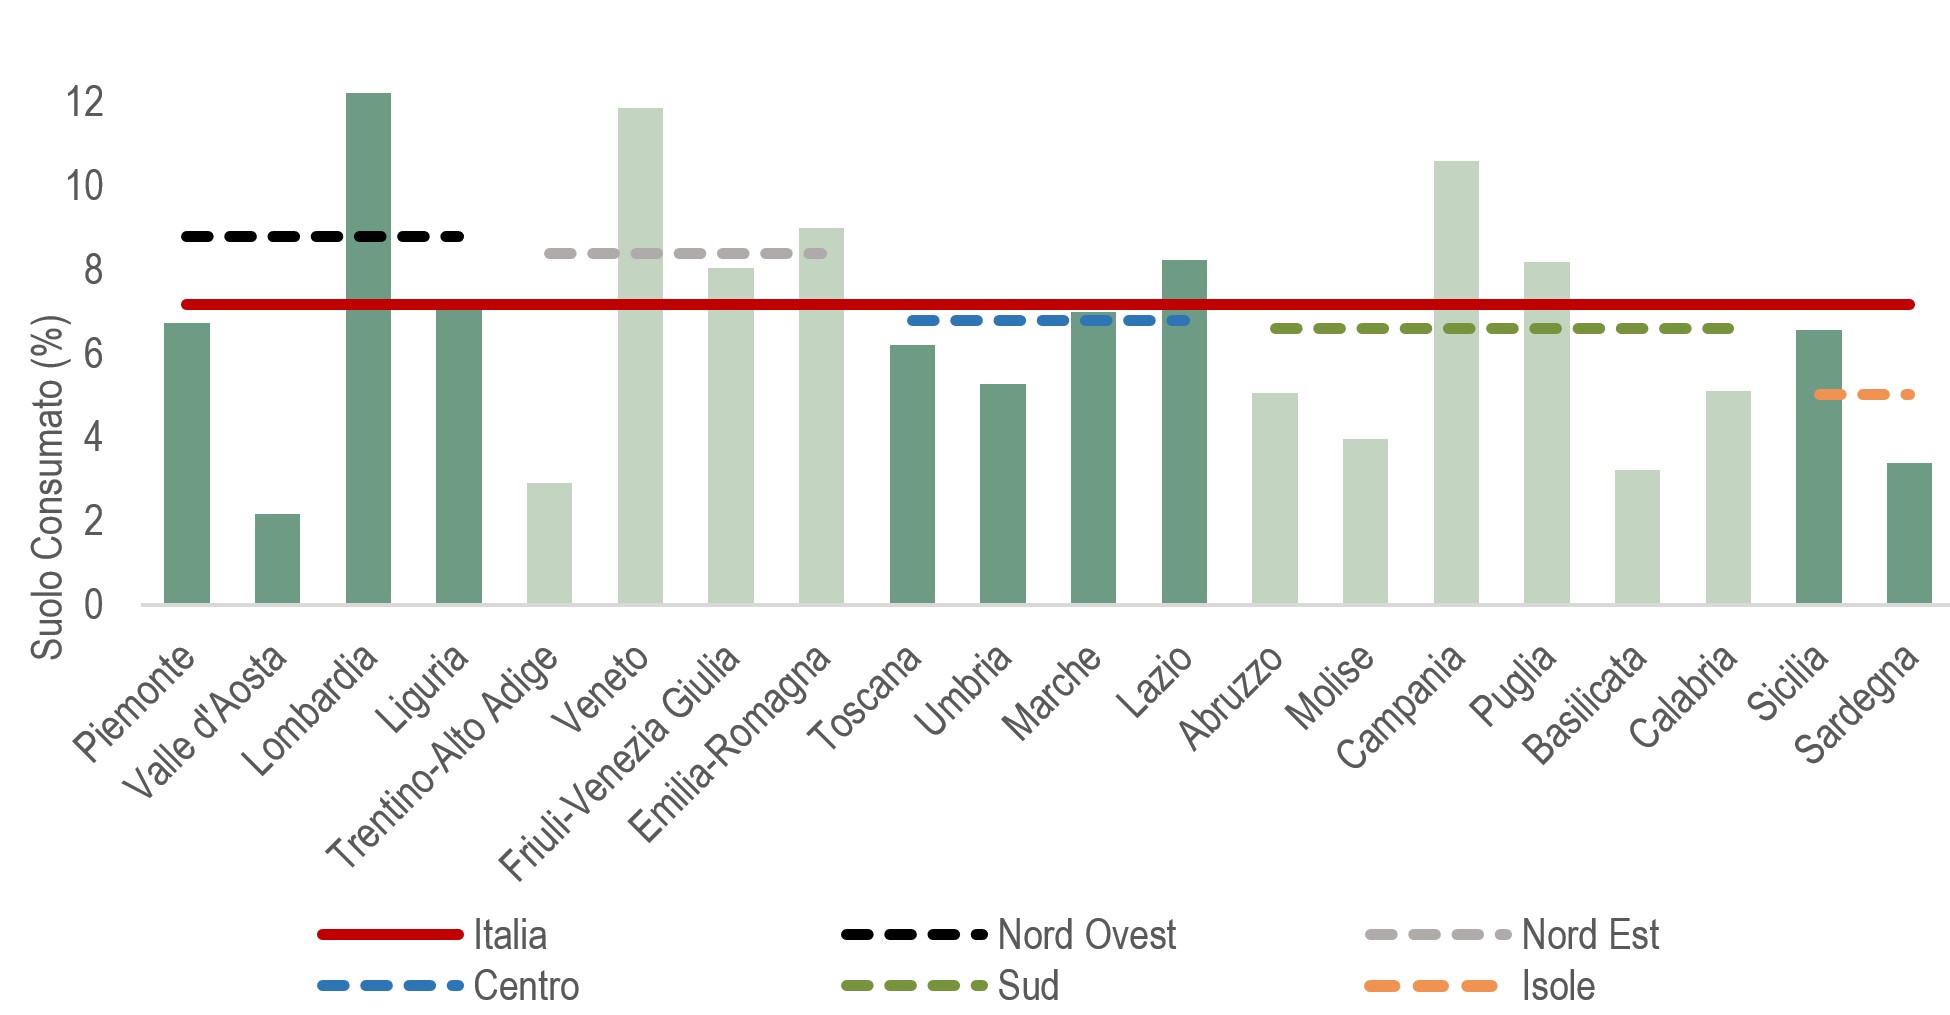
Figure 3: Consumed soil at regional level and by geographical breakdown (% 2023) Fonte
ISPRA |
In absolute terms, about 21,775 km² of soil are now irreversibly lost in Italy. Considering Italy’s geographical macro-areas, the highest percentages are recorded in the North: many provinces overlooking the Po Plain have already exceeded 10% of sealed surface (Figure 1), with a marked increase (in hectares consumed between 2023 and 2024) recorded especially in the Veneto and Lombardy plains, in Piedmont, and in Apulia (Figure 2). The comparison among macro-areas (Figure 3) confirms the highest values of consumed soil for the two northern macro-areas, which are also the only ones above the national value.
Lombardy also ranks first in absolute terms, with over 290,000 hectares of its territory artificially covered, compared with just 7,050 hectares in Valle d’Aosta (Table 3).
In 2024, in 15 regions consumed soil exceeds 5%, with the highest values in Lombardy, Veneto, and Campania, all above 10% of regional area consumed (Table 1). Emilia-Romagna, Lazio, Apulia, Friuli-Venezia Giulia, and Liguria follow, with values above the national average (7.17%) and between 7% and 12%. Valle d’Aosta has the lowest percentage (2.16%). Regional morphology and the historical evolution of soil use must be considered when interpreting the relevance of these values.
The density of net changes between 2023 and 2024, i.e. soil consumption relative to territorial area, highlights the weight of the North-East, which consumes 3.3 m² per hectare, compared with a national average of 2.8 m²/ha (Table 1). Among regions, the highest net soil consumption density is observed in Lazio (4.43 m²/ha), Apulia (4.17 m²/ha), Emilia-Romagna (3.88 m²/ha), and Veneto (3.58 m²/ha). Below 3 m²/ha, the highest values are recorded in Abruzzo (2.78 m²/ha), Sardinia (2.77 m²/ha), Friuli-Venezia Giulia (2.15 m²/ha), and Piedmont (1.98 m²/ha).
The regions with the largest soil consumption over 2006–2024 are Lombardy (16,220 ha), Emilia-Romagna (14,204 ha), Apulia (13,590 ha), Veneto (13,401 ha), Sardinia (11,592 ha), Piedmont (10,473 ha), and Lazio (10,318 ha), together accounting for almost 70% of all transformations over the last 17 years. The remaining regions show soil consumption increases below 10,000 hectares.
In percentage terms, the highest increase in consumed soil over 2006–2024 is recorded in Apulia (9.37%), followed by Basilicata (8.68%). Lazio, Abruzzo, Sicily, Marche, Calabria, Emilia-Romagna, Veneto, Umbria, Piedmont, and Campania show increases between 7.9% and 7.0%. The national average is around 6%. Friuli-Venezia Giulia, Molise, Valle d’Aosta, Tuscany, Liguria, Sardinia, Trentino–Alto Adige, Campania, and Lombardy are below the national average (Table 3).
Consistent with previous years, results highlight predominantly reversible consumption, with more than 80% of changes affecting construction sites and other compacted-earth areas that will likely be converted into permanent soil consumption in the coming years (Table 2).
In line with the Sustainable Development Goals—specifically the target “ensure that soil consumption does not exceed population growth”—the SDG indicator 11.3.1 was also produced, relating the rate of change in soil consumption to the rate of change in population through a semi-logarithmic ratio (LCRPGR). In the years analysed (Table 4), national values are almost always below -1; only between 2020 and 2022 values between -1 and 0 are observed (in 2022–2021 it is -0.97 and in 2021–2020 it is -0.46), indicating unsustainable growth where increasing soil consumption is accompanied by population decline. In 2023, a very negative value is observed (-5.36).
Significant imbalances between soil consumption and population are also found, with the maximum positive value of 149.60 in Campania (2021–2022), 24.55 in Tuscany (2020–2021), and in Lazio 34.64 (2017–2018), and 46.10 in Piedmont (2024–2023). In all four cases, population growth, although positive, does not match the increase in consumed area. Lower (more negative) values are recorded in Sicily (-49.10) between 2021 and 2022, in Lazio (-9.30) between 2018 and 2019, and in Veneto (-8.46) between 2017 and 2018, where population decline strongly affects the sign and magnitude of the indicator.
For the latest reference year (2023–2024), Lombardy (0.75) and Trentino–Alto Adige (0.88) are the only two regions where the indicator falls within the range considered sustainable (between 0 and 1). The maximum positive value is recorded in Veneto (7.53) and the minimum in Tuscany (-7.19) (Table 4).