Panel 1
Daniela Berto, Nicoletta Calace, Giordano Giorgi, Marina Penna
Eutrophication is a process caused by the enrichment of nutrients, particularly nitrogen and phosphorus compounds, which leads to an increase in primary production and algal biomass, resulting in the alteration of benthic communities and, in general, a decline in water quality. The input of nitrogen and phosphorus into the marine and coastal environment can originate from diffuse sources (river loads, major collectors of agricultural activity, and urban discharges) and point sources (discharges from wastewater treatment plants, industrial activities, and aquaculture operations). Objectives related to eutrophication control and management are set by the Water Framework Directive (WFD, Directive 2000/60/EC), the Marine Strategy Framework Directive (Descriptor 5, Directive 2008/56/EC), and the Nitrates Directive (Directive 91/676/EEC) and Urban Waste Water Treatment Directive (Directive 91/271/EEC), which are particularly focused on pressure management. The causes of eutrophication are primarily linked to nutrient inputs carried into the sea by rivers or coastal settlements, which cause serious negative impacts on the health of marine ecosystems and the sustainable use of goods and services. The main sources of nutrients are related to the agri-livestock and urban sectors.
Environmental assessments regarding eutrophication, in accordance with the requirements of Directive 2008/56/EC, have highlighted the achievement of Good Environmental Status. Therefore, the measures adopted so far under Directive 2000/60/EC, Directive 91/676/EEC, and Directive 91/271/EEC have proven effective in achieving environmental targets.
Eutrophication consists of a chain process characterized by several stages: a) Enrichment of waters with nutrients, particularly nitrogen and/or phosphorus compounds; b) Increase in primary production and algal biomass favored by the abundance of nutrients; c) Accumulation of organic matter derived from algal biomass not sufficiently consumed by higher trophic levels that feed on it; d) Hypoxia/anoxia phenomena in bottom waters caused by the mainly aerobic digestion of organic matter by bacterial communities, resulting in oxygen consumption; e) Potential stress on benthic communities and fish die-offs as a consequence of hypoxia/anoxia in bottom waters.
The indicator is listed as a Descriptor within Directive 2008/56/EC and is one of the 11 Descriptors for which Good Environmental Status must be achieved. For Descriptor 5, the Directive requires minimizing human-induced eutrophication, particularly its negative effects, such as biodiversity loss, ecosystem degradation, harmful algal blooms, and oxygen depletion in bottom waters. The marine subregions include the Adriatic Sea, the Ionian Sea, the Central Mediterranean Sea, and the Western Mediterranean Sea.
To represent the phenomenon of eutrophication, which consists of an enrichment of water with nutrients, particularly nitrogen and phosphorus concentrations, which in turn can lead to an increase in phytoplankton production and algal biomass.
The Marine Strategy Framework Directive (MSFD, 2008/56/EC), transposed into national legislation through Legislative Decree 190/2010, aims to achieve Good Environmental Status (GES) according to the criteria and methodological standards established by the European Commission Decision of May 17, 2017 (Decision EU 2017/848). Specifically, for Italian waters, a multiparametric index is used that equally weights the three primary criteria of Decision EU 2017/848: nutrient concentration, surface chlorophyll 'a' concentration, and dissolved oxygen concentration in bottom waters.
The Water Framework Directive (WFD, 2000/60/EC), transposed into the Environmental Code (Legislative Decree 152/2006 and its amendments), aims to protect and improve the condition of water resources, ensuring their long-term sustainable use. Its main objectives include achieving "Good Status" for water bodies in terms of both chemical and ecological quality, while reducing anthropogenic pressures from both point and diffuse sources.
The Nitrates Directive (91/676/EEC) aims to protect waters from pollution caused by nitrates of agricultural origin by implementing monitoring programs for surface and groundwater in areas prone or potentially prone to eutrophication. It includes measures aimed at improving water quality.
The Urban Waste Water Treatment Directive (91/271/EEC) seeks, among other goals, to protect waters from pollution caused by nutrients of urban origin. The revision of the Directive is currently being finalized, which will provide additional measures to limit nutrient inputs into water bodies.
Panel 2
Report MSFD 2018 - https://cdr.eionet.europa.eu/it/eu/msfd_art17/2018reporting
Report Activity 7 Pr. MEDREGION - https://cordis.europa.eu/project/id/311780/reporting
Giovanardi et al., Development of ecological classification criteria for the Biological Quality Element phytoplankton for Adriatic and Tyrrhenian coastal waters by means of chlorophyll a (2000/60/EC WFD), Ecological Indicators 93: 316 (2018), DOI:10.1016/j.ecolind.2018.05.015 2018
Giani et al., Assessment of the eutrophication status at Mediterranean sub-basin scale, within the European Marine Strategy Framework Directive, Science of The Total Environment 945: 173876 (2024) doi.org/10.1016/j.scitotenv.2024.173876
UNEP/MED WG.563/7 - https://www.unep.org/unepmap/index.php/fr/
https://indicatoriambientali.isprambiente.it/it
Data quality assessment
SNPA
Centri Funzionali della Protezione Civile
Dati Monitoraggio MSFD: SIC Sistema Informativo Centralizzato - http://www.db-strategiamarina.isprambiente.it
Dati Monitoraggio WFD - https://www.sintai.isprambiente.it/
Dati Pressioni - https://www.sintai.isprambiente.it/
National
2016-2021
Indicator assessment
Regarding the riverine loads of nitrogen and phosphorus, these were estimated as the annual mass of nitrogen and phosphorus (tons/year) at the basin closure stations for the Po River (Pontelagoscuro), Tiber River (Ripetta), and Arno River (San Giovanni alla Vena), by multiplying the annual mean concentration of each nutrient by the annual mean flow rate. Loads from urban wastewater were estimated using data from treatment plants recorded in compliance with Directive 91/271/EEC (2020 reporting activity). Only treatment plants discharging into inland waters within a 20-km buffer from the coastline or directly into the sea were considered. Plants discharging within the hydrographic basins of the Po, Tiber, and Arno rivers were excluded since their loads were already accounted for in the riverine load estimates.
For all treatment plants, the nitrogen and phosphorus loads entering the plants were estimated using a conversion factor of 12 g/day per PE (population equivalent) for nitrogen and 2 g/day per PE for phosphorus. These factors are widely used in plant design. For the estimation of outgoing loads, reduction percentages relative to incoming loads were calculated based on the number of population equivalents and the type of treatment applied (primary, secondary, tertiary, or more advanced treatment).
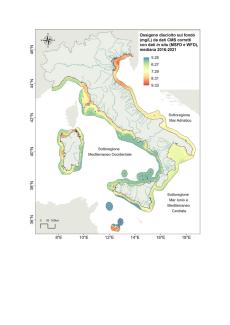
For indicators related to parameters such as chlorophyll 'a' (Chla), dissolved inorganic nitrogen (DIN), total phosphorus (TP), and bottom dissolved oxygen, modeling systems were applied both for the physical component (Med‐MFC) and the biogeochemical component (MedBFM3). These systems integrate in-situ information (monitoring data from WFD and MSFD) and satellite data. However, this integration is limited by the spatial coverage of monitored data and, therefore, is restricted to the marine area within 12 nautical miles from the coast (territorial waters). The DIN is calculated as the sum of the inorganic nitrogen present in water in the forms of ammonium ion (N-NH4) and nitrate ion (N-NO3), since nitrite ion (N-NO2) was consistently found in very low concentrations.
Based on the water type defined by salinity and density (Water Type, WT Table 1), reference values were used to assign the status GES/noGES for each of the aforementioned parameters (Table 2).
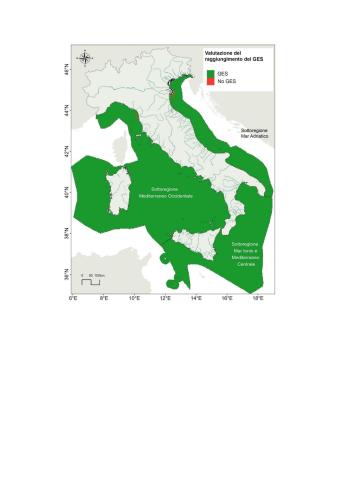
The overall assessment of Good Environmental Status (GES/noGES) for Italian waters for the period 2016–2021 was conducted using a multiparametric index that equally weighs the three primary criteria of Decision EU 2017/848: nutrient concentration, surface chlorophyll 'a' concentration, and dissolved oxygen concentration in bottom waters.
The distribution of chlorophyll-a (Figure 1) indicates the achievement of good status in all waters except those in the northern Adriatic, where threshold values are still exceeded (Table 2). The distribution of nutrients (DIN and TP, Figures 2 and 3) highlights the achievement of good status in all waters except near the mouths of the Po and Tiber rivers, where these parameters exceed threshold values. This result is attributable to nitrogen and phosphorus loads. The temporal trends analysis for 2016–2021 related to nitrogen and phosphorus riverine loads shows an increase in nitrogen for the Po River and a decrease for the Tiber River (Figure 4). For phosphorus, an increase is observed in the Po River, while a stable trend is noted in the Tiber River (Figure 5). Nitrogen and phosphorus loads from urban wastewater in the Adriatic Sea (Table 3) are consistent with those estimated in the previous six-year period, while lower values are observed in other Italian waters.
The distribution of bottom dissolved oxygen (Figure 6) shows good status with high oxygenation levels (greater than 3 mg/L). The overall assessment of Good Environmental Status (GES/noGES) for Italian waters during the 2016–2021 period highlights the achievement of predetermined objectives (Figure 7).
During the period under review (2016–2021), Italian seas are progressively evolving toward oligotrophication, particularly evident along the Adriatic coastal zone.
Data
Figure 4: Trend of the nitrogen load poured into the sea by the Po and Tiber Rivers and the average annual courses
ISPRA processing on SNPA data and Functional Civil Protection Centres
The dotted line represents the trend line of loads between the years 2016 and 2021
Figure 5: Testing of the phosphorus load poured into the sea by the Po and Tiber Rivers and the average annual courses
ISPRA processing on SNPA data and Functional Civil Protection Centres
The dotted line represents the trend line of loads between the years 2016 and 2021
Table 1: Types of water classified according to salinity and density values
Giani et al., 2024
Table 2: Reference values for the allocation of GES/noGES status to the Chla, TP, DIN and bottom dissolved oxygen parameters
Giani et al., 2024; Giovanardi et al., 2018; Report MSFD 2018; Report Activity 7 Pr. MEDREGION; UNEP/MED WG.563/7
Table 3: Estimated nitrogen and phosphorus outgoing loads (2020 reporting activities of Directive 91/271/EC) with uncertainties
ISPRA processing on SNPA data


The parameters considered to describe the phenomenon of eutrophication generally indicate good status, as their values are below the reference thresholds (with the exception of DIN, which still presents criticalities in the Po River mouth area). The threshold values currently used to differentiate between GES and noGES status are not considered definitive. They represent a starting point based on available scientific knowledge but may be subject to future refinements and revisions. This refinement process is necessary to ensure that the adopted parameters accurately and up-to-date reflect marine ecosystem dynamics, considering new scientific evidence and methodological advances in environmental research.