CULTURAL HERITAGE EXPOSED TO LANDSLIDES AND FLOODS
Data aggiornamento scheda: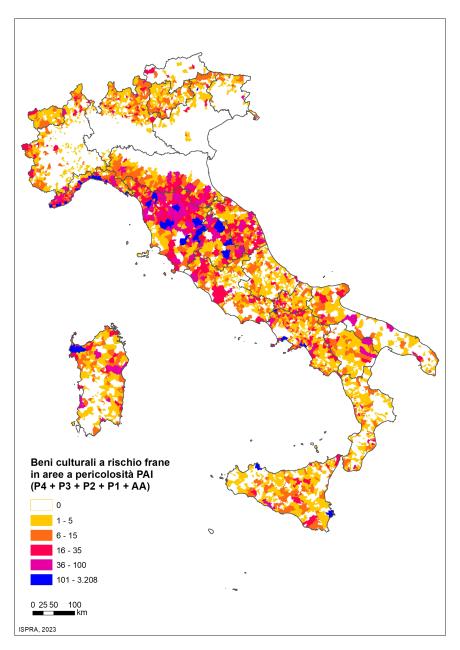
The indicator provides information regarding cultural heritage exposed to landslide and flood risk along the national territory. There are 40,256 cultural heritage sites at landslide risk, of which 13,243 are in areas with high hazard P3 and very high hazard P4. There are 35,979 cultural heritage sites at risk of flooding in the medium hazard scenario (return periods between 100 and 200 years), and up to 53,844 in the low hazard scenario, which is the maximum expected scenario.
DISTRIBUTION OF ECOLOGICAL VALUE ACCORDING TO CARTA DELLA NATURA
Data aggiornamento scheda:
The indicator, based on data processed within the Carta della Natura project, shows the distribution of Ecological Value across 16 Italian regions, providing a representation categorized into different classes. Ecological Value is understood as a synonym for natural significance and is calculated—starting from the regional habitat maps—for each mapped polygon, excluding those referring to built enviroments and fully urbanized areas.
This indicator offers an overview of the environmental mosaic within various regional contexts, highlighting high-value areas, including their protection status. The analysis presents the percentage of protected areas in each region and the composition of protected and unprotected zones in terms of Ecological Value. The protected areas system (EUAP areas, Natura 2000 sites, and Ramsar areas) covers, on average, less than 24% of the territory in the 16 examined regions, exceeding 30% only in Abruzzo, Campania, and Valle d’Aosta. A strong correlation is observed between protected areas and territories classified with the highest Ecological Value, covering an average of 49.4%. However, significant portions remain outside protected areas, varying from region to region, which suggests potential new areas for conservation.
ECOLOGICAL STATUS OF COASTAL MARINE WATERS
Data aggiornamento scheda: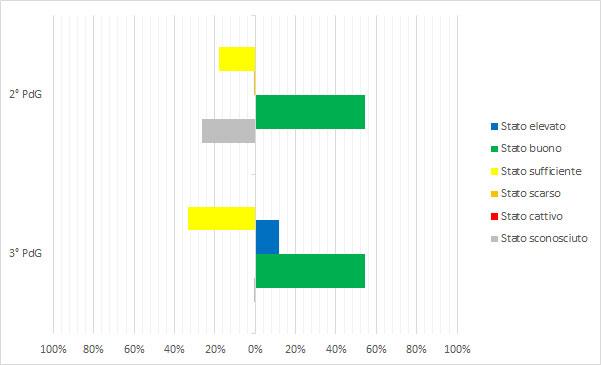
Coastal marine waters are defined as “surface waters situated inside an imaginary line one nautical mile away, at every point, on the outer side from the nearest point of the baseline used to define the territorial sea limit, and potentially extending to the outer boundary of transitional waters.” The legislation (Legislative Decree 152/2006) mandates achieving "good" status (ecological + chemical) for water bodies by the deadlines set by current regulations; failure to meet environmental goals entails remediation measures. Based on the analysis of data reported by Districts in the 3rd Reporting to the European Commission for the six-year period 2016–2021 (3rd WMP), the ecological status of Italian coastal marine waters is heterogeneous. This heterogeneity is expressed in both the number of water bodies identified per district and their ecological classification. The Eastern Alps, Northern Apennines, Central Apennines, Sicily, and Sardinia Districts show a percentage of water bodies in good and high ecological status greater than or equal to 70%. Specifically, in the Sardinia District, more than 40% of water bodies are in high status. Nationally, more than 60% of water bodies (261 out of 394 total) are in good and high ecological status. Comparing data from the 2nd WMP and the 3rd WMP shows that in the 2nd WMP, 27% of water bodies had unknown ecological status (149 out of 561 total), while in the 3rd WMP, only one water body is in unknown ecological status. In general terms, the proportion of water bodies in good and high ecological status increased from 55% in the 2nd WMP to 66% in the 3rd WMP.
ECOLOGICAL STATUS OF INLAND SURFACE WATERS
Data aggiornamento scheda: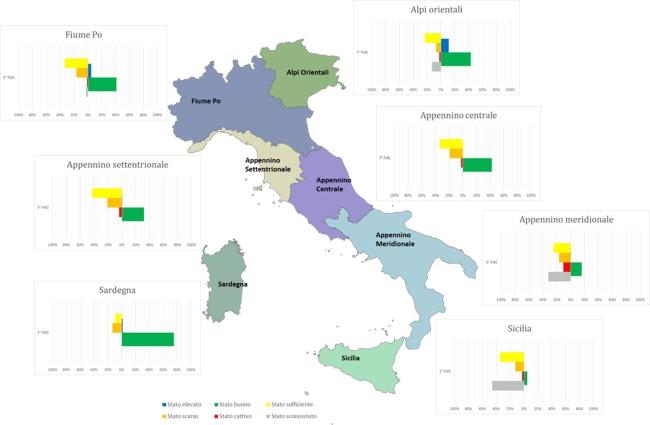
The ecological status of surface waters reflects the quality of the structure and functioning of aquatic ecosystems. Directive 2000/60/EC (transposed in Italy with Legislative Decree 152/2006) mandates the achievement of "good" quality status for water bodies, which is determined by the assessment of both ecological and chemical status. The indicator provides an evaluation of the ecological status of surface water bodies—specifically inland waters—based on classification data from the WISE 2022 Reporting related to the 3rd Water Management Plan. At the national level, comparing the ecological quality status data between the 2nd and 3rd Management Plans shows a reduction in water bodies with unknown status, from 18% to 10%, though they are still present. In general, the ecological status has not significantly changed from the previous management cycle, except for the percentage of lakes in good status, which has increased from 17% to 35%.
ECOLOGICAL STATUS OF TRANSITIONAL WATERS
Data aggiornamento scheda: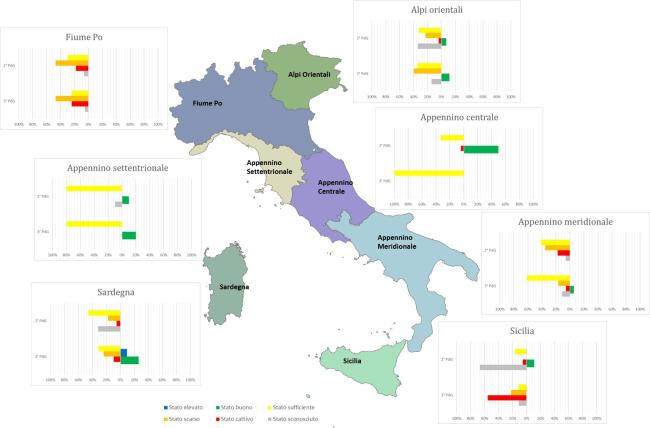
Transitional waters are defined in Legislative Decree 152/2006 as "surface water bodies near a river mouth, partially saline due to their proximity to coastal waters but significantly influenced by freshwater flows." This definition encompasses coastal lagoons and coastal ponds subject to ecological classification. Italian transitional environments are exposed to numerous pressure factors, often leading to degradation of ecological conditions in these fragile ecosystems. The ecological status analysis shows heterogeneous values, both in the number of Water Bodies (WB) and in the distribution across quality classes, with a prevalence of sufficient and poor statuses in all Districts. Comparing the status of the 2nd Water Management Plan (WMP) cycle with that of the 3rd cycle, it is observed that for all hydrographic districts, ecological status remains predominantly sufficient and poor. However, there is an increase in the percentage of water bodies in good status in the Eastern Alps District (from 7% to 11%), Northern Apennines District (from 10% to 20%), Southern Apennines District (from 0% to 6%), and Sardinia District (from 0% to 26%). National analysis of ecological status shows that the number of water bodies in good or high status increased from 9 out of 172 (5%) in the 2nd WMP cycle to 22 out of 146 (15%) in the 3rd cycle.
MARINE PROTECTED AREAS
Data aggiornamento scheda:The number of areas and the extent of protected marine surface have steadily increased over time. Currently, Italy has 39 Marine Protected Areas (MPAs), established in 10 Italian regions; of these, 29 are Marine Protected Areas (AMPs). Sicily and Sardinia are the regions with the highest number of marine protected areas, both in terms of quantity and protected marine surface.
Between 2012 and 2019, the national surface area of MPAs increased by 1.9%, thanks to the establishment in 2018 of two Marine Protected Areas: Capo Testa - Punta Falcone in Sardinia and Capo Milazzo in Sicily.
MARITIME SPATIAL PLANNING: ALLOCATED ZONE FOR AQUACULTURE
Data aggiornamento scheda:
This indicator reports national scale data on surface area and number of current maritime state concessions for aquaculture as well as the Allocated Zones for Aquaculture (AZA). AZAs are designated by the competent authority as "Priority Areas for Aquaculture", meaning they are free from conflicts with other users and have environmental conditions ensuring sustainable production while minimizing environmental impact.
The identification of new marine zones for aquaculture is one of the key objectives of the Strategic Guidelines for a More Sustainable and Competitive EU Aquaculture for 2021–2030 (COM/2021/236), the national Strategic Aquaculture Plans for 2014–2020 and 2021–2027, and the respective European Maritime and Fisheries Fund (EMFF) and European Maritime, Fisheries and Aquaculture Fund (EMFAF) Operational Program, established under Regulations 508/2014/EU and 1139/2021/EU. The process of AZA identification falls under the Maritime Spatial Planning Framework established by Directive 2014/89/EU, transposed into Italian law through the Legislative Decree 201/2016. This framework supports the sustainable growth of maritime economies with a coordinated, integrated, and cross-border approach within Maritime Spatial Management Plans.
The maritime space under Italian jurisdiction, between the coastline and the 12-nautical-mile limit, covers approximately 14 million hectares. Of this space, only 19,722 hectares are occupied by state concessions for aquaculture, of which 93.8% (18,500 ha) is for shellfish farming and only 6.2% (1,222 ha) for marine fish farming. As of December 2022, AZAs have been designated only in Tuscany, Marche, and Emilia-Romagna, covering a total area of approximately 19,500 hectares. Within the AZAs, there are 46 state concessions for shellfish farming and 6 for fish farming.
NITRATES IN GROUNDWATER
Data aggiornamento scheda:The indicator provides the percentage of groundwater monitoring stations divided into quality classes based on the average nitrate concentration recorded over a four-year monitoring period (2016–2019). Specifically:
- 68.1% of stations show an average nitrate concentration below 25 mg/L,
- Only 12.6% of monitored points recorded an average concentration equal to or above 50 mg/L.
Additionally, an analysis comparing the trend over the last four years (2016–2019) to the previous four years (2012–2015) reveals predominantly stable nitrate concentrations, a decrease in average concentration at 37.9% of common stations between the two periods, and an increase at only 22.7% of the same stations.
NITROGEN AND PHOSPHORUS BALANCE FROM AQUACULTURE FACILITIES IN MARINE ENVIRONMENT
Data aggiornamento scheda:The indicator provides an estimate of the input and removal of nitrogen and phosphorus in coastal environments where aquaculture activities take place. Specifically, fish farming contributes to the release of these nutrients, while mussel farming facilitates their removal.
The balance between the nutrient input from farmed fish and the nutrient removal by bivalve shellfish allows for a regional-level assessment of the net quantitative contribution of aquaculture to trophic processes along the Italian coastline.
At the national level, in 2020, estimates of the nitrogen and phosphorus balance from intensive fish farming and mussel farming showed a reduction compared to 2019. This decrease was due to:
- A decline in nutrient input resulting from lower fish production
-
A decrease in nutrient removal due to the reduction in mussel production
At the regional level, in Veneto, Emilia-Romagna, Abruzzo, Molise, and Marche, the removal of nitrogen and phosphorus by mussels exceeded the input from farmed fish.
OVERLAP OF TERRESTRIAL PROTECTED AREAS WITH KEY BIODIVERSITY AREAS
Data aggiornamento scheda:In order to assess whether protected areas have been designated based on scientific criteria, including ecologically representative areas (Margules & Pressey, 2000; Maxwell et al., 2020), the overlap between terrestrial protected areas in our country and Key Biodiversity Areas (KBA, IUCN, 2016) has been calculated. The protected areas considered include those in the data bank of the Common Database on Designated Areas (CDDA) (now Nationally designated areas of Europe - NatDA), and the Natura 2000 Network. KBAs identify key areas for biodiversity conservation and, according to the European Commission’s guidance document on achieving the 30% target ("Criteria and guidance for protected areas designations," Brussels, 28/1/2022), are among those to be considered for designation as protected areas. The indicator used corresponds to the one adopted internationally to evaluate progress toward the Sustainable Development Goals (SDGs) for 2030 (SO4-3.T1: National estimates of the average proportion of Terrestrial KBAs covered by protected areas in %).
The results indicate that, after accounting for overlaps between CDDA protected areas and Natura 2000 sites, 75.20% of the national terrestrial protected area overlaps with KBAs identified at the national level, demonstrating a fair inclusion of important biodiversity areas.
POPULATION EXPOSED TO FLOODS
Data aggiornamento scheda: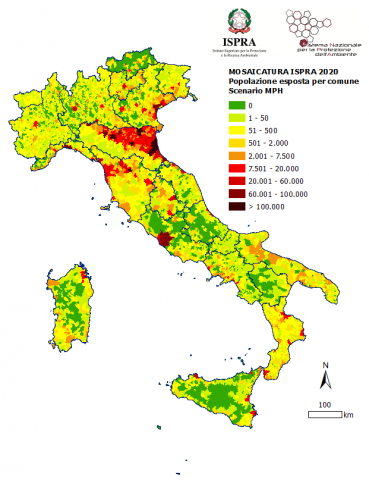
This indicator provides an overview of the population residing in flood-prone areas (population exposed to flood risk) at the national, regional, provincial, and municipal levels. In Italy, the population residing in areas with high hazard/probability is 4.1% of the total national population (2,431,847 people); those exposed to medium hazard/probability are 11.5% (6,818,375 people), while the population in areas with low hazard/probability is 20.6% (12,257,427 people).
POPULATION EXPOSED TO LANDSLIDES
Data aggiornamento scheda: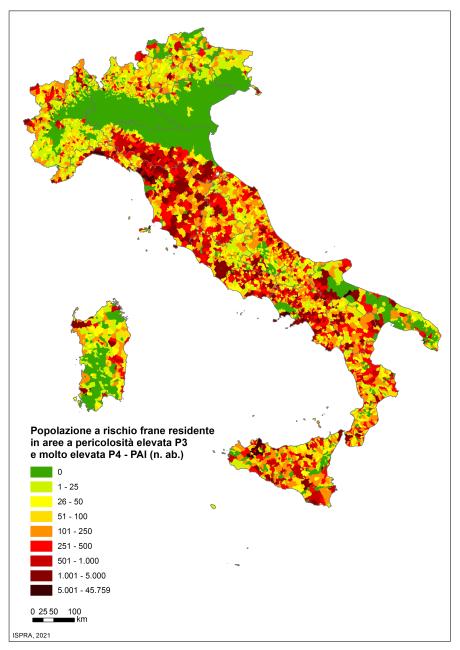
The indicator provides an estimate of the population exposed to landslide risk (personal damage risk: deaths, missing, injuries, and evacuations) on a national, regional, provincial, and municipal basis. In Italy, the population at landslide risk residing in areas with high and very high landslide hazard (P3+P4) amounts to 1,303,666 inhabitants, equal to 2.2% of the total population.
QUANTITATIVE STATUS OF GROUNDWATER (SQUAS)
Data aggiornamento scheda: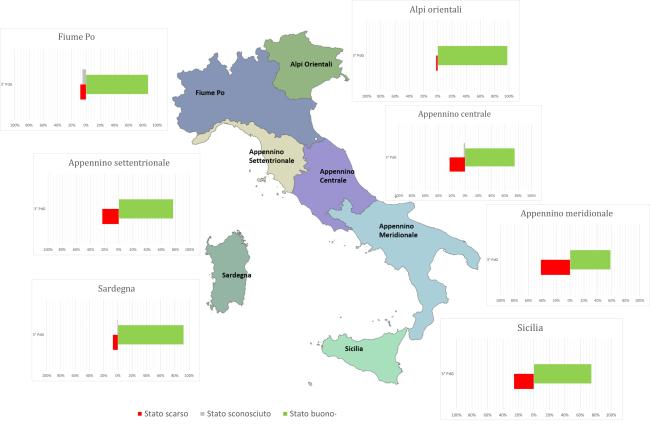
The quantitative status of groundwater describes the balance of a water body in terms of the relationship between extraction and natural replenishment of the water resource. A groundwater body is defined as being in "good quantitative status" if groundwater levels ensure that the annual average withdrawals for long-term anthropogenic activities do not exhaust the available groundwater resources, do not cause damage to surface waters and connected ecosystems, and do not lead to saline intrusion or other types of contamination.
This indicator has been derived from the classification data of water bodies in the WISE Reporting of the 3rd Water Management Plan (WMP). Nationally, during the 2016-2021 classification period under the 3rd WMP, an increase in groundwater bodies classified as being in "good quantitative status" was observed, reaching 79% of the total (compared to 61% in the 2nd WMP). The percentage of groundwater bodies in "poor" status is 19%, while 2% remain unclassified. At the district level, the percentages of water bodies achieving "good quantitative status" range from 98% in the Eastern Alps District to 58% in the Southern Apennine District.
RESEARCH AND DEVELOPMENT EXPENSES IN THE INDUSTRIAL SECTOR
Data aggiornamento scheda: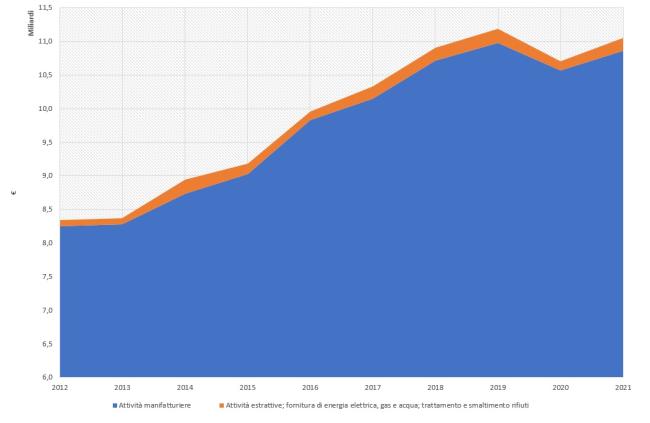
After the decline recorded between 2019 and 2020, due to the contraction in economic activity caused by the pandemic, in 2021 intramural Research & Development (R&D) spending by industrial enterprises began to grow again, rising from €10.7 to €11.1 billion (+3.3%), although it did not return to pre-pandemic levels. Nearly all of the expenditure (98.2%) is borne by manufacturing companies. Looking at the ten-year trend from 2012 to 2021, total spending increased by 32.5%. The share of business R&D expenditure as a percentage of GDP stood at 0.86% in 2021 and 0.78% in 2022 (provisional data). Among European industrialized countries, Italy is the one whose companies spend the least on R&D in proportion to GDP, remaining below the euro area average (1.5%). However, between 2012 and 2021, Italian companies increased their R&D spending relative to GDP by 26.5%. The main source of funding is the companies themselves.
RICHNESS AND RED LIST STATUS OF ANIMAL SPECIES
Data aggiornamento scheda:The Italian fauna is estimated to include over 58,000 species, with the total number reaching approximately 60,000 taxa when considering subspecies. However, this biodiversity is under threat, as indicated by IUCN assessments and population trends. Among the 672 species of Italian vertebrates (576 terrestrial and 96 marine), 6 are extinct in Italy, and 161 are threatened with extinction (accounting for 28% of the assessed species). Different vertebrate groups show varying percentages of risk: 2% for marine bony fish, 19% for reptiles, 21% for cartilaginous fish, 23% for mammals, 36% for amphibians, and up to 48% for freshwater bony fish (considering the CR+EN+VU IUCN categories). Additionally, terrestrial and marine vertebrate populations are generally declining by 27% and 22%, respectively.
Breeding birds are the only group for which two IUCN assessments have been conducted, seven years apart. Of the 278 species assessed in the latest 2019 evaluation, 5 are extinct, and 67 are threatened (compared to 76 in 2013), representing 26% of the evaluated species. Half of Italy's breeding bird species are not at immediate risk of extinction.
Among invertebrates, 9% of corals, 11% of dragonflies, 21% of saproxylic beetles, 6% of butterflies, and 11% of assessed bees are threatened with extinction. Invertebrates also show negative trends; for example, 16% of dragonfly populations are in decline, five times higher than those increasing.
SOIL DEGRADATION
Data aggiornamento scheda:
Soil degradation refers to the reduction in the biological productivity of soil resources. This process is often intrinsically linked to biodiversity loss and the impacts of climate change. Assessing soil degradation requires considering multiple interdependent factors, each contributing differently to the phenomenon.
In recent years, Italy has participated in the pilot project on Land Degradation Neutrality (LDN), promoted by the United Nations Convention to Combat Desertification (UNCCD), and in the LDN Target Setting Programme, which supports countries in identifying voluntary LDN targets and defining associated measures to achieve Sustainable Development Goal (SDG) 15.3. This goal is monitored through the "Proportion of degraded land over total land area" (SDG Indicator 15.3.1).
For the assessment of this indicator in Italy, three sub-indicators proposed by UNCCD under the LDN framework have been adopted:
- Land cover change
- Soil productivity index
- Soil organic carbon content
Additionally, further indices and parameters relevant to the Italian context and available at the national level have been considered. The results show that in 2019, the proportion of degraded land in Italy, excluding water bodies, was 17.4%, according to the UNCCD methodology. Furthermore, nearly 56,000 km² (approximately 18.5% of the national territory) experienced increased degradation between 2006 and 2019.
TERRESTRIAL PROTECTED AREAS
Data aggiornamento scheda: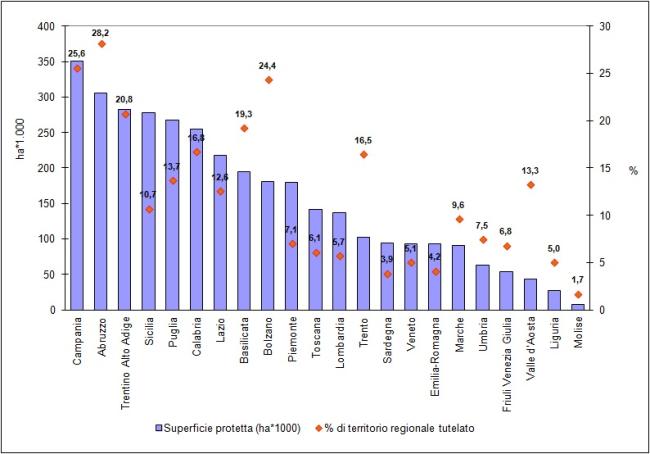
In Italy, as of today, 843 terrestrial protected areas (including those with a marine component) have been established, covering a total protected surface of over 3 million hectares, which corresponds to approximately 10.5% of the national terrestrial area. Analyzing the historical series (1922-2019), it is possible to observe, especially from the mid-1970s onward, a positive trend in terms of both the number and surface area of terrestrial protected natural areas. However, since 2008-2009, there has been a certain stabilization in the growth trends.
WETLANDS OF INTERNATIONAL IMPORTANCE
Data aggiornamento scheda: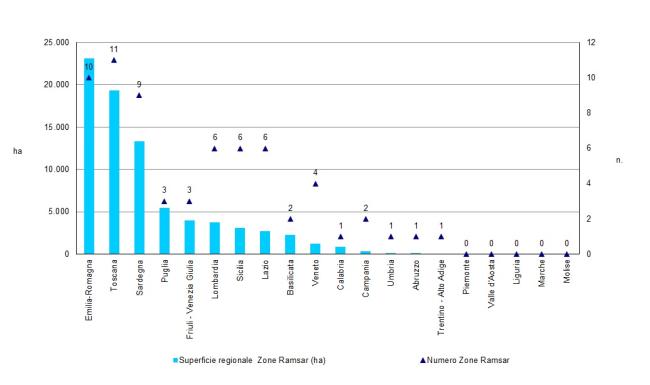
The Italian wetlands currently included in the official list of sites under the Ramsar Convention are 57, covering a total of 72,288 hectares. Additionally, three Ministerial Decrees were issued in 2011, 2013, and 2016 for the establishment of nine more areas. In total, the 66 Italian Ramsar sites (57 designated and 9 in the process of designation) are distributed across 15 regions, covering 79,826 hectares. The regions with the largest and most numerous areas are Emilia-Romagna (10 areas, 23,112 ha), Tuscany (11 areas, 19,306 ha), and Sardinia (9 areas, 13,308 ha).
The level of implementation of protection and management measures for these areas is not sufficiently known, despite being essential to ensure the conservation of habitats, flora, and fauna.