Luca Congedo, Di Leginio, Anna Luise, Michele Munafò, Nicola Riitano,

Soil degradation refers to the reduction in the biological productivity of soil resources. This process is often intrinsically linked to biodiversity loss and the impacts of climate change. Assessing soil degradation requires considering multiple interdependent factors, each contributing differently to the phenomenon.
In recent years, Italy has participated in the pilot project on Land Degradation Neutrality (LDN), promoted by the United Nations Convention to Combat Desertification (UNCCD), and in the LDN Target Setting Programme, which supports countries in identifying voluntary LDN targets and defining associated measures to achieve Sustainable Development Goal (SDG) 15.3. This goal is monitored through the "Proportion of degraded land over total land area" (SDG Indicator 15.3.1).
For the assessment of this indicator in Italy, three sub-indicators proposed by UNCCD under the LDN framework have been adopted:
- Land cover change
- Soil productivity index
- Soil organic carbon content
Additionally, further indices and parameters relevant to the Italian context and available at the national level have been considered. The results show that in 2019, the proportion of degraded land in Italy, excluding water bodies, was 17.4%, according to the UNCCD methodology. Furthermore, nearly 56,000 km² (approximately 18.5% of the national territory) experienced increased degradation between 2006 and 2019.
Soil and land degradation is a complex phenomenon caused by multiple interacting factors that limit or inhibit productive, regulatory, and ecosystem service functions that natural soils provide. These factors are interrelated, and there is no consensus within the scientific community on a universal evaluation method.
The UN 15.3.1 indicator assesses degradation as the proportion of degraded land relative to total land area. The UNCCD (2017) has proposed a methodology for qualitative assessment based on the combined use of the following three sub-indicators, while allowing for additional country-specific indicators:
- Land cover changes over time
- Soil productivity
- Organic carbon content in soil
Degradation is assessed by analyzing the variation of these indicators within a baseline period (2000-2015) and a reporting period (2004-2019).
- Land cover was analyzed using CLC change data, summing changes for 2000-2006 and 2006-2012 for the baseline period, and 2012-2018 for the reporting period. The data have a higher Minimum Mapping Unit (MMU) resolution (5 ha vs. 25 ha) compared to the standard CLC six-year update cycle. Artificial land cover data were further refined using the SNPA soil consumption map (10m resolution), updated for 2015 and 2019.
- Soil productivity was assessed using Water Use Efficiency (WUE), calculated as the ratio between Gross Primary Production (GPP) and evapotranspiration losses (Tang et al., 2014). The study utilized the MODIS dataset on evapotranspiration, processed through Trends.Earth in connection with Google Earth Engine. NDVI-based indicators were also used to analyze state and performance trends.
- Organic carbon changes in soil were estimated using land cover change data (baseline: 2000-2015, reporting: 2004-2019) and the Global Soil Organic Carbon Map (FAO & ITPS, 2018), developed through the analysis of 6,700 stratigraphic profiles collected between 1990 and 2013, alongside additional covariates (land use, precipitation data, digital terrain models, etc.).
The final indicator synthesizes information from the baseline and reporting period using the UNCCD methodology for SDG 15.3.1, incorporating updates from UNSD metadata (March 31, 2022) and the UNCCD Good Practice Guidance (v.2.0, 2021).
For the baseline period, stable or degraded areas were identified, while in the reporting period, areas showing improvement were also estimated. The "One Out, All Out" principle (UNCCD, 2017) is applied, meaning that degradation is identified if at least one sub-indicator shows a decline.
In the Italian context, additional degradation factors were assessed for the reporting period (2006-2019) and the triennium 2019-2022, including:
- Habitat quality loss
- Increased fragmentation
- Potential impact areas (defined as surfaces within a 60-meter buffer zone around artificial surfaces)
- Artificial land cover density (based on SDG 11 definition)
- **Increase in natural patches smaller than 1,000 m²
- Burned areas
To assess the status and trends of soil and land degradation using descriptive and proxy indicators.
Land monitoring is a key theme in the United Nations 2030 Agenda for Sustainable Development and its Sustainable Development Goals (SDGs). Among the 169 sub-goals, one is particularly relevant for soil and land protection:
- "Ensure the fight against desertification, the restoration of degraded land and soil, including areas affected by desertification, drought, and floods."
To track progress, SDG Indicator 15.3.1 (Proportion of degraded land over total land area) was universally proposed.
Although no specific legal targets have been set, this indicator contributes to measuring the goal of achieving a "land degradation neutral world" by 2030, essential for maintaining long-term ecosystem functions and services.
In November 2020, the European Commission launched the "New Soil Strategy – Healthy Soil for a Healthy Life", adopted in November 2021, which aims to introduce an EU Soil Health Law by 2023. The new strategy addresses multiple challenges, including the restoration of degraded soils and improving soil quality monitoring, which could enhance the efficiency and robustness of current methodologies across EU Member States.
Ponce-Campos, G. E., Moran, M. S., Huete, A., Zhang, Y., Bresloff, C., Huxman, T. E., ... & Starks, P. J. (2013). Ecosystem resilience despite large-scale altered hydroclimatic conditions. Nature, 494(7437), 349-352.
Schillaci, C., Jones, A., Vieira, D., Munafò, M., & Montanarella, L. (2022). Evaluation of the Sustainable
Development Goal 15.3.1 Indicator of Land Degradation in the European Union. Land Degradation & Development. https://doi.org/10.1002/ldr.4457
Sims, N. C., Green, C., Newnham,G., England, J., Held, A., Wulder, M., ... & McKenzie, N. (2017).Good practice guidance. SDG Indicator, 15(1), 115.
Tang, Xuguang & Li, Hengpeng & Desai, Ankur & Nagy, Zoltán & Luo, Juhua & Kolb, Thomas & Olioso, Albert & Xu, Xibao & Yao, Li &Kutsch,Werner Leo & Pilegaard, Kim & Köstner, Barbara & Ammann,Christof. (2014). How is water-use efficiency of terrestrial ecosystems distributed and changing on Earth?. Scientific Reports. 4. 7483. 10.1038/srep07483.
Trends.Earth. Conservation International. Disponibile online su: http://trends.earth. 2022.
UN(2015), Transforming our World: The 2030 Agenda for Sustainable Development, A/RES/70/1, UnitedNations.
UNCCD (2016), Report of the Conference of the Parties on its twelfth session, held in Ankara from 12 to 23 October 2015. Part two: Actions. ICCD/COP(12)/20/Add.1, United Nations Convention to Combat
Desertification, Bonn. http://www.unccd.int/Lists/OfficialDocuments/cop12/20add1eng.pdf.
UNCCD (2017), Good Practice Guidance SDG Indicator 15.3.1 Proportion of land that is degraded over total land area, https://www.unccd.int/sites/default/files/relevant-links/2017- 10/Good%20Practice%20Guidance_SDG%20Indicator%2015.3.1_Version%201.0
UNCCD (2021), Good Practice Guidance SDG Indicator 15.3.1 Proportion of land that is degraded over total land area, Version2.0. United Nations Convention to Combat Desertification, Bonn, Germany.
UNSD (2022), Indicator 15.3.1 Metadata: Proportion of land that is degraded over total land area. Disponbile al sito: https://unstats.un.org/sdgs/metadata/
Munafò, M. (a cura di), 2023. Consumo di suolo, dinamiche territoriali e servizi ecosistemici. Edizione 2023. Report SNPA 37/2023.
There is a lack of historical time series to define more robust trends, as well as national indicators addressing other soil-related threats and issues.
The final estimate is influenced by the update of soil consumption maps using newly available satellite data and by the different approach adopted for calculating productivity. As a result, it is not directly comparable with the percentages presented in previous assessments (2012–2018 and 2012–2019).
Efforts will be made in the future to integrate the indicator with additional parameters as they become progressively available.
FAO,
ISPRA ,
JRC (Joint Research Centre),
SNPA (National System for Environmental Protection)
I sub-indicatori relativi al consumo di suolo sono disponibili al seguente link: https://groupware.sinanet.isprambiente.it/uso-copertura-e-consumo-di-suolo/libraryhttp://54.229.242.119/GSOCmap/
National; Regional
2000-2015
2006-2019
2019-2022
The calculation methodology for indicator 15.3.1 involves the overlay of three sub-indicators (productivity, land cover, and organic carbon) for a baseline period (2000-2015) and a subsequent reporting period (2016-2019). For the Italian context, additional degradation factors were evaluated during the reporting period (2016-2019) and in the biennium 2020-2021.
For the calculation of the first three sub-indicators, the Trends.Earth model in the QGIS environment (http://trends.earth/docs/en/) was used, allowing the processing of historical series of indices and variables from satellite images. Additional factors were incorporated through spatial overlay operations using GIS tools, while the overall degradation was derived from the integration of the different sub-indicators following the “The One Out, All Out” criterion (UNCCD, 2017).
The three sub-indicators referenced in index 15.3.1 were evaluated in a baseline and a reporting period. If the latter is considered as the "state" relative to the initial baseline, following UNCCD guidelines, at the national level, approximately 17.4% of the land is in a state of potential degradation (Table 1).
Indicator 15.3.1 shows overall stability during the considered period (baseline + reporting), with localized deteriorations mainly in Central Italy (Lazio and Umbria) (Table 1).
| Data |
|---|
Headline
Table 1: Results of SDG Indicator 15.3.1 at national and regional level Data source
ISPRA processing based on SNPA mapping Note
2019 update |
Headline
Table 2: Areas (km²) with increased degradation during the periods 2006–2019 and 2019–2022 due to one or more degradation drivers Data source
ISPRA processing based on SNPA mapping Note
2022 update |
Thumbnail
Titolo
Figure 1: Degraded areas as of 2019 according to the SDG 15.3.1 calculation methodology Data source Fonte
ISPRA processing |
Thumbnail
Titolo
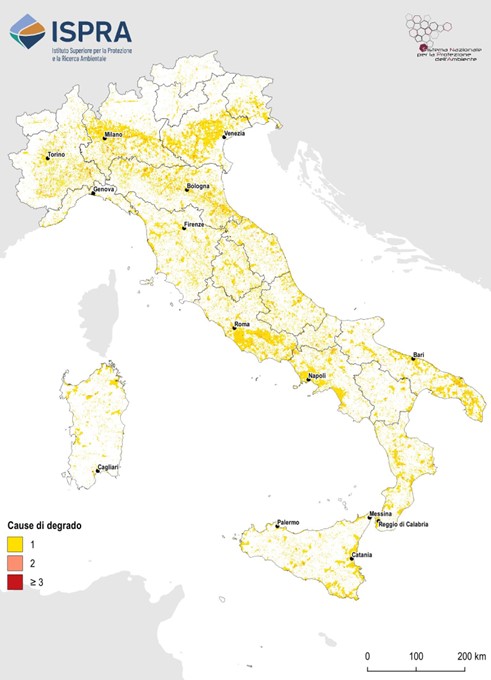
Figure 2: Areas under degradation between 2006 and 2019 due to one or more degradation drivers Fonte
ISPRA processing |
Using the UNCCD approach for calculating indicator 15.3.1, Figure 1 represents the degraded surface considering the two different time intervals (baseline: 2000-2015 and progress/reporting: 2004-2019). The final calculation for 2019, considering the combined contribution of baseline degradation and reporting period degradation (or progress), estimates national degradation at 17.4% (Table 1).
When evaluating the same indicator excluding water bodies that may affect regional surfaces with percentages exceeding 5%, as in the case of Veneto, even small percentage differences allow for a more consistent comparison of territories with different proportions of land and inland waters.
Table 1 presents the values in hectares and percentages of land classified as degraded, stable, and improved. Focusing only on degradation, the different conditions of central regions compared to other divisions become evident: Lazio and Umbria are the regions with the highest degradation percentages (35.4% and 33.8%, respectively), while Sardinia has the largest degraded area in absolute terms, with 641,000 hectares, slightly exceeding the degraded land in Lazio (602,000 hectares).
Comparing the periods 2006-2019 and 2019-2022 (Table 2), it is evident that the considered degradation factors heavily impact numerical estimates, given that the period 2019-2022 does not include the SDG 15.3.1 sub-indicators (land cover, productivity, and organic carbon content variation). During the reporting period, in which additional supplementary factors were incorporated into the three sub-indicators provided by the methodology, it is clear that degradation is more concentrated in plains and urban areas, in line with the evolving trends of soil consumption (Figure 2).