Maria Camilla Mignuoli, Massimo Peleggi, Silvana Salvati
The indicator provides the percentage of groundwater monitoring stations divided into quality classes according to the average concentration of nitrates detected over a four-year monitoring period 2020-2023.
The classes typically represent conditions ranging from a low concentration of nitrates (good quality water) to high levels of contamination (at risk or polluted water). At a national level, 69.1% of monitoring stations have average nitrate concentration values lower than 25 mg/l (good quality water); while 11.7% of the monitored stations recorded an average nitrate concentration greater than or equal to 50 mg/l (polluted water). Comparing the values of the four-year period 2020-2023 with the previous one (2016-2019), a decrease in the average concentration is highlighted in 38.8% of the stations, an increase in 26.9% and stability in 34.4%.
The monitoring of nitrates in groundwater is carried out in accordance with the Nitrates Directive (Directive 91/676/EEC) which aims to protect waters from pollution caused or induced by nitrates of agricultural origin. This monitoring is aimed at: identifying polluted waters and those that could be polluted if no action is taken with specific measures, the designation and review of vulnerable zones (areas that discharge into polluted waters or that could be polluted if no action is taken and which contribute to pollution) and the evaluation of the effectiveness of Action Programs (a series of binding measures intended to prevent and reduce nitrate pollution, including for example those of codes of good agricultural practice). If groundwater contains more than 50 mg/l of nitrates or could contain more than 50 mg/l of nitrates if specific measures are not taken, they should be identified as polluted water or water that could be polluted. The quality classes, represented by different colors and compliant with the scheme of the European Guidelines, are divided from worst to best as follows: red for concentrations ≥ 50 mg/l; orange for values between 40 and 49.99 mg/l; yellow for values between 25 and 39.99 mg/l and green for values between 0 and 24.99 mg/l. Similarly, the trend quality classes are classified from worst to best as: red for strong increase > 5 mg/l; orange for weak increase from +1 to 5 mg/l; yellow for stability from -1 to +1 mg/l; green for a weak drop from -5 to -1 mg/l and blue for a strong drop below -5 mg/l. For each concentration and trend quality class, the percentage of groundwater monitoring sites out of the total falling into that class is indicated.
Evaluate the impact of human activities linked to the introduction of nitrates into groundwater in the medium - long term. These activities can be traced back to the use of fertilizers for agricultural crops, the presence of livestock farms, with particular regard to intensive livestock farming and the untreated waste water that reaches the groundwater by percolation.
Nitrate Directive 91/676/EEC - art. 10
Directive 2000/60/EC
Legislative Decree 152/2006
Legislative Decree 30/2009
Ministerial Decree 6/7/2016
Nitrates Directive 91/676/EEC - Status and trends of aquatic environment and agricultural practice - Guidelines for reporting under Article 10 - Revised Version January 2024
Reference value of nitrate concentration in groundwater: 50 mg/l
Report pursuant to article 10 of Directive 91/676/EEC ITALY - Four-year period 2016-2019
Report pursuant to article 10 of Directive 91/676/EEC ITALY - Four-year period 2020-2023
European Commission website on Nitrates Directive: https://environment. ec. europa. eu/topics/water/nitrates_en Report from the commission to the council and the European Parliament on the implementation of Council Directive 91/676/EEC concerning the protection of waters against pollution caused by nitrates from agricultural sources based on Member State reports for the period 2016–2019
https://eur-lex. europa. eu/legal-content/EN/TXT/? uri=COM%3A2021%3A1000%3AFIN&qid=1633953687154
SINTAI
SINTAI - https://www. sintai. isprambiente. it - Section Directive 91/676 > Access to Nitrate reporting data
National, regional
2012-2023
Each monitoring station, based on the average concentration of nitrates detected in the period in question, is assigned to one of the four quality classes and for each class the percentage of stations compared to the total stations analyzed is calculated. Furthermore, the trend is calculated for each station common to the two four-year periods, as the difference between the average nitrate value of the four-year period 2020-2023 and that of the previous four-year period 2016-2019. On the basis of the trend, each station is assigned to one of the five classes and for each class the percentage of stations compared to the total stations analyzed is calculated.
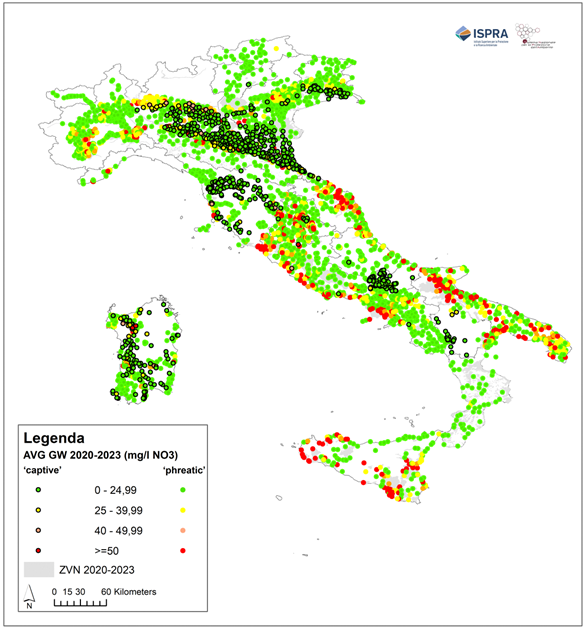
In the four-year period 2020-2023, the results relating to the distribution of monitoring stations in the different quality classes (0-24.99 mg/l; 25-39.99 mg/l; 40-49.99 mg/l; ≥50 mg/l) highlighted that, out of 4,581 sampling points, 69.1% of the stations have an average concentration of nitrates in the four-year period lower than 25 mg/l, while 11.7% recorded an average concentration greater than or equal to 50 mg/l of nitrates (Table 2, Figure 1).
From the analysis of the trend between the previous four-year period (2016-2019) and the current one (2020-2023), a decrease in the average concentration of nitrates was found in 38.8% of the 3,883 common stations between the two four-year periods, compared to an increase recorded in only 26.9% of the same stations. A stable trend prevails over all (34.6% of stations) (Table 3, Figure 2).
| Allegati |
|---|
Thumbnail
Titolo
Figure 1: Average nitrate concentration values in groundwater monitoring sites for the period 2020-2023 Fonte
ISPRA processing on SINTAI data |
Thumbnail
Titolo
Figure 2: Trends in average nitrate concentration values in groundwater monitoring sites between the four-year period 2016-2019 and the four-year period 2020-2023 Fonte
ISPRA processing on SINTAI data |
Titolo
Table 1: Number of groundwater monitoring stations in the four-year period 2016-2019 and 2020 – 2023 Fonte
ISPRA processing on SINTAI data Note
n. d.: the type of aquifer was not indicated |
Titolo
Table 2: Distribution of groundwater monitoring stations in different quality classes Fonte
ISPRA processing on SINTAI data |
Titolo
Table 3: Percentage distribution of groundwater monitoring sites compared to the trend in average nitrate concentration between the four-year periods 2016-2019 and 2020-2023 Fonte
ISPRA processing on SINTAI data |
As part of the regional nitrate network, the ARPA/APPA carry out monitoring activities of the concentration of nitrates in sampling stations that are affected by pressures of agricultural origin and forward the data to ISPRA. Every four years ISPRA sends a report to the European Commission on the state of implementation of the Nitrates Directive (Directive 91/676/EEC) on the national territory.
With reference to the period 2020-2023, the number of stations varies from a maximum of 496 in Umbria, to a minimum of 28 in the province of Trento, for a total of 4,581 stations (Table 2). Valle d'Aosta and the province of Trento have the highest percentage of stations with an average concentration <25 mg/l NO3, while Sicily records the highest percentage of stations with an average concentration ≥50 mg/l NO3 (Table 2, Figure 1).
Analyzing the trend between the four-year period 2020-2023 and the previous one 2016-2019, in Calabria we observe the highest percentage of stations (90.5%) in which an increase in the average concentration of nitrates was detected, while in the Marche we note the lowest percentage of stations (55.4) in which a decrease in the average concentration of nitrates was detected.
Land areas that discharge into waters having a nitrate concentration greater than 37.5 mg/l and showing an increasing trend must be designated as vulnerable zones. The Action Program applies to these areas, i. e. Measures aimed at preventing and reducing nitrate pollution (Figure 1).
In the four-year period 2020-2023, the number of monitoring stations for underground water bodies remained substantially stable compared to the previous four-year period 2016-2019, with 4,581 stations in the first period compared to 4,612 in the second, of which 3,883 are common to both. Overall, the 2020-2023 monitoring network compared to the 2016-2019 network was subjected to changes in relation to the location of the stations due above all to the variations that occurred in the territory. Some stations were removed and replaced with alternative stations (new or merged with similar stations), other stations were not monitored (temporarily removed) because in the period 2016-2019 values lower than 25 mg NO3/l were detected and, as required by the Nitrates Directive, monitoring can be carried out in these stations every eight years. Regarding the removed stations, the regions reported the reason for the removal and mainly it appears that these are stations located in wells that are no longer accessible. In general it is possible to assert that the majority of the monitored aquifers are characterized by a stationary situation with regards to nitrate contamination.