NITRATES IN GROUNDWATER
Data aggiornamento scheda:
The indicator provides the percentage of groundwater monitoring stations divided into quality classes according to the average concentration of nitrates detected over a four-year monitoring period 2020-2023.
The classes typically represent conditions ranging from a low concentration of nitrates (good quality water) to high levels of contamination (at risk or polluted water). At a national level, 69.1% of monitoring stations have average nitrate concentration values lower than 25 mg/l (good quality water); while 11.7% of the monitored stations recorded an average nitrate concentration greater than or equal to 50 mg/l (polluted water). Comparing the values of the four-year period 2020-2023 with the previous one (2016-2019), a decrease in the average concentration is highlighted in 38.8% of the stations, an increase in 26.9% and stability in 34.4%.
STATE OF IMPLEMENTATION OF THE OPTIMAL TERRITORIAL AREA PLANS
Data aggiornamento scheda:
The Area Plans (PdA) in the context of water resources management represent a tool for planning and scheduling the activities of the Integrated Water System (SII) or public services for the collection, supply and distribution of water for civil uses, sewerage and waste water purification. The indicator provides on a national scale a picture of the Area Plans currently in force in the Optimized Territorial Areas (ATO) into which the territory is divided in implementation of the current legislation. Currently the national territory is divided into 62 ATOs delimited by the regions on the basis of rules contained in the Environmental Code (Legislative Decree 3 April 2006, n. 152, Part III). 57 of the 62 ATOs are equipped with a PdA (although not recently approved).
NITRATES IN SURFACE WATER
Data aggiornamento scheda:
The indicator provides the percentage of surface water monitoring stations divided into quality classes according to the average concentration of nitrates detected and in the four-year period 2020-2023, in order to provide an overview of the level of nitrate pollution. The classes typically represent conditions ranging from a low concentration of nitrates (good quality water) to high levels of contamination (at risk or polluted water). At a national level, 95.3% of monitoring stations have average nitrate concentration values lower than 25 mg/l (good quality water); while 0.6% of the monitored stations recorded an average nitrate concentration greater than or equal to 50 mg/l (polluted water). Comparing the values of the four-year period 2020-2023 with the previous one (2016-2019) shows a decrease in the average concentration in 22.4% of the stations, an increase in 20.6% and stability in 57% of the stations.
STATE OF PROGRESS OF THE ACTION PROGRAMS FOR THE PROTECTION AND REMEDIATION OF WATERS FROM POLLUTION CAUSED BY AGRICULTURAL NITRATES
Data aggiornamento scheda:
In implementation of Directive 91/676/EEC (Nitrate Directive), Legislative Decree 3 April 2006, n. 152, in article 92, paragraph 7, provides that the regions adopt and implement the mandatory action programs (PdA) for the protection and restoration of waters from pollution caused by nitrates of agricultural origin in the areas designated as vulnerable to nitrates (ZVN). Paragraph 8-bis of the aforementioned article 92 provides that the regions review and, if necessary, revise the mandatory action programs at least every four years. The PdA, together with the further measures undertaken in compliance with the Nitrates Directive (for example, designation of vulnerable zones), constitute basic measures of the programs of measures of the Water Protection Plans (art. 121 of Legislative Decree 152/2006) and of the River Basin Management Plans (art. 117 of Legislative Decree 152/2006) and, as such, contribute to the achievement of the objectives of the Water Framework Directive 2000/60/EC.
All the regions in which zones vulnerable to nitrates have been designated for at least a year have adopted the relevant Action Programme.
PRESSURE ON WATER BODIES
Data aggiornamento scheda:
The indicator provides a national-level picture of the types of pressures acting on surface and groundwater bodies. This information derives from the reporting of the 3rd Water Management Plans drawn up by the District Basin Authorities in accordance with the provisions of the Water Framework Directive 2000/60/EC (WFD) which requires an examination of the impact of human activities on the state of the waters to be carried out. From the analysis of the data it is observed that the main type of pressure that impacts both categories of water, surface and underground, is that of the diffuse type for agricultural use. Subsequently, surface water bodies are impacted by hydromorphological pressure while underground water bodies are impacted by withdrawals.
STATE OF PROGRESS OF THE MANAGEMENT PLANS OF THE RIVER DISTRICTS
Data aggiornamento scheda:
The Water Framework Directive 2000/60/EC (WFD) provides for the review and updating of river basin management plans (PdG) within 15 years of the entry into force of the directive itself and, subsequently, every six years (art. 13). Therefore, in implementation of this indication, in order to develop the planning cycle relating to the period 2015-2021, the review and update of the first Plans adopted in 2010 was started in 2012. The process concluded with the approval of the plans between March and June 2016. Subsequently, the preparation of the second update of the Plans began, as required by the art. 117 paragraph 2bis of Legislative Decree 152/2006. The update concluded in December 2021 with the adoption of the PdG (for all the river basin districts) by the Permanent Institutional Conference. The Water Protection Plans (PTA) are the plans through which the regions, on the basis of the objectives set at the hydrographic district scale by the Master Plans, define the interventions aimed at guaranteeing the achievement or maintenance of the quality objectives of the water bodies and the measures necessary for their qualitative and quantitative protection at a regional level. As of October 2025, six regions and the autonomous provinces of Trento and Bolzano have an updated PTA based on the 2021 PdGs. Another six regions have a PTA adopted or approved after the publication of the 2015 PdGs. The remaining regions (seven) have a PTA dating back to a period prior to the publication of the 2015 PdGs.
Between 2024 and 2025, three regions updated the PTA to align it with the latest management cycle of the 2021 PdG (Lazio, Valle d'Aosta and Basilicata).
INLAND SURFACE WATERS – BIOLOGICAL QUALITY ELEMENTS IN RIVERS
Data aggiornamento scheda:
The indicator derives from the application of the reference legislation for the determination of the ecological status of surface water within the meaning of Directive 2000/60/EC. For 2023, as part of the Soe WISE2 data stream, data on 694 monitoring stations for the EQB Macrobenthos were transmitted, which in 55% of them reached the "good or higher" ecological status. In the remaining 45% of the stations there is a state of lower quality than the good. For the EQB Diatomee in 2023, data from 591 monitoring stations were transmitted: in 74% of them there was a "good or higher" ecological status, the remaining 26% has an ecological status lower than the voucher.
INLAND SURFACE WATERS – BIOLOGICAL QUALITY ELEMENTS IN LAKES
Data aggiornamento scheda:
The indicator derives from the application of the reference legislation for the determination of the ecological status of surface water within the meaning of Directive 2000/60/EC. From the data transmitted in the SoE WISE2 flow referring to 2023, it is noted that the EQB Fitoplankton was monitored at 151 stations and in 72% of them reached the "good or higher" ecological status. In the remaining 28% of the stations there is a state of lower quality than good.
WASTEWATER TREATMENT PLANTS - COMPLIANCE OF THE URBAN WASTEWATER SEWAGE SYSTEM
Data aggiornamento scheda:
The presence or absence of a sewage network and the percentage of wastewater conveyed into collection systems indicate the degree of compliance with the requirements of the applicable regulations. In 2022-2023, the national compliance rate is 99.1%. Of the organic load, 95.7% is conveyed into the sewer system, 3.6% is treated through individual systems, while 0.7% is not connected.
WASTEWATER TREATMENT PLANTS - COMPLIANCE OF URBAN WASTEWATER TREATMENT SYSTEMS
Data aggiornamento scheda:
Compliance monitoring allows for an understanding of the technological adaptation status of urban wastewater treatment systems for agglomerations greater than or equal to 2,000 PE (Population Equivalent). This is particularly useful for planning potential actions aimed at water protection.
Between 2022 and 2023, out of the 3,037 agglomerations analyzed, approximately 77% were found to be compliant, 13.8% non-compliant, 4.6% partially compliant, and 4.6% with data unavailable. A 100% compliance rate is recorded in Piedmont, Emilia-Romagna, Umbria, and the Autonomous Provinces of Trento and Bolzano.
PERCENTAGE OF TREATED WASTEWATER
Data aggiornamento scheda:
The percentage of treated wastewater reflects the amount of biodegradable organic load that reaches urban wastewater treatment plants compared to the total organic load produced by agglomerations (2,000 PE or more) across the national territory. In 2022-2023, this percentage is 93.51%, an increase compared to 2020 (93.3%).
CHEMICAL STATUS OF INLAND SURFACE WATERS
Data aggiornamento scheda:
The indicator provides an assessment of the chemical quality of Italian surface water bodies. The chemical status is evaluated based on the concentration of chemical substances in the water and biota matrices, specifically those listed in the Priority Substances List (Table 1/A of Legislative Decree 152/2006 and subsequent amendments). These substances are classified as priority, priority hazardous, and other substances.
For each substance in the Priority Substances List, Italian legislation—implementing European Directives—establishes Environmental Quality Standards (EQS) that must be met for a water body to be classified as having good chemical status. The chemical status, together with the ecological status, contributes to the overall “environmental status” evaluation of each water body.
The indicator was developed using classification data from the WISE Reporting of the 3rd River Basin Management Plan (RBMP). At both the national and district levels, an increase in the number of water bodies classified as having good chemical status has been observed for rivers and lakes, along with a decrease in the number of unclassified water bodies, compared to the previous cycle.
QUANTITATIVE STATUS OF GROUNDWATER (SQUAS)
Data aggiornamento scheda:
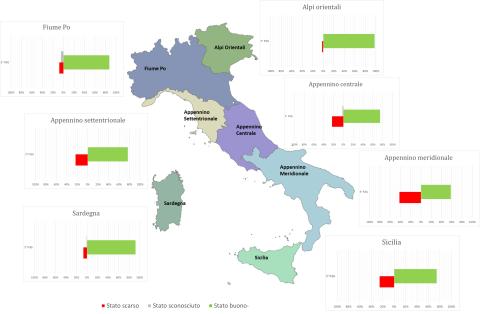
The quantitative status of groundwater describes the balance of a water body in terms of the relationship between extraction and natural replenishment of the water resource. A groundwater body is defined as being in "good quantitative status" if groundwater levels ensure that the annual average withdrawals for long-term anthropogenic activities do not exhaust the available groundwater resources, do not cause damage to surface waters and connected ecosystems, and do not lead to saline intrusion or other types of contamination.
This indicator has been derived from the classification data of water bodies in the WISE Reporting of the 3rd Water Management Plan (WMP). Nationally, during the 2016-2021 classification period under the 3rd WMP, an increase in groundwater bodies classified as being in "good quantitative status" was observed, reaching 79% of the total (compared to 61% in the 2nd WMP). The percentage of groundwater bodies in "poor" status is 19%, while 2% remain unclassified. At the district level, the percentages of water bodies achieving "good quantitative status" range from 98% in the Eastern Alps District to 58% in the Southern Apennine District.
CHEMICAL SUBSTANCES IN GROUNDWATER
Data aggiornamento scheda:
Chemical monitoring of groundwater bodies during the period 2018–2020 revealed that the most critical anthropogenic substances on a national scale for chemical status are nitrates and trichloromethane. Among the various substances of potential natural origin present in groundwater bodies, electrical conductivity—related to the presence of chlorides—stands out as an excellent indicator of groundwater salinization. This salinization can stem from marine origins in coastal aquifers or from deep fossil waters.
Between 2014 and 2020, nitrate concentrations remained stable in 78.8% of the monitoring stations, decreased in 11.8%, and increased in the remaining 9.4%. The regions of Abruzzo and Emilia-Romagna reported the highest percentages of stations with decreasing trends (22.8%), while Lazio recorded the highest percentage of stations with increasing trends (20.6%).
Trichloromethane concentrations were stationary in 72.6% of the stations, showed a decreasing trend in 24.9%, and an increasing trend in only 2.5%. High percentages of stations with decreasing trends were observed in Marche (81.4%) and Piedmont (70.7%).
Electrical conductivity trends were stationary in 78.6% of the stations, decreasing in 4.6%, and increasing in the remaining 16.8%. Emilia-Romagna recorded the highest value for decreasing trends (14.5%), while Lazio had the highest percentage of increasing trends (25%).
MAIN MEASURES FOR WATER BODIES
Data aggiornamento scheda:
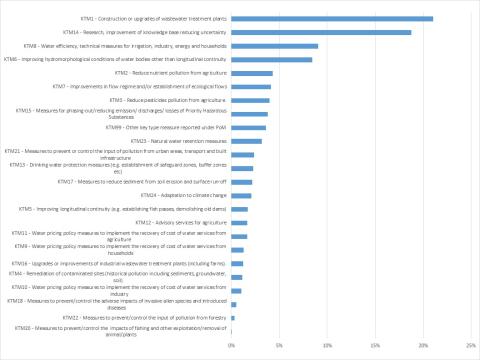
The Water Framework Directive (WFD) - Directive 2000/60/EC - requires that for each river basin district, within the River Basin Management Plan (RBMP), also known as the Water Management Plan (WMP), a "Program of Measures" (PoM) is established. This program, based on the analyses carried out, should enable the achievement of environmental objectives set by the directive (a "good" status for natural water bodies; a "good" potential for heavily modified or artificial water bodies) by 2015. Environmental quality objectives can be exempted or extended in specific cases explicitly provided for by the WFD.
The WFD distinguishes between "basic measures" and "supplementary measures." The former essentially consist of applying measures required by other specific directives (e.g. Nitrates Directive, Habitats Directive) and are listed in Part A of Annex VI of the WFD; the latter are additional measures (e.g. river restoration, knowledge enhancement, fiscal tools) and are included in Part B of Annex VI in a non-exhaustive list.
Given the variety and level of detail of the measures, for reporting purposes, the measures in the PoM are grouped into 25 macro-categories, the "Key-Type of Measures" (KTM). Each KTM serves to mitigate the impact of one or more pressures, and it is possible to link them to each other. In other words, for each KTM, the percentage of significant pressure types these measures aim to mitigate can be represented.
The processed information comes from the six-yearly reporting of Water Management Plans prepared by the district basin authorities as required by the Water Framework Directive -2000/60/EC. The data refer to the period 2010–2015.
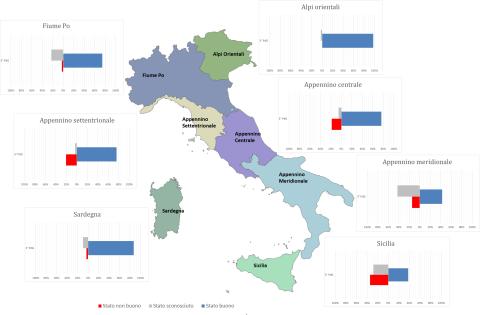
CHEMICAL STATUS OF GROUNDWATER (SCAS)
Data aggiornamento scheda:
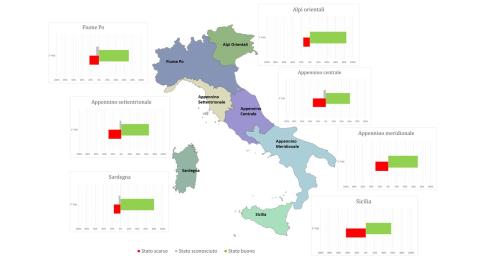
The Chemical Status of Groundwater (SCAS) indicator assesses the chemical quality of Italian groundwater bodies by comparing pollutant concentrations with the Environmental Quality Standards and Threshold Values specified in Tables 2 and 3 of Ministerial Decree (DM) 6/7/2016.
Depending on whether these concentration limits are met, a groundwater body is classified as having either good or poor chemical status. This classification, along with quantitative status, determines the overall groundwater condition. The indicator is based on data from the classification of water bodies reported in WISE Reporting for the 3rd River Basin Management Plan (RBMP).
At the national level, during the 2016-2021 classification period related to the 3rd RBMP, there was an increase in groundwater bodies classified as having good chemical status, reaching 70% of the total (compared to 58% in the 2nd RBMP). The percentage of water bodies classified as poor was 27%.
At the district level, the percentage of groundwater bodies with good chemical status ranges from 56% in the Sicily District to 85% in the Eastern Alps District. Across all hydrographic districts, the number of water bodies with unknown status has significantly decreased compared to the previous cycle, with all water bodies now classified in the Eastern Alps, Southern Apennines, and Sicily Districts.
ECOLOGICAL STATUS OF INLAND SURFACE WATERS
Data aggiornamento scheda:
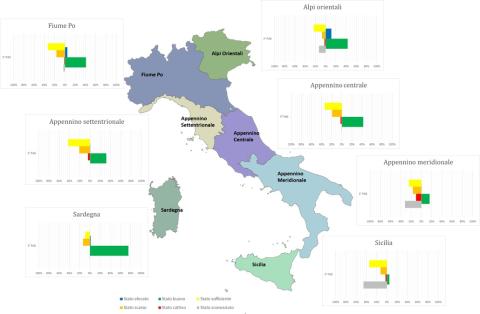
The ecological status of surface waters reflects the quality of the structure and functioning of aquatic ecosystems. Directive 2000/60/EC (transposed in Italy with Legislative Decree 152/2006) mandates the achievement of "good" quality status for water bodies, which is determined by the assessment of both ecological and chemical status. The indicator provides an evaluation of the ecological status of surface water bodies—specifically inland waters—based on classification data from the WISE 2022 Reporting related to the 3rd Water Management Plan. At the national level, comparing the ecological quality status data between the 2nd and 3rd Management Plans shows a reduction in water bodies with unknown status, from 18% to 10%, though they are still present. In general, the ecological status has not significantly changed from the previous management cycle, except for the percentage of lakes in good status, which has increased from 17% to 35%.
CHEMICAL SUBSTANCES IN SURFACE WATERS
Data aggiornamento scheda:
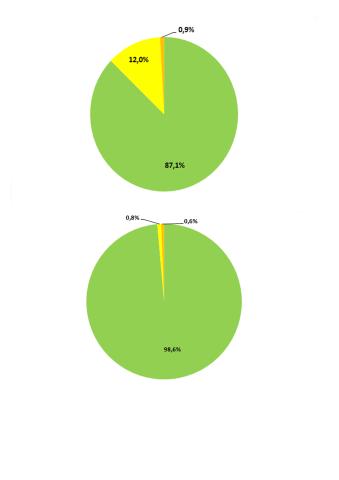
In 2017, chemical monitoring of watercourses was conducted by ARPA/APPA at a total of 1,867 monitoring stations across 15 regions and 2 autonomous provinces.
The indicator's representation considered both the Environmental Quality Standards - Annual Average (EQS-AA) and Environmental Quality Standards - Maximum Allowable Concentration (EQS-MAC) for surface waters, as defined in Legislative Decree 172/2015.
At the national level, 87.1% of stations showed no exceedances of EQS-AA, and 98.6% of stations showed no exceedances of EQS-MAC.