Francesca Archi, Francesca Piva

The ecological status of surface waters reflects the quality of the structure and functioning of aquatic ecosystems. Directive 2000/60/EC (transposed in Italy with Legislative Decree 152/2006) mandates the achievement of "good" quality status for water bodies, which is determined by the assessment of both ecological and chemical status. The indicator provides an evaluation of the ecological status of surface water bodies—specifically inland waters—based on classification data from the WISE 2022 Reporting related to the 3rd Water Management Plan. At the national level, comparing the ecological quality status data between the 2nd and 3rd Management Plans shows a reduction in water bodies with unknown status, from 18% to 10%, though they are still present. In general, the ecological status has not significantly changed from the previous management cycle, except for the percentage of lakes in good status, which has increased from 17% to 35%.
The ecological status is based on the evaluation of Biological Quality Elements (BQEs) monitored in water bodies. These elements are selected based on the analysis of pressures and impacts, supported by the physicochemical characteristics of the water column, chemical elements (specific pollutants), and hydromorphological features of the water body.
The BQEs monitored in inland surface waters include:
- Macroinvertebrates
- Macrophytes
- Fish fauna
- Phytobenthos (diatoms) in rivers
- Phytoplankton in lakes
Ecological status classification is carried out by calculating the Ecological Quality Ratio (EQR), which is the ratio between the value of the monitored quality element calculated using specific metrics and its value under reference conditions (evaluated at sites with no or negligible anthropogenic pressures).
The status is expressed in five quality classes: High, Good, Moderate, Poor, and Bad. The status of a water body is determined by the lowest value, following the "one-out, all-out" principle of Directive 2000/60/EC, among the statuses of individual biological quality elements and the chemical status of specific pollutants, assessed based on exceeding quality standard values.
To verify, every six years, the effectiveness of measures implemented by the competent administrations to contain pressures and, consequently, to achieve the "good" status within the deadlines set by current legislation.
Directive 2000/60/EC, Legislative Decree No. 152/2006 and subsequent amendments, Law No. 221/2015
Legislative Decree No. 152/2006, implementing Directive 2000/60/EC, defines the good ecological status of surface waters as the condition in which "the values of the biological quality elements of the type of surface water body show low levels of distortion due to human activity but only slightly deviate from those normally associated with the type of undisturbed surface water body." The achievement of this goal was initially set for 2015, with updates every six years.
- Reporting WISE 3rd Water Management Plan for Hydrographic Districts (updated October 2022)
- Reporting WISE 2nd Water Management Plan (March 2017)
District Basin Authorities, Autonomous Provinces, Regions, SNPA (National System for Environmental Protection)
WISE Reporting of the 3rd Water Management Plan (October 2022)
WISE Reporting of the 2nd Water Management Plan (March 2017)
National, Hydrographic Districts
2016-2021, 2010-2015
Using data from the district databases of Reporting WISE for the 2nd and 3rd Water Management Plans, the number and percentage of water bodies in the different ecological status classes and those not yet classified were calculated at both district and national levels. For each district, comparisons can be made between numerical and percentage data on the ecological status achieved in the 2nd and 3rd Management Plans.
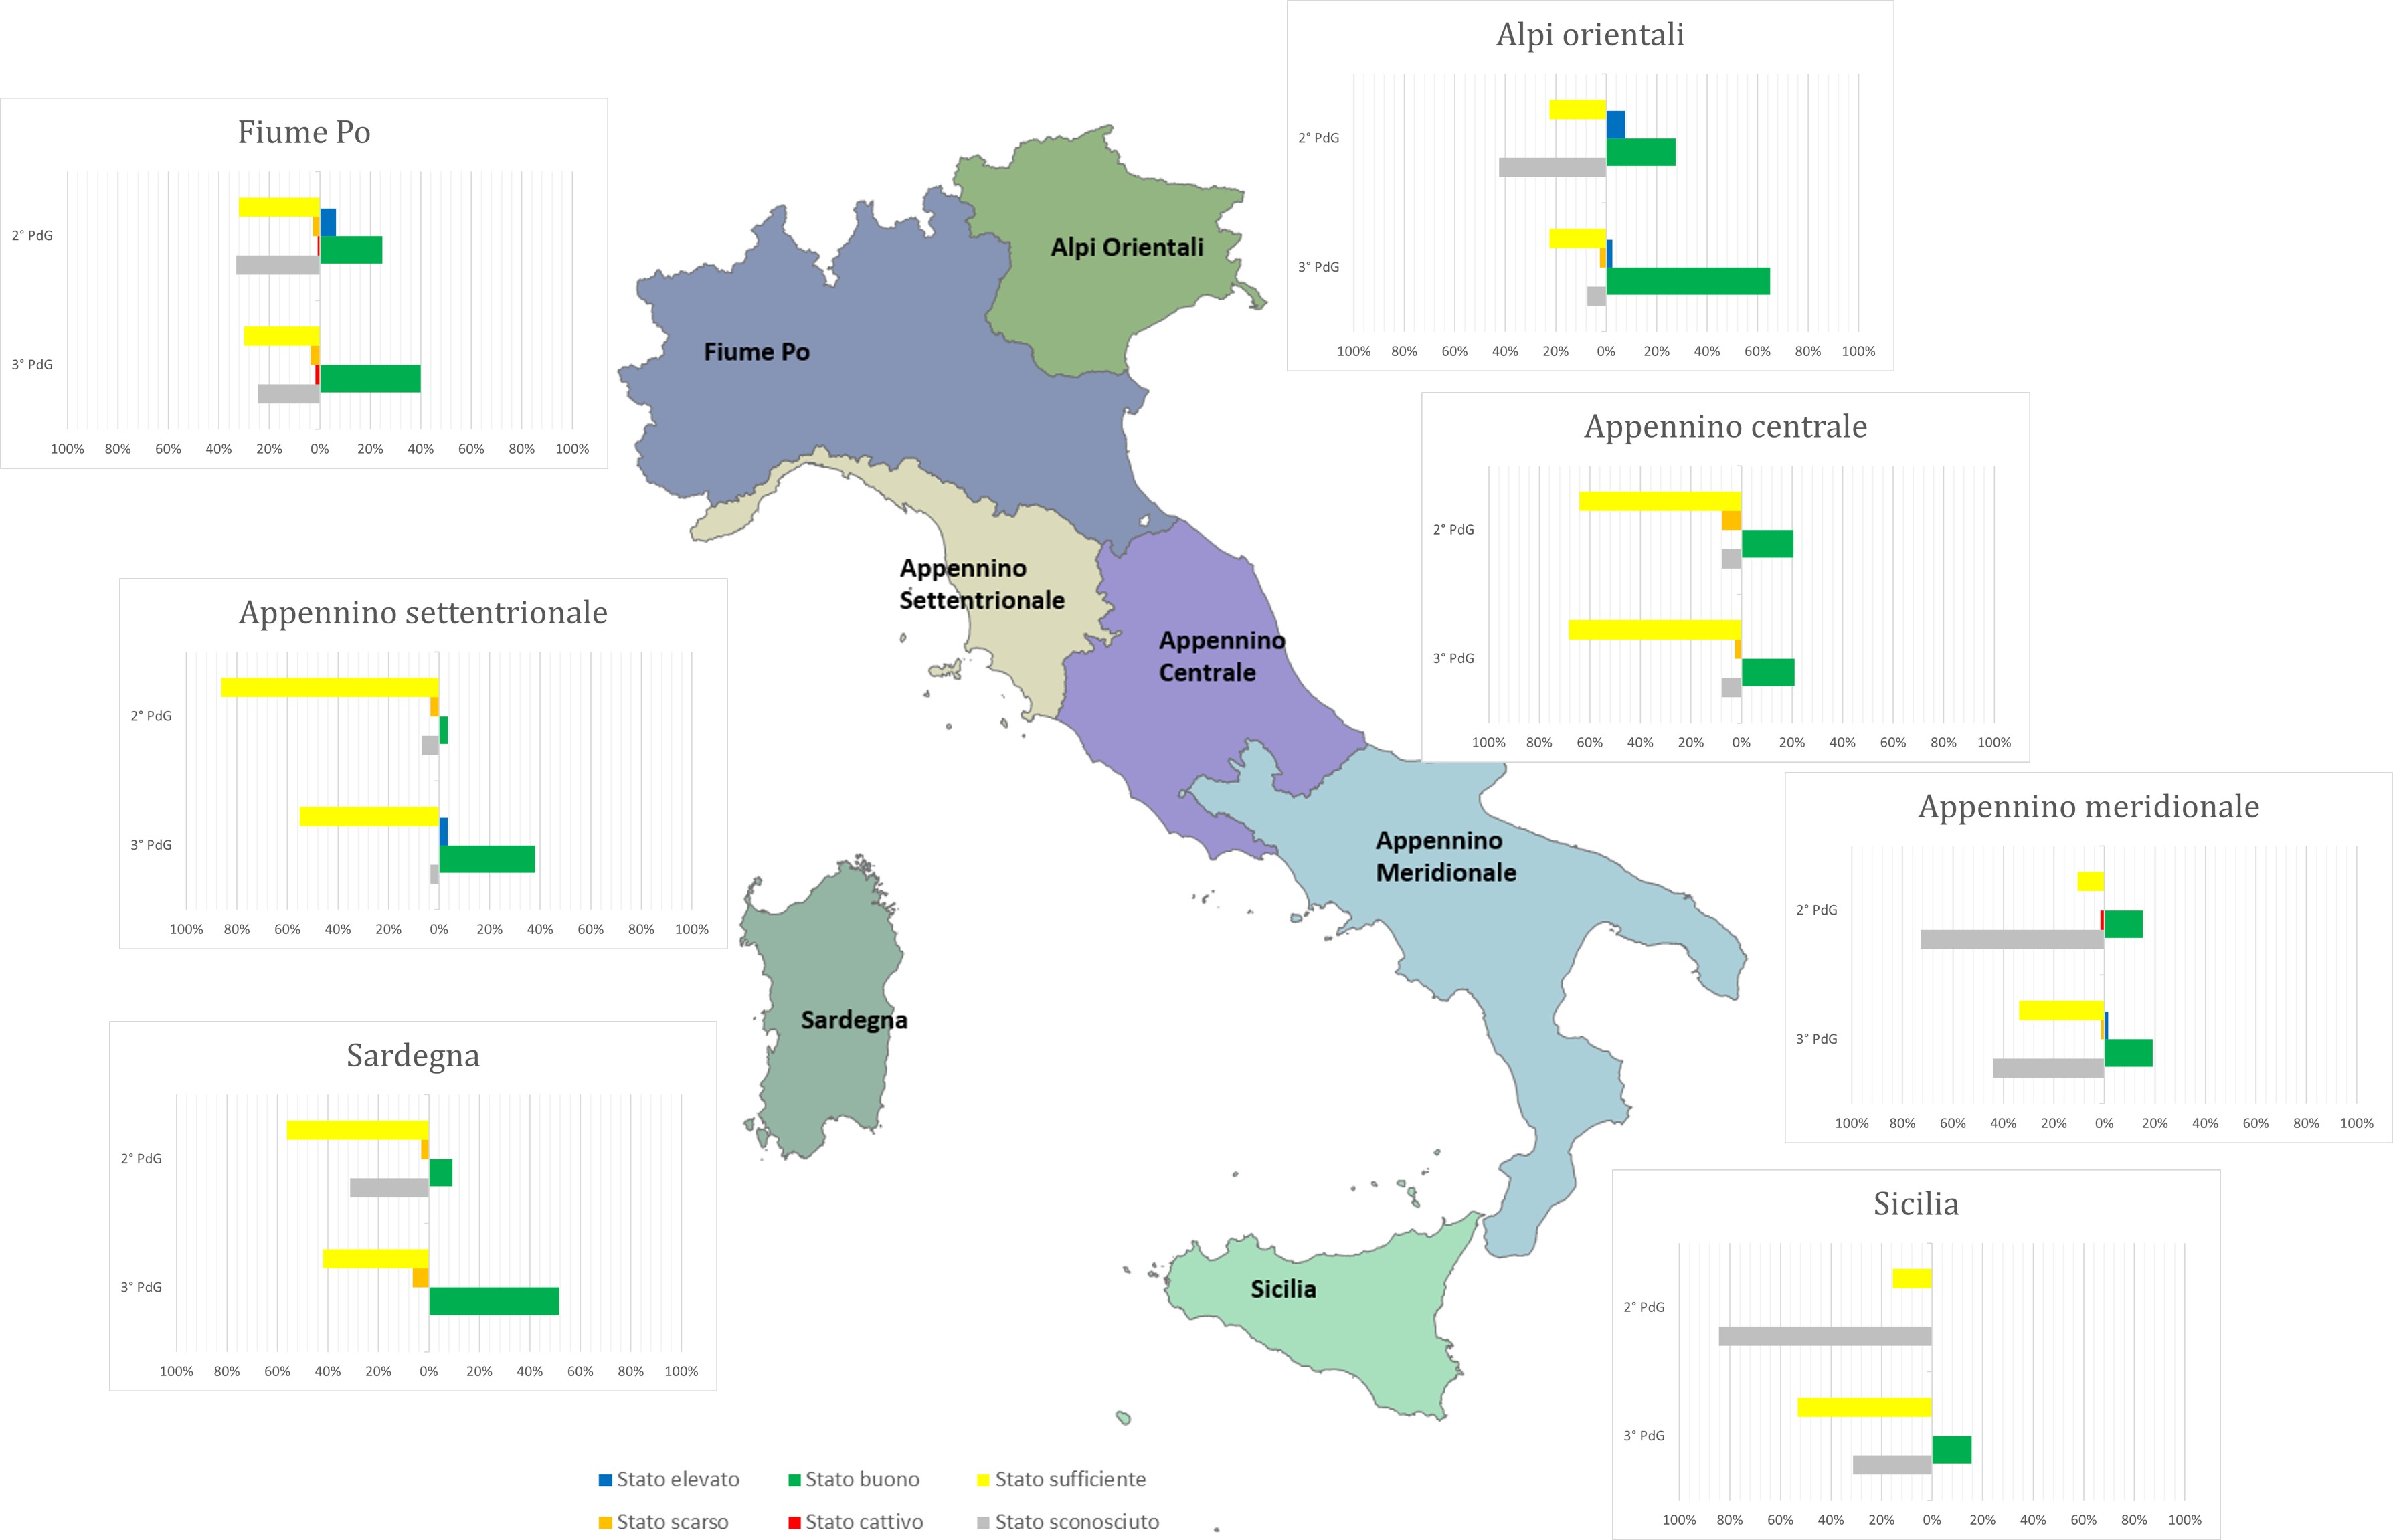
The analysis of inland surface waters at the national level shows that water bodies in good and high ecological status amount to 43%. The Sardinia District presents a percentage of water bodies achieving the ecological quality objective at 75%. The Sicily and Southern Apennine Districts still have a high number of water bodies with unknown status, at 44% and 33%, respectively.
The temporal coverage of the indicator currently does not allow for the identification of a trend.
| Data |
|---|
Thumbnail

Titolo
Figure 2a: Ecological state of surface water bodies - rivers - Comparison 2nd cycle (2015-2021) and 3rd cycle (2021-2027) of Water Management Plans Fonte
ISPRA processing on WISE reporting data - monitoring 2010-2015 and 2015-2021 (October 2022 update) Legenda
PdG = Management Plan |
Thumbnail

Titolo
Figure 1b: Ecological state of surface water bodies – lakes - 3rd cycle (2021-2027) of Water Management Plans Fonte
ISPRA processing on WISE reporting data - monitoring 2015-2021 (October 2022 update) Legenda
PdG = Management Plan |
Thumbnail
Titolo
Figure 2b: Ecological state of surface water bodies - lakes- Comparison 2nd cycle (2015-2021) and 3rd cycle (2021-2027) of Water Management Plans Fonte
ISPRA processing on WISE reporting data - monitoring 2010-2015 and 2015-2021 (October 2022 update) Legenda
PdG = Management Plan |
Thumbnail
Titolo
Figure 3a: National ecological state of surface water bodies – rivers - Comparison 2nd cycle (2015-2021) and 3rd cycle (2021-2027) of Water Management Plans Fonte
ISPRA processing on WISE reporting data - monitoring 2010-2015 and 2015-2021 (October 2022 update) Legenda
PdG = Management Plan |
Thumbnail

Titolo
Figure 3b: National ecological state of surface water bodies – lakes - Comparison 2nd cycle (2015-2021) and 3rd cycle (2021-2027) of Water Management Plans Fonte
ISPRA processing on WISE reporting data - monitoring 2010-2015 and 2015-2021 (October 2022 update) Legenda
PdG = Management Plan |
Thumbnail

Titolo
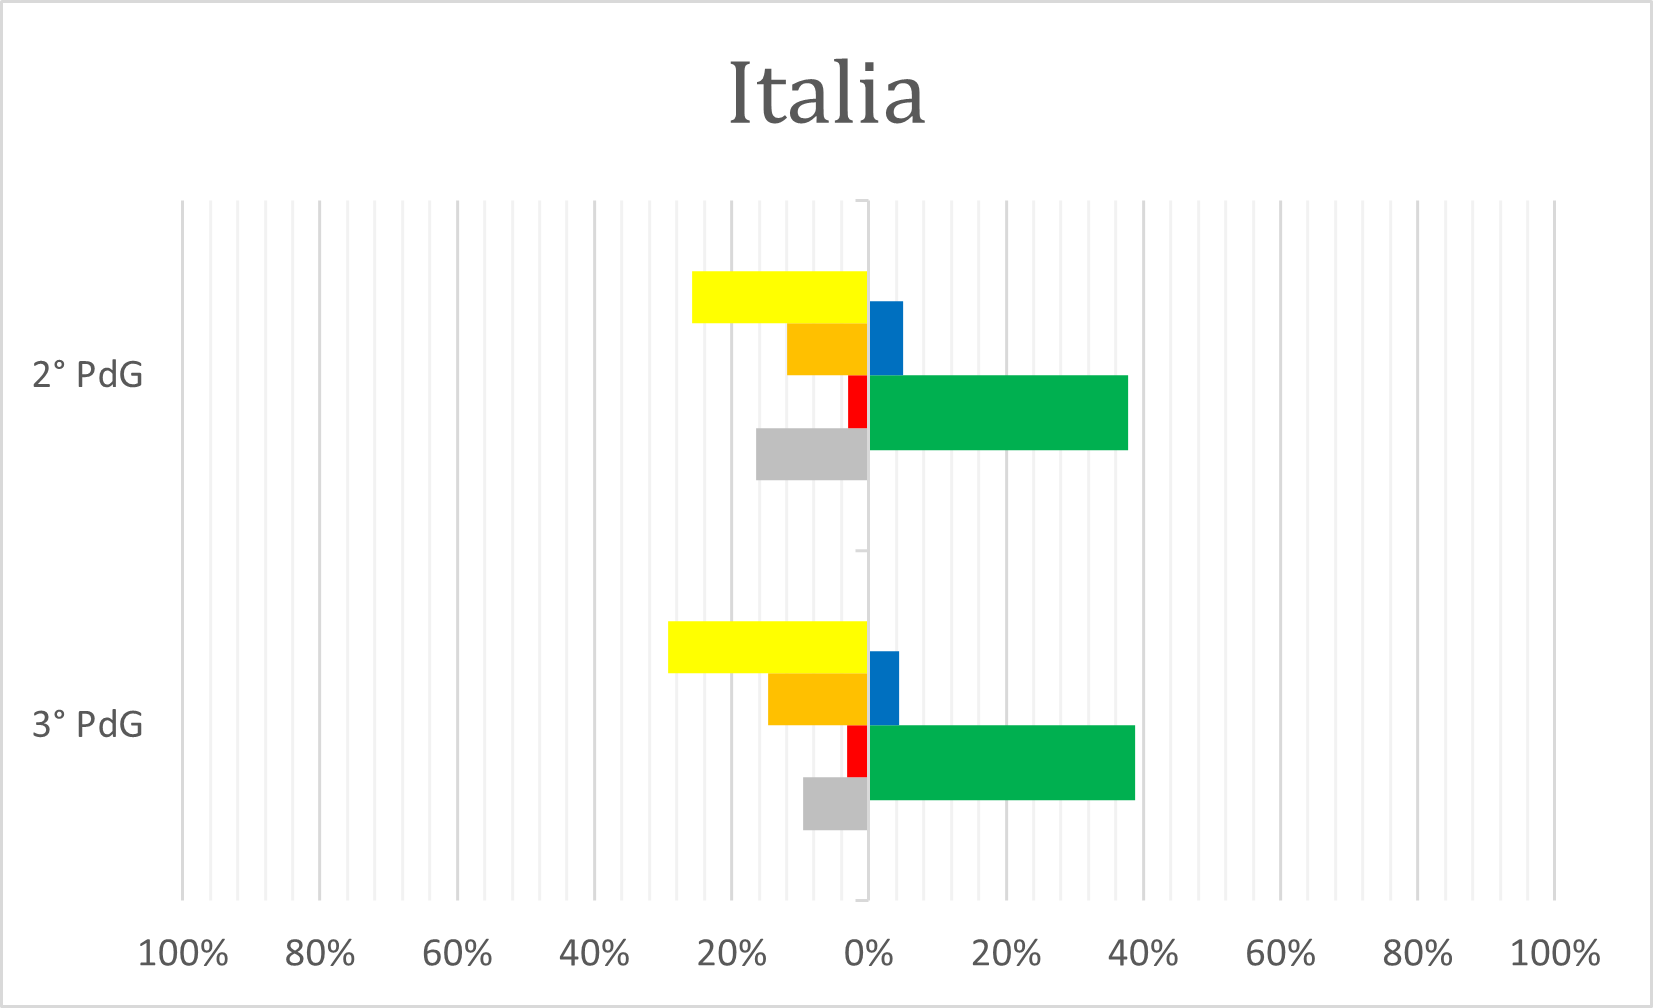
Figure 3c: National ecological state of surface water bodies – rivers and lakes - Comparison 2nd cycle (2015-2021) and 3rd cycle (2021-2027) of Water Management Plans Fonte
ISPRA processing on WISE reporting data - monitoring 2010-2015 and 2015-2021 (October 2022 update) Legenda
PdG = Management Plan |
Thumbnail
Titolo
Figure 1a: Ecological state of surface water bodies – rivers - 3rd cycle (2021-2027) of Water Management Plans Fonte
ISPRA processing on WISE reporting data - monitoring 2015-2021 (October 2022 update) Legenda
PdG = Management Plan |
At the national level, the ecological status of inland surface waters—rivers and lakes—achieves the good and above objective for 43% of the water bodies, while 10% of the water bodies are still in an unknown status (Figure 3c). With Law 221/2015, the boundaries of the Hydrographic Districts were redefined. Therefore, to compare the 2nd and 3rd WMP (Water Management Plan) cycles, the water bodies of the 2nd cycle were assigned to the districts according to the new delimitation.
The classification data from the 2016–2021 six-year period contained in the 3rd WMP show that the ecological status of rivers does not differ significantly from the 2nd WMP for all districts except Sardinia, where there is an increase in the percentage of water bodies in good status, rising from 55% to 76% (Figure 2a).
As for lakes, there is an increase in the water bodies that have achieved the good and above objectives in almost all districts, although percentages remain low, except for the Eastern Alps District (68%) and the Sardinia District, which increased from 9% in the 2nd WMP to 52% in the 3rd WMP (Figure 2b).
It should also be noted that the number of water bodies has changed between the 2nd and 3rd management cycles, particularly for rivers: there were 7,493 water bodies in the 2nd WMP compared to 6,878 in the 3rd WMP. For lakes, the number of water bodies increased by one (348) in the 3rd WMP.