Francesca Archi, Francesca Piva

The Chemical Status of Groundwater (SCAS) indicator assesses the chemical quality of Italian groundwater bodies by comparing pollutant concentrations with the Environmental Quality Standards and Threshold Values specified in Tables 2 and 3 of Ministerial Decree (DM) 6/7/2016.
Depending on whether these concentration limits are met, a groundwater body is classified as having either good or poor chemical status. This classification, along with quantitative status, determines the overall groundwater condition. The indicator is based on data from the classification of water bodies reported in WISE Reporting for the 3rd River Basin Management Plan (RBMP).
At the national level, during the 2016-2021 classification period related to the 3rd RBMP, there was an increase in groundwater bodies classified as having good chemical status, reaching 70% of the total (compared to 58% in the 2nd RBMP). The percentage of water bodies classified as poor was 27%.
At the district level, the percentage of groundwater bodies with good chemical status ranges from 56% in the Sicily District to 85% in the Eastern Alps District. Across all hydrographic districts, the number of water bodies with unknown status has significantly decreased compared to the previous cycle, with all water bodies now classified in the Eastern Alps, Southern Apennines, and Sicily Districts.
The chemical status of groundwater describes the quality of a groundwater body based on the concentration of certain categories of pollutants, both natural and synthetic, compared to the Quality Standards and Threshold Values outlined in Tables 2 and 3 of Annex 1, Part B of Legislative Decree 152/2006, as amended by DM 6 July 2016. This decree is the current regulatory reference for defining the chemical status of groundwater bodies.
Quality standards for nitrate and pesticide concentrations have been established according to EU Directives, while threshold values are set at the national level based on factors such as human toxicity, ecotoxicity, dispersion potential, persistence, and bioaccumulation potential of major pollutants in groundwater.
With the 2016 update to Table 3, additional threshold values for perfluorinated compounds were introduced, alongside previously established parameters from Legislative Decree 30/2009.
To determine chemical status, all fundamental parameters and substances potentially introduced into groundwater are monitored, based on pressure and impact analysis. A groundwater body is classified as having good chemical status if:
- It meets the Quality Standards and Threshold Values
- There is no saline intrusion
- There is no deterioration of connected surface waters or terrestrial ecosystems dependent on groundwater
For naturally occurring substances such as metals, which may be present in high concentrations due to specific geochemical conditions, threshold values are adjusted to account for natural background levels, ensuring that chemical status classification is based solely on anthropogenic contamination.
The chemical status of groundwater bodies can be either good or poor, and together with quantitative status, it determines the overall condition of groundwater.
The SCAS indicator has been developed using classification data from the WISE Reporting for the 3rd RBMP, covering the 2016-2021 period.
To verify, every six years (at each RBMP cycle), the compliance with the requirements for good chemical status, which, together with quantitative status, contributes to achieving and maintaining the overall good environmental quality of groundwater bodies. Additionally, to assess the effectiveness of applied measures and evaluate progress in reducing pressures.
- Legislative Decree 152/2010 and amendments
- Ministerial Decree (DM) 6 July 2016 (transposing Directive 2014/80/EU, which amends Annex II of Directive 2006/118/EC on groundwater protection from pollution and deterioration)
- Legislative Decree 30/2009
- Water Framework Directive (2000/60/EC)
- Directive 2006/118/EC
According to Legislative Decree 152/2006 and amendments, in implementation of the Water Framework Directive (2000/60/EC), a good chemical status is achieved if:
- The chemical composition of a groundwater body does not show signs of saline intrusion or other degradation.
- Pollutant concentrations do not exceed environmental quality standards and threshold values.
- There is no deterioration in the chemical and ecological quality of connected surface waters.
- There is no significant damage to terrestrial ecosystems directly dependent on groundwater.
The target for achieving good chemical status was initially set for 2015, with a six-year update cycle.
- WISE Reporting from the 2nd River Basin Management Plan (RBMP) (March 2017)
- WISE Reporting from the 3rd RBMP (updated October 2022)
- River Basin Authorities
- Autonomous Provinces
- Regions
- SNPA (National Environmental Protection System)
Data contained in the WISE Reporting of the 2nd Water Management Plan of Hydrographic Districts (2017) and the 3rd Management Plan (October 2022 update).
National, Hydrographic Districts
2010-2015; 2016-2021
Using data from the WISE Reporting databases of the 2nd and 3rd RBMPs, the number and percentage of groundwater bodies in good, poor, and unclassified chemical status were calculated at both district and national levels. A comparative analysis between the 2nd and 3rd RBMP cycles allows for an assessment of progress at the district level.
At the national level, during the 2016-2021 classification period, 70% of Italian groundwater bodies were classified as having good chemical status, while 27% were classified as poor. At the district level, the percentage of water bodies achieving good chemical status varies but generally shows an increase compared to the previous RBMP cycle.
The current temporal coverage does not yet allow for the identification of a clear trend.
| Data |
|---|
Thumbnail
Titolo
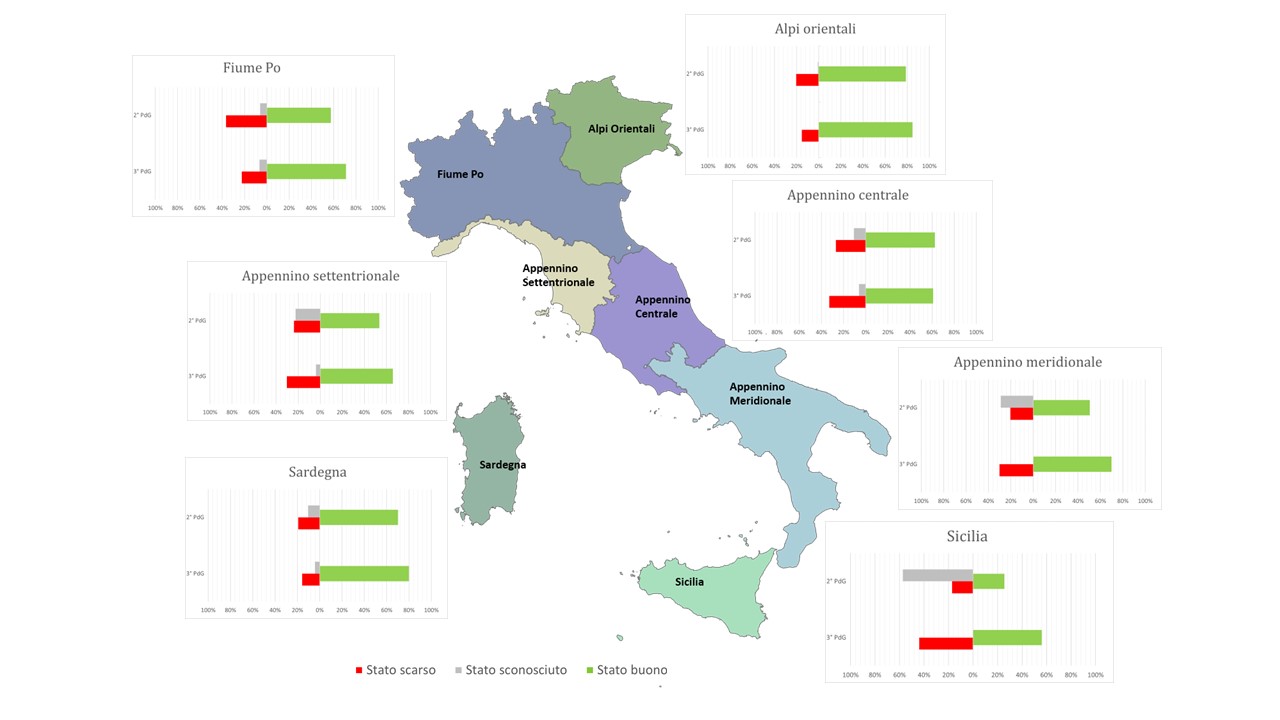
Figure 1: Chemical state of groundwater bodies - 3rd cycle (2021-2027) of Water Management Plans Fonte
ISPRA processing on WISE reporting data - monitoring 2015-2021 (October 2022 update) Legenda
PdG = Management Plan |
Thumbnail
Titolo
Figure 2: Chemical state of groundwater bodies - comparison 2nd cycle (2015-2021) and 3rd cycle (2021-2027) of Water Management Plans Fonte
ISPRA processing on WISE reporting data - monitoring 2010-2015 and 2015-2021 (October 2022 update) Legenda
PdG = Management Plan |
Thumbnail
Titolo
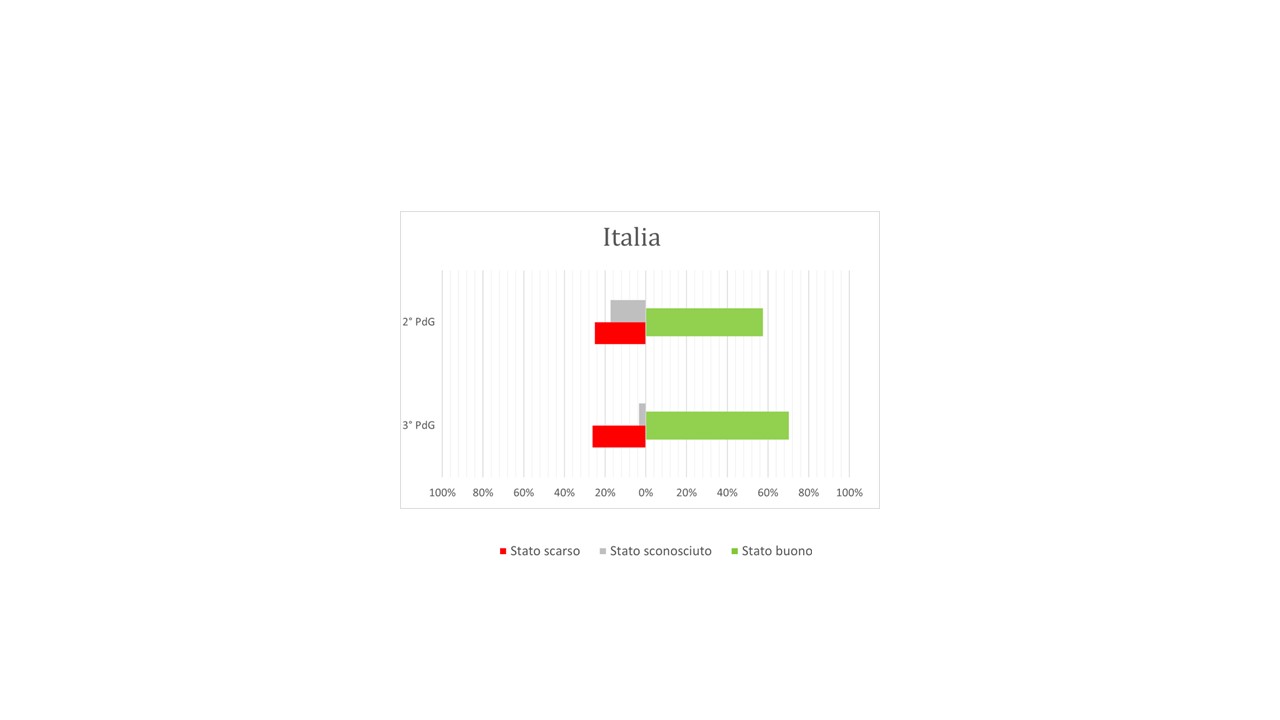
Figure 3: National chemical state of groundwater bodies - comparison 2nd cycle (2015-2021) and 3rd cycle (2021-2027) of Water Management Plans Fonte
ISPRA processing on WISE reporting data - monitoring 2010-2015 and 2015-2021 (October 2022 update) Legenda
PdG = Management Plan |
The data presented in the tables and figures refer to the classification of groundwater bodies from the WISE Reporting of the 3rd and 2nd River Basin Management Plans (RBMPs). Since the boundaries of Hydrographic Districts were redefined by Law 221/2015, to allow for a comparison of chemical status between the 2nd and 3rd cycles, the groundwater bodies from the 2nd cycle were reassigned to the districts according to the new perimeter.
At the national level, during the 2016-2021 classification period (3rd RBMP), the good chemical status objective was achieved by 708 out of 1,009 total groundwater bodies. Compared to the previous cycle, there has been an increase in groundwater bodies classified as having good chemical status, reaching 70% of the total (compared to 58% in the 2nd RBMP), with 27% of groundwater bodies in poor status and a small percentage still unclassified (Figure 3).
At the district level (Figure 1), the percentage of groundwater bodies achieving good chemical status ranges from 56% (in the Sicily District) to 85% (in the Eastern Alps District). There is a general increase in the number of groundwater bodies in good chemical status compared to the previous RBMP (Figure 2).
In the Eastern Alps, Po River, Southern Apennines, and Sardinia Districts, the percentage of groundwater bodies meeting the good status objective is equal to or above the national average. The percentage of groundwater bodies in poor chemical status varies between districts, ranging from 15% to 33%, except in the Sicily District, where it reaches 44%.
However, it should be noted that the classification has now been extended to the majority of groundwater bodies, with unclassified groundwater bodies significantly reduced in almost all districts. Additionally, all groundwater bodies have now been classified in the Eastern Alps, Southern Apennines, and Sicily Districts.