Riccardo Boiocchi, Giancarlo De Gironimo, Massimo Peleggi, Silvana Salvati
The presence or absence of a sewage network and the percentage of wastewater conveyed into collection systems indicate the degree of compliance with the requirements of the applicable regulations. In 2022-2023, the national compliance rate is 99.1%. Of the organic load, 95.7% is conveyed into the sewer system, 3.6% is treated through individual systems, while 0.7% is not connected.
This is a response indicator that provides information about the coverage level of the sewer network within the agglomeration, and thus, the capacity to meet the need for wastewater collection. It is considered:
- Compliant: the agglomeration has a sewer network with a coverage rate equal to or greater than 90%.
- Partially compliant: the agglomeration has a sewer network with a coverage rate between 70% and 90%.
- Non-compliant: the agglomeration has a coverage rate below 70%.
To verify the compliance of sewage systems serving agglomerations across the national territory with the requirements established by the regulations.
Legislative Decree No. 152 of April 3, 2006, titled "Environmental Regulations," as the transposition of Directive 91/271/EEC concerning urban wastewater treatment, sets a series of deadlines for the adjustment of collection and treatment systems serving agglomerations. The aim is to ensure complete territorial coverage of the sewage and treatment system and to upgrade existing facilities to meet the new qualitative standards set for water discharges and the environmental quality objectives for receiving water bodies established by the regulations.
The European reference legislation also set December 31, 2005, as the final deadline for the technological upgrading of collection systems serving agglomerations with populations of 2,000 or more inhabitants (population equivalent - PE). The goal of Directive 91/271/EEC is to equip all urban agglomerations with sewer networks to convey wastewater to treatment plants, with technical requirements appropriate to the population size and the sensitivity of the receiving waters.
https://ec.europa.eu/environment/water/water-urbanwaste/info/pdf/terms.pdf
https://cdr.eionet.europa.eu/help/UWWTD/UWWTD_613
The national framework could be more comprehensive if agglomerations with fewer than 2,000 population equivalents were also considered.
Completion of information useful to the indicator.
Regions
Autonomous provinces
ARPA and APPA (Regional Agencies and Autonomous Provinces for the Protection of the Environment)
The data were acquired through the Urban Waste Water Treatment Directive 2024 (UWWTD 2024) questionnaire prepared by the European Commission to periodically check the state of implementation of the Directive on the national territory and made available on the SINTAI.
National, Regional
2022-2023
The compliance of collection networks with the requirements established by the regulations was calculated. Each degree of compliance was assigned a weight (compliant = 1, partially compliant = 0.75, non-compliant and data not available = 0). For each agglomeration, the ratio between the "total collected load" and the "generated load," both expressed in population equivalents, was calculated. Compliance was expressed as a percentage of the total agglomerations.
The compliance of sewage systems related to agglomerations of 2,000 or more PE is 99.1% in 2022-2023 (Table 1).
Compared to 2020, when compliance of sewage systems related to agglomerations of 2,000 or more population equivalents (PE) stood at 99.3%, no significant variations have been recorded.
| Allegati |
|---|
Headline
Table 1: Conformity of sewerage systems for agglomerations greater than or equal to 2,000 BC - regional detail (2022-2023) Data source
ISPRA processing on ARPA/APPA and regional data (UWWTD 2024 questionnaire) |
Headline
Table 2: Breakdown of the conveyed load in sewer mesh and in individual systems - regional detail (2022-2023) Data source
ISPRA processing on ARPA/APPA and regional data (UWWTD 2024 questionnaire) |
Thumbnail

Headline
Figure 1: Grade of conformity of sewerage systems for agglomerations greater than or equal to 2,000 a.e. - regional detail (2022-2023) Data source
ISPRA processing on ARPA/APPA and regional data (UWWTD 2024 questionnaire) |
Thumbnail
Headline
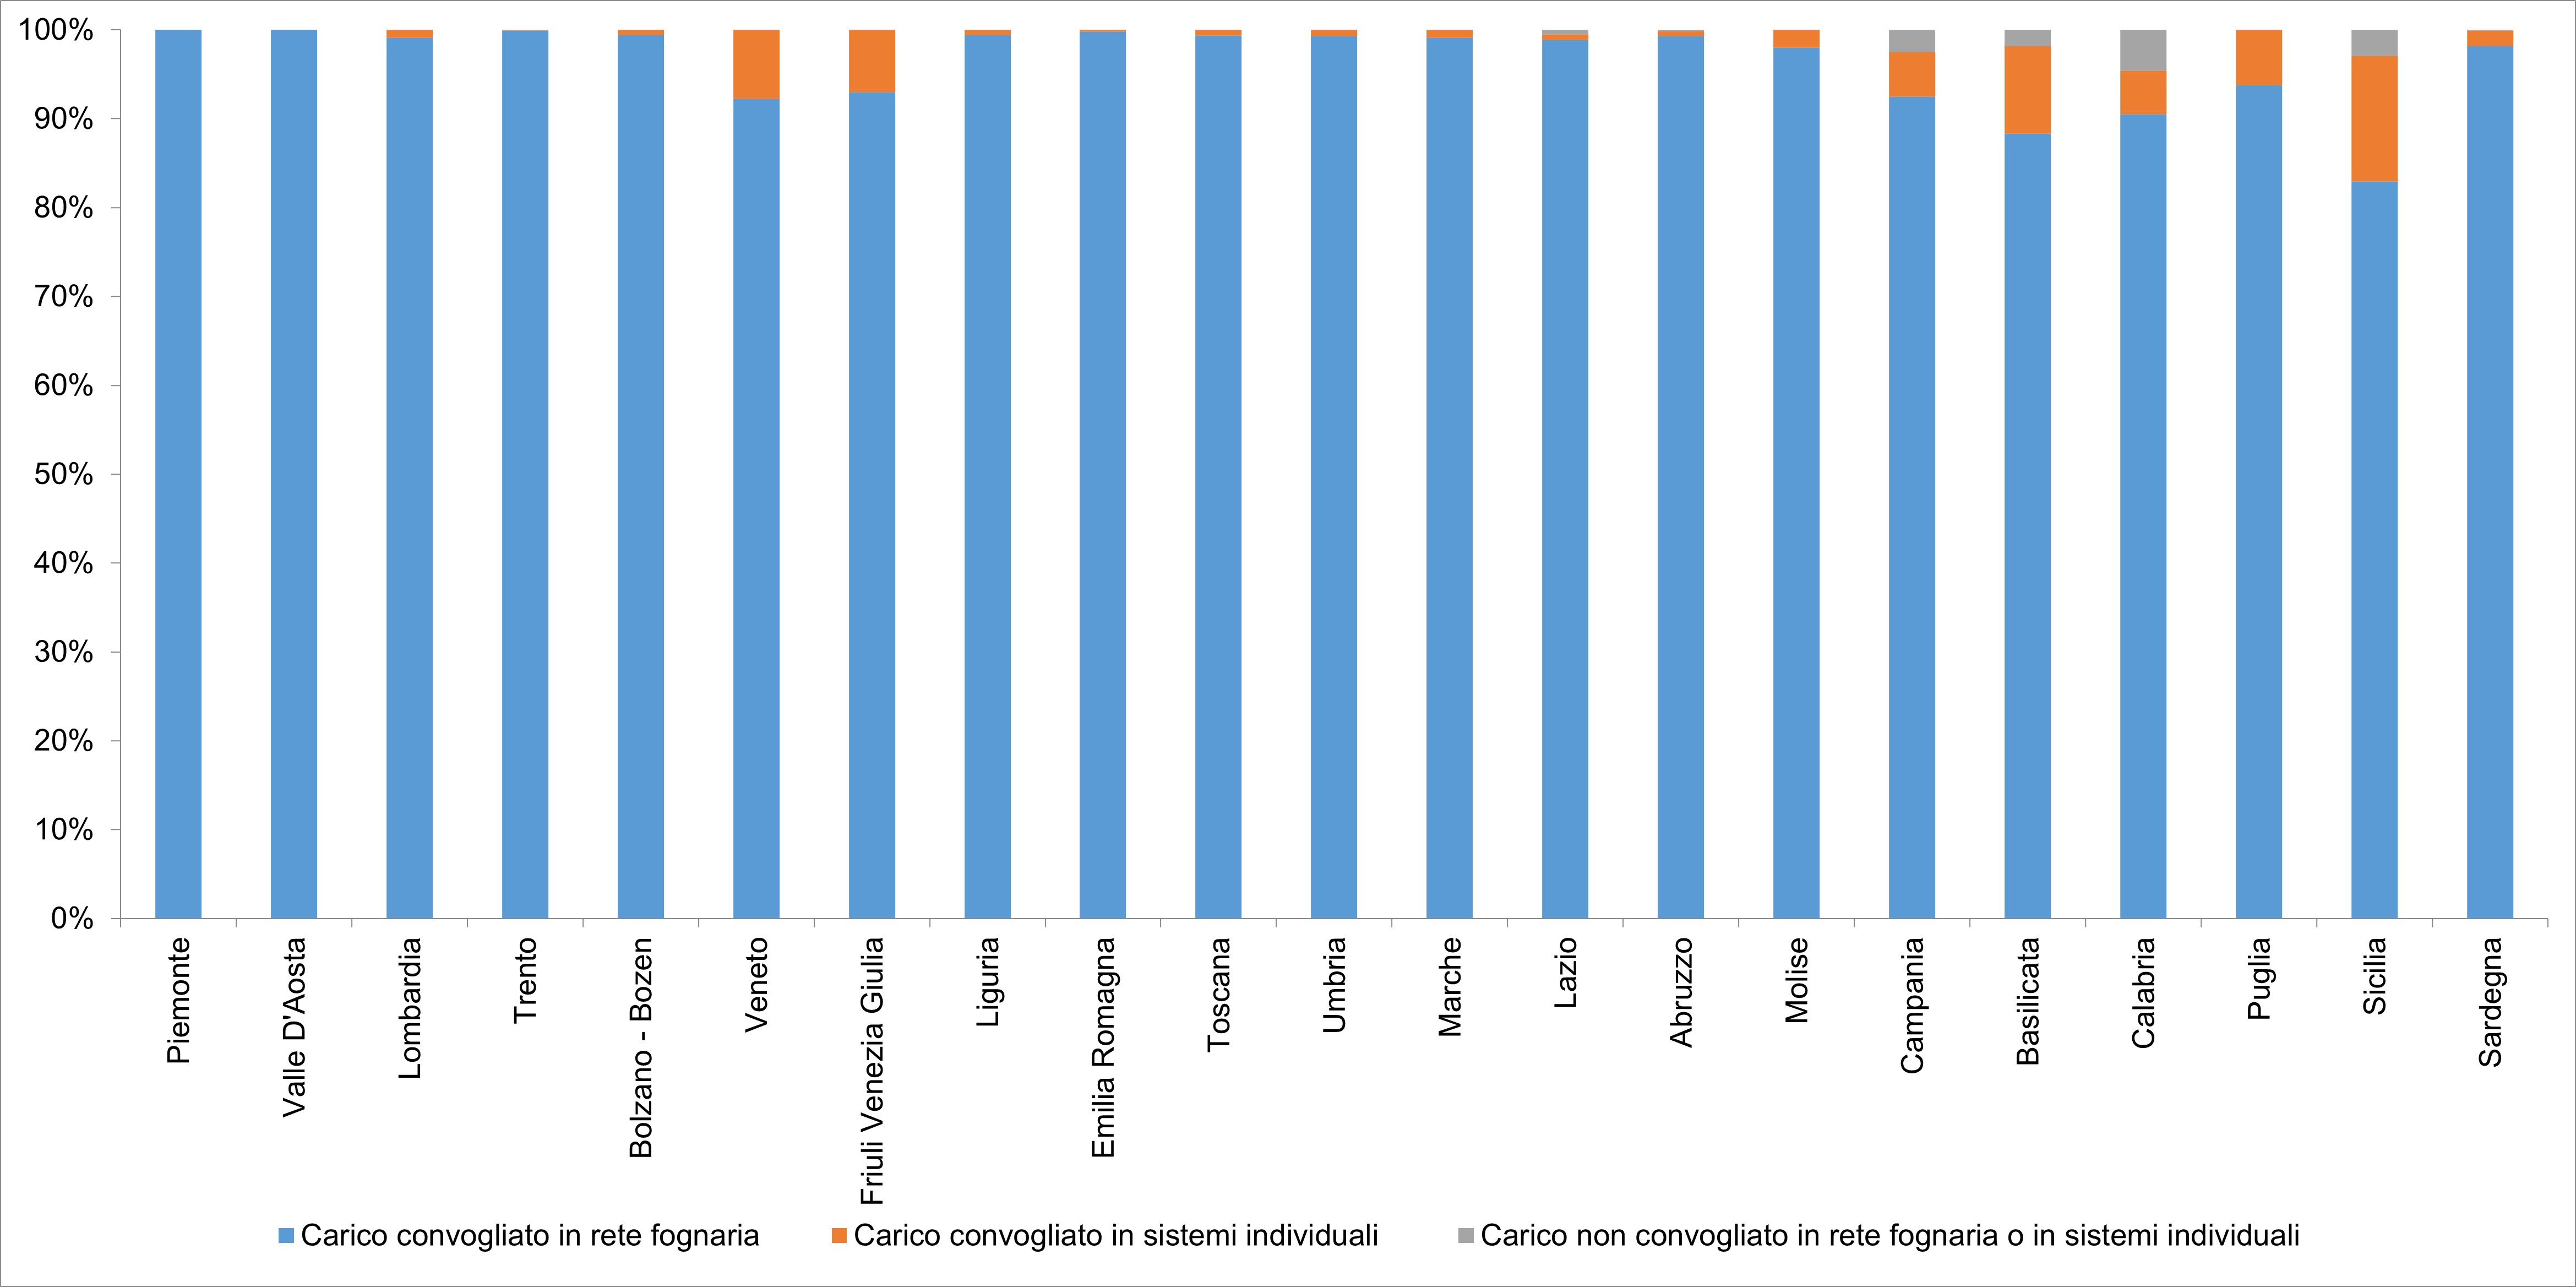
Figure 2: Collected organic load percentage - regional detail (2022-2023) Data source
ISPRA processing on ARPA/APPA and regional data (UWWTD 2024 questionnaire) |
Thumbnail

Headline
Figure 3: Total Overall Overall Combined Loading (2022-2023) Data source
ISPRA processing on ARPA/APPA and regional data (UWWTD 2024 questionnaire) |
Compliance of collection systems (sewage networks) with the requirements of the relevant legislation has reached 100% in 14 regions and the autonomous provinces of Trento and Bolzano. In Lazio, Campania, Basilicata, Calabria, and Sicily, compliance was 99.5%, 97.9%, 97.3%, 92.5%, and 98.7%, respectively (Table 1 – Figure 1). The national compliance rate of collection systems is 99.1%.
Compliance was calculated by summing the percentage of organic load conveyed into the sewer system with that treated by "individual or appropriate systems," which, according to Directive 91/271/EEC, must represent a valid alternative to traditional urban wastewater collection and treatment systems when suitable environmental and economic conditions for installing usual systems are absent.
Of the 3,037 agglomerations considered, 2,971 are compliant, 13 non-compliant, and 53 partially compliant (Table 1). Additionally, the percentage of organic load conveyed into the sewer system and that treated by individual or appropriate systems was calculated. Nationally, 95.7% of the organic load is conveyed into the sewer system (a total of 75,110,675 PE), 3.58% is treated in individual systems (2,811,932 PE), while 0.72% (563,188 PE) is not conveyed into a sewer system or individual systems (Table 2).
At the regional level, the percentage of organic load conveyed into the sewer system was above 95% in 12 regions and the autonomous provinces of Trento and Bolzano, between 90% and 95% in 5 regions. Values below 90% were recorded in Basilicata (88.38%) and Sicily (82.94%) (Table 2 – Figure 2). Regarding the load conveyed to individual systems, in 10 regions and the autonomous provinces of Trento and Bolzano, it ranged between 0% and 1%; in 3 regions, it ranged between 1% and 5%; and in the remaining 6 regions, it exceeded 5%. The highest percentage of organic load conveyed into individual systems was recorded in Sicily, at 14.2%.