Maria Camilla Mignuoli, Massimo Peleggi, Silvana Salvati
The indicator provides the percentage of surface water monitoring stations divided into quality classes according to the average concentration of nitrates detected and in the four-year period 2020-2023, in order to provide an overview of the level of nitrate pollution. The classes typically represent conditions ranging from a low concentration of nitrates (good quality water) to high levels of contamination (at risk or polluted water). At a national level, 95.3% of monitoring stations have average nitrate concentration values lower than 25 mg/l (good quality water); while 0.6% of the monitored stations recorded an average nitrate concentration greater than or equal to 50 mg/l (polluted water). Comparing the values of the four-year period 2020-2023 with the previous one (2016-2019) shows a decrease in the average concentration in 22.4% of the stations, an increase in 20.6% and stability in 57% of the stations.
The monitoring of nitrates in freshwater rivers and lakes is carried out in accordance with the Nitrates Directive (Directive 91/676/EEC) which aims to protect waters from pollution caused or induced by nitrates of agricultural origin. This monitoring is aimed at: identifying polluted waters and those that could be polluted if no action is taken with specific measures, the designation and review of vulnerable zones (areas that discharge into polluted waters or that could be polluted if no action is taken and which contribute to pollution) and the evaluation of the effectiveness of Action Programs (a series of binding measures intended to prevent and reduce nitrate pollution, including for example those of codes of good agricultural practice). If surface fresh waters have nitrate concentrations higher than 50 mg/l, or are at risk of exceeding this value if specific measures are not adopted, they must be considered polluted waters or waters that could be polluted in the absence of adequate interventions. A further criterion for classifying these waters as polluted or potentially so concerns their eutrophication condition: if they are eutrophic or risk becoming so in the short term without control measures, they must be considered polluted or at risk of pollution. The quality classes, represented by different colors and compliant with the scheme of the European Guidelines, are divided from worst to best as follows: red for concentrations ≥ 50 mg/l; orange for values between 40 and 49.99 mg/l; yellow for values between 25 and 39.99 mg/l, green for values between 10 and 24.99 mg/l, light blue for values between 2 and 9.99 mg/l and blue for values between 0 and 1.99 mg/l. Similarly, trend quality classes are ranked from worst to best into: red for strong increase > 5 mg/l; orange for weak increase from +1 to 5 mg/l; yellow for stability from -1 to +1 mg/l; green for a weak drop from -5 to -1 mg/l and blue for a strong drop below -5 mg/l. For each concentration and trend quality class, the percentage of groundwater monitoring sites out of the total falling into that class is indicated.
Evaluate the impact of human activities linked to the dispersion of nitrates in surface waters in the medium - long term. These activities can be traced back to the use of fertilizers, both chemical fertilizers and livestock effluents.
Nitrate Directive 91/676/EEC - art. 10
Directive 2000/60/EC
Legislative Decree 152/2006
Nitrates Directive 91/676/EEC - Status and trends of aquatic environment and agricultural practice - Guidelines for reporting under Article 10 - Revised Version January 2024
Reference value of nitrate concentration in surface waters: 50 mg/l
Report pursuant to article 10 of Directive 91/676/EEC ITALY - Four-year period 2016-2019 European Commission website on Nitrates Directive: https://environment. ec. europa. eu/topics/water/nitrates_en Report from the commission to the council and the European Parliament on the implementation of Council Directive 91/676/EEC concerning the protection of waters against pollution caused by nitrates from agricultural sources based on Member State reports for the period 2016–2019 – https://eur-lex. europa. eu/legal-content/EN/TXT/? uri=COM%3A2021%3A1000%3AFIN&qid=1633953687154
SINTAI
SINTAI - https://www. sintai. isprambiente. it - Section Directive 91/676 > Access to Nitrate reporting data
National, regional
2016-2023
The percentage of surface water monitoring sites out of the total of them falling into the quality classes is calculated, identified as nitrate concentration intervals and nitrate concentration variation intervals between the average value of the current four-year period and that of the previous four-year period.
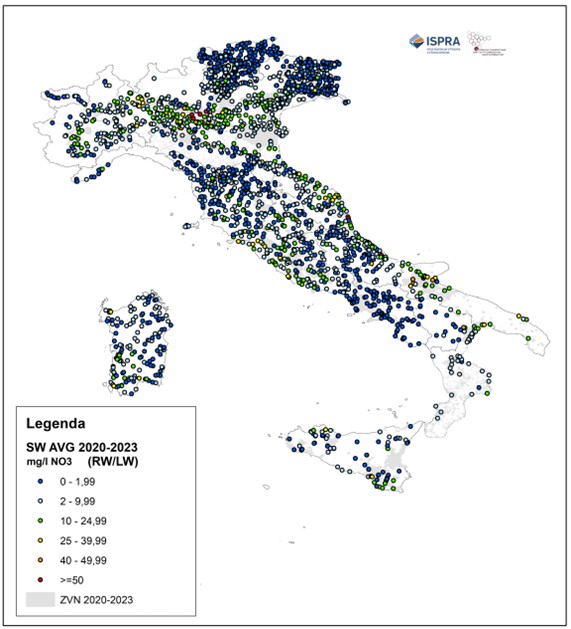
In the four-year period 2020-2023, the results relating to the distribution of monitoring stations in the different quality classes (0-1.99 mg/l; 2-9.99 mg/l; 10-24.99 mg/l; 25-39.99 mg/l; 40-49.99 mg/l; ≥50 mg/l) highlighted that, out of 1,942. Stations, 95.3% had an average concentration of nitrates lower than 25 mg/l (good quality water), while 0.6% recorded an average concentration greater than or equal to 50 mg/l of nitrates (polluted water) (Table 1, Figure 1). However, it should be noted that the aforementioned assessment of the state of surface waters is partial, as it does not include the verification relating to the additional criterion envisaged by the Nitrates Directive concerning the condition of eutrophication.
From the analysis of the trend between the previous four-year period (2016-2019) and the current one (2020-2023), a decrease in the average concentration of nitrates was found in 22.4% of the 1,793 common stations between the two four-year periods, compared to an increase recorded in 20.6% of the same stations. A stable trend prevails over all (57% of stations) (Table 2, Figure 2).
| Allegati |
|---|
Thumbnail
Titolo
Figure 1: Average nitrate concentration values in surface water monitoring sites, rivers and lakes, for the period 2020-2023 Fonte
ISPRA processing on SINTAI data |
Thumbnail
Titolo
Figure 2: Trends in average nitrate concentration values in surface water monitoring sites (rivers and lakes) between the four-year period 2016-2019 and the four-year period 2020-2023 Fonte
ISPRA processing on SINTAI data |
Titolo
Table 1: Distribution of surface water monitoring stations - rivers and lakes - in different quality classes Fonte
ISPRA processing on SINTAI Directive 91/676 data |
Titolo
Table 2: Percentage distribution of river and lake monitoring sites compared to the trend in average nitrate concentration between the four-year periods 2016-2019 and 2020-2023 Fonte
ISPRA processing on SINTAI Directive 91/676 data |
As part of the regional nitrate network, the ARPA/APPA carry out monitoring activities of the concentration of nitrates in sampling stations that are affected by pressures of agricultural origin and forward the data to ISPRA. Every four years ISPRA sends a report to the European Commission on the state of implementation of the Nitrates Directive (Directive 91/676/EEC) on the national territory.
With reference to the period 2020-2023, the number of stations varies from a maximum of 239 in Tuscany, to a minimum of 12 in Liguria, for a total of 1,942 stations (Table 1). All stations in six autonomous regions/provinces (Piedmont, Valle d'Aosta, Bolzano, Liguria, Molise, Calabria) have an average nitrate concentration <25 mg/l, while Lombardy and Puglia record the highest percentages of stations (equal to 3.1% and 4.8% respectively) with an average nitrate concentration ≥50 mg/l (Table 1, Figure 1).
Areas of land that discharge into surface waters with a nitrate concentration exceeding 50 mg/l, or are at risk of exceeding this value if specific measures are not taken, must be designated as vulnerable zones. Furthermore, areas that discharge into eutrophic waters or are at risk of becoming so in the short term without control measures must also be designated as vulnerable zones. The Action Program applies to these areas, i. e. A set of measures aimed at preventing and reducing nitrate pollution.
In the four-year period 2020-2023, a 15% decrease in the number of river and lake monitoring stations was detected compared to the four-year period 2016-2019, going to 1,942 stations in the first period compared to 2,288 in the second, of which 1,793 are the municipalities of both. Compared to the 2016-2019 period, the monitoring network was subjected to changes both in relation to the number of stations and in relation to their location. Some stations were removed and replaced with alternative stations (new or merged with similar stations) and other stations were not monitored (temporarily removed) because in the period 2016-2019 values lower than 25 mg NO3/l were detected and, as required by art. 6. b of the Nitrates Directive, monitoring can be carried out in these stations every eight years.
According to what was reported by the regions, some stations were removed and not replaced by other alternatives mainly due to the finding that, based on the pressure-impact analysis, they did not monitor pollution caused by agricultural sources. It is understood that such pollution continues to be monitored and reported under the Water Framework Directive 2000/60/EC.