Panel 1
Francesca Archi, Francesca Piva
The quantitative status of groundwater describes the balance of a water body in terms of the relationship between extraction and natural replenishment of the water resource. A groundwater body is defined as being in "good quantitative status" if groundwater levels ensure that the annual average withdrawals for long-term anthropogenic activities do not exhaust the available groundwater resources, do not cause damage to surface waters and connected ecosystems, and do not lead to saline intrusion or other types of contamination.
This indicator has been derived from the classification data of water bodies in the WISE Reporting of the 3rd Water Management Plan (WMP). Nationally, during the 2016-2021 classification period under the 3rd WMP, an increase in groundwater bodies classified as being in "good quantitative status" was observed, reaching 79% of the total (compared to 61% in the 2nd WMP). The percentage of groundwater bodies in "poor" status is 19%, while 2% remain unclassified. At the district level, the percentages of water bodies achieving "good quantitative status" range from 98% in the Eastern Alps District to 58% in the Southern Apennine District.
The quantitative status of groundwater describes the balance of a water body in terms of extraction versus natural replenishment and is aimed at assessing the exploitation and availability of groundwater resources. This status is evaluated through long-term hydrogeological balance analysis for the hydrogeological unit, comparing average recharge volumes of aquifers with the average volumes extracted for anthropogenic activities.
The requirements for the "good quantitative status" of a groundwater body are detailed in Table 4, Part B, Annex 1 to Part Three of Legislative Decree No. 152/2006 and subsequent amendments, as modified by Legislative Decree No. 30/2009, implementing Directives 2000/60/EC and 2006/118/EC. According to the definition in this table, achieving good quantitative status requires that groundwater levels and spring flows are such that the annual average withdrawals for long-term anthropogenic activities do not exhaust the available groundwater resources, do not cause damage to surface waters or connected ecosystems, and do not result in saline intrusion or other forms of contamination.
Water bodies with a positive or neutral balance are assigned the "good" status, whereas those with a negative balance are classified as being in "poor" status. Based on classification outcomes, water resource management policies can be tailored sustainably, providing measures such as progressive reductions in withdrawals and/or increased recharge for water bodies at risk.
The quantitative status of groundwater bodies contributes, along with their chemical status, to defining the overall environmental status of groundwater. The quantitative status indicator provides a concise representation, at both national and district levels, of the number of water bodies classified in good quantitative status, highlights the proportion of those not meeting the target, and those still unclassified, while also recording progress made compared to the previous WMP (2016).
To verify, every six years (with each WMP), the fulfillment of the requirements for good quantitative status, which, together with chemical status, contributes to achieving and maintaining the overall good environmental quality of groundwater bodies. To assess the effectiveness of implemented measures and evaluate progress made in reducing pressures.
Legislative Decree No. 152/2010 and subsequent amendments, Legislative Decree No. 30/2009, Water Framework Directive (2000/60/EC). Under Legislative Decree No. 152/2006 and subsequent amendments, implementing the Water Framework Directive (2000/60/EC), good quantitative status of groundwater is achieved if the level/flow of groundwater in the water body ensures that the annual average long-term withdrawal does not exhaust the available groundwater resources. The goal was set to be achieved by 2015, with six-year updates.
Panel 2
Guidance on groundwater status and trend assessment common implementation strategy for the Water Framework Directive (2000/60/EC), Guidance document no. 18. Technical report - 2009 – 026. ISBN 978-92-79-11374-1 Percopo C., Brandolin D., Canepa M., Capodaglio P., Cipriano G., Gafà R., Iervolino D., Marcaccio, M., Mazzola M., Mottola A., Sesia E., Testa M. (2017): Criteri tecnici per l’analisi dello stato quantitativo e il monitoraggio dei corpi idrici sotterranei. ISPRA – Manuali e Linee Guida 157/2017. Roma, Giugno 2017. ISBN 978-88-448-0837-2
Data quality assessment
District Basin Authorities, Autonomous Provinces, Regions, SNPA (National System for Environmental Protection).
Data in the WISE Reporting of the 2nd Water Management Plan of Hydrographic Districts (2017) and the 3rd Management Plan (October 2022 update)
National, Hydrographic Districts
2016-2021; 2010-2015
Indicator assessment
Using data from the district databases of the WISE Reporting for the 2nd and 3rd Water Management Plans (WMP), the number and percentage of groundwater bodies classified as in good, poor, or unclassified quantitative status were calculated at district and national levels. For each district, comparisons can be made between numerical and percentage data on the quantitative status achieved in the 2nd and 3rd WMP cycles.
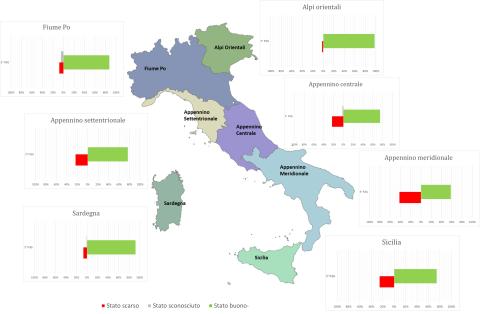
At the national level, during the 2016–2021 classification period, 79% of Italian groundwater bodies were classified as in good quantitative status, while 19% were in poor status (Figure 3). At the district level, the percentages of groundwater bodies achieving good status range between 58% and 98%.
The temporal coverage of the indicator currently does not allow for the identification of a trend.
Data
Figure 2: Quantitative state of groundwater bodies - comparison 2nd cycle (2015-2021) and 3rd cycle (2021-2027) of Water Management Plans
ISPRA processing on WISE reporting data - monitoring 2010-2015 and 2015-2021 (October 2022 update)
PdG = Management Plan
Figure 3: National quantitative state of groundwater bodies - comparison 2nd cycle (2015-2021) and 3rd cycle (2021-2027) of Water Management Plans
ISPRA processing on WISE reporting data - monitoring 2010-2015 and 2015-2021 (October 2022 update)
PdG = Management Plan


The data reported in tables and figures refer to the classification of groundwater bodies from the WISE Reporting for the 2nd and 3rd WMP. Since the boundaries of the Hydrographic Districts were redefined by Law No. 221/2015, to compare the quantitative status between the 2nd and 3rd cycles, the water bodies from the 2nd cycle were assigned to the districts according to the new delineation.
At the national level, during the 2016–2021 classification period of the 3rd WMP, the objective of good quantitative status was achieved by 802 groundwater bodies out of a total of 1,009. Compared to the previous cycle, there is an increase in groundwater bodies classified in good quantitative status, reaching 79% of the total (up from 61% in the 2nd WMP). The percentage of groundwater bodies in poor status is 19%, and 2% remain unclassified (Figure 3).
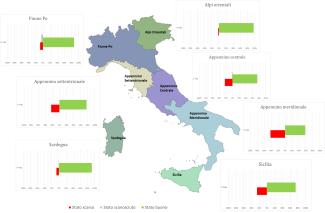
At the district level (Figure 1), the percentages of groundwater bodies in good quantitative status vary from 98% in the Eastern Alps District to 58% in the Southern Apennine District. An increase in water bodies achieving the objective compared to the previous WMP (Figure 2) is observed in almost all districts, except for the Sicily District. In the Eastern Alps, Po River, and Sardinia Districts, percentages of attainment exceed the national average.
In the 3rd WMP, percentages of groundwater bodies in poor quantitative status remain significantly variable among districts, ranging from 2% in the Eastern Alps District to 42% in the Southern Apennine District. However, it is noteworthy that classification has been extended to most groundwater bodies, with a marked reduction in unclassified groundwater bodies in nearly all districts and full classification achieved in the Eastern Alps, Northern Apennine, Southern Apennine, and Sicily Districts.