Panel 1
Carla Iadanza, Alessandro Trigila, Gianluigi Di Paola
The indicator provides information relating to cultural heritage at hydrogeological risk on the national territory. There are 45,339 cultural assets at risk of landslides, of which 13,966 are located in areas with high P3 and very high P4 danger. The cultural assets at risk of flooding are 35,997 in the medium hydraulic danger scenario (return times between 100 and 200 years) and reach 54,103 in the low hydraulic danger scenario, which is the maximum expected scenario.
The indicator provides information on cultural heritage at hydrogeological risk on the national territory. The estimate is carried out using as input data: a) the architectural, monumental and archaeological assets of the VIR – Vincoli In Rete database managed by the ICR (Central Institute for Restoration); b) the ISPRA national mosaic of the landslide hazard areas of the Hydrogeological Management Plans - PAI harmonized into 5 classes (very high hazard P4, high P3, medium P2, moderate P1 and AA attention areas); c) the ISPRA national Mosaicing of areas with high hydraulic danger with a return time between 20 and 50 years (frequent floods), medium danger with return times between 100 and 200 years (infrequent floods) and low danger (little probability of floods or extreme event scenarios) (Legislative Decree 49/2010 transposing the Floods Directive 2007/60/EC), defined by the District Basin Authorities and, for the territories of respective competence, by the Autonomous Provinces of Trento and Bolzano.
Provide an overview of cultural heritage at hydrogeological risk in Italy.
Collection, processing, archiving and dissemination of data regarding soil protection and hydrogeological instability referring to the entire national territory (art. 55 of Legislative Decree 152/2006 “Regulations on environmental matters”); D. L. 180/98 “Sarno Decree” converted into Law 267/1998, Prime Ministerial Decree of 09/29/98 (Guidance and coordination act), L. 365/00.
Panel 2
Trigila A., Lastoria B., Iadanza C., Bussettini M., Mariani S., D'Ascola F., Salmeri A., Cassese M. L., Pesarino V., Di Paola G., Romeo S., Rischia I., Dessì B., Spizzichino D., Licata V., Gallozzi P. L. (2025) Hydrogeological instability in Italy: hazards and risk indicators - 2024 Edition. ISPRA, Reports 415/2025.
-
-
Data quality assessment
The architectural, monumental and archaeological assets derive from the VIR - Vincoli In Rete database managed by the ICR (Central Institute for Restoration) (http://vincoliinrete. beniculturali. it/VincoliInRete/vir/user/login).
The national mosaics of landslide and hydraulic hazards, developed by ISPRA, are published on the national IdroGEO platform (https://idrogeo. isprambiente. it/).
National, regional, municipal
2024
Indicator assessment
The risk estimate was carried out by intersecting, in a GIS environment, the points of the VIR - ICR Cultural Heritage buffered at 30 m, to approximate the physical dimensions of the assets, with the mosaics of the areas at risk from landslides of the PAI and the areas at hydraulic danger (Legislative Decree 49/2010). The landslide-prone areas of the PAI include, in addition to the landslides that have already occurred, also the areas of possible evolution of the phenomena and the areas potentially susceptible to new landslide phenomena. The vulnerability, which represents the degree of damage to the element at risk during an event (between 0 = no damage and 1 = total loss), was conservatively set equal to 1. An evaluation of the same would require, in addition to knowledge of the magnitude of the phenomena, a specific filing of the landslide and hydraulic vulnerability of the individual exposed asset. The cultural assets at risk of landslides in Italy are processed on the basis of the VIR - ICR database (version of 1 November 2024) and the national landslide hazard mosaic (v. 5.0 – 2024). The cultural assets at risk of floods in Italy are processed on the basis of the VIR - ICR database (version of 1 November 2024) and the National Mosaic of hydraulic hazards (v. 5.0 – 2020).
There are 45,339 cultural assets at risk of landslides, of which 13,966 are located in areas with high P3 and very high P4 danger. The cultural assets at risk of flooding are 35,997 in the medium hydraulic danger scenario (return times between 100 and 200 years) and reach 54,103 in the low hydraulic danger scenario, which is the maximum expected scenario.
It is not possible to define a trend, as the changes in the number of cultural assets at risk of landslides and floods, compared to previous updates of the Yearbook database, are linked to the integration/revision of the VIR - Vincoli In Rete (ICR) cultural heritage database and to the integration/revision of the mapping of areas at risk from landslides and hydraulics (District Basin Authorities), rather than to the updating of the aforementioned maps with landslide or flood events recent.
Data
Table 1: Cultural heritage assets at risk from landslides by region (2024)
ISPRA
Table 2: Cultural heritage assets at risk from floods by region (2024)
ISPRA
* Data on areas with high hydraulic hazard are not available for the territory of the former Regional Basin Authority of the Marche. The figure for the Marche Region was therefore calculated based on 12% of the territory not included within the jurisdiction of the former Basin Authority.
** The low hydraulic hazard scenario represents the maximum expected scenario, i.e., the widest potential extent of flood-prone areas in Italy. Therefore, data from the three scenarios should not be summed up.


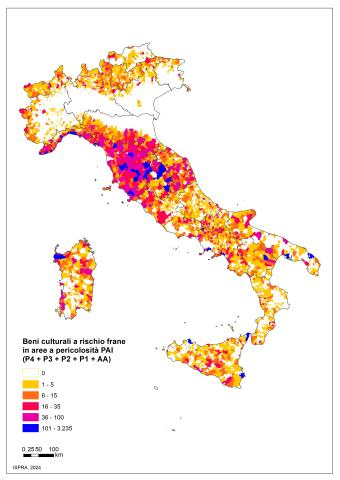
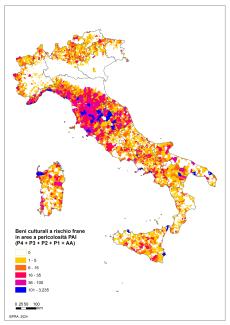
There are 45,339 cultural assets at risk of landslides in Italy, equal to 19.8% of the total (Table 1, Figure 1). If we consider the high P3 and very high P4 danger classes, the cultural assets on display are 13,966, equal to 6.1%. The highest number of cultural assets at risk of landslides in P3 and P4 hazard areas is recorded in Campania, Tuscany, Marche, Emilia-Romagna and Lazio.
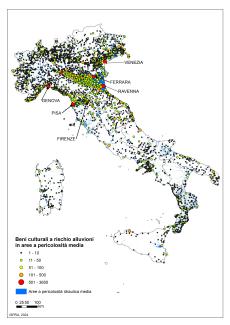
The cultural assets at risk of floods in Italy are 17,642 (7.7% of the total) in the high hydraulic danger scenario (return time between 20 and 50 years), 35,997 (15.7%) in the medium hydraulic danger scenario (return time between 100 and 200 years) and reach 54,103 (23.6%) in the low danger scenario (Table 2, Figure 2). The latter represents the maximum expected scenario or the maximum extension of floodable areas in Italy; the data on cultural heritage at risk relating to the three scenarios should therefore not be added. The highest number of cultural assets at risk of flooding in the medium scenario is found in Emilia-Romagna, Veneto, Tuscany and Liguria.