Giovanni Finocchiaro, Mariangela Soraci
The indicator reports the evolution of intramural Research and Development (R&D) expenditure by industrial enterprises in Italy. In 2023, intramural R&D expenditure reached EUR 12.19 billion, an increase of 7% compared with 2022, exceeding the pre-pandemic peak recorded in 2019. Almost all expenditure (99%) continued to be generated by the manufacturing sector, while mining and quarrying, energy supply, and waste management activities together accounted for the remaining 1%. Over the period 2012–2023, total investment increased by 46.1%. At the European level, R&D expenditure amounted to approximately 1.38% of GDP in 2024 (1.37% in 2023), leaving Italy below both the euro area average and its main European industrial competitors.
The indicator reports the value of intramural Research and Development (R&D) expenditure incurred by enterprises operating in industry (industry in the strict sense). R&D comprises basic research, applied research, and experimental development. Research and Development is defined as the set of creative and systematic activities undertaken to increase the stock of knowledge—including knowledge of humankind, culture, and society—and to devise new applications of available knowledge. Intramural R&D expenditure refers to expenditure incurred for research activities carried out internally by enterprises using their own personnel and facilities; externally contracted R&D projects are excluded. Intramural expenditure includes both current expenditure (personnel costs and purchases of goods and services) and capital expenditure.
The expenses incurred by industrial companies for Research & Development represent a source of information to evaluate their capacity for technological updating and competitive innovation.
The regulatory framework underpinning research and development (R&D) investments by industrial enterprises has become increasingly consolidated in recent years across three complementary levels. At the European level, Regulation (EU) No. 995/2012 remains binding, requiring Member States to collect and transmit harmonized data on R&D expenditure. In parallel, the Horizon Europe framework programme, established by Regulation (EU) 2021/695, defines thematic priorities and funding mechanisms capable of steering an increasing share of private investment. The implementation of the new European Research Area (ERA) was formally established through Council Recommendation (EU) 2021/2122, which reaffirms the shared objective of all Member States to allocate 3% of the European Union's GDP to research and innovation activities by 2030 (a target to which Italy contributes through a national commitment of 1.53% of GDP). Since 2023, the European Chips Act (Regulation (EU) 2023/1782) has introduced additional incentives and public–private partnerships in the semiconductor sector, further strengthening the link between EU industrial policy and domestic R&D expenditure. At the national level, the National Recovery and Resilience Plan (NRRP) and the National Research Programme 2021–2027, updated in 2023, mobilize financial resources and tax incentives that directly support business investment, ensuring consistency with the European strategy and contributing to the achievement of the Sustainable Development Goals (SDGs), particularly Goal 9: Industry, Innovation and Infrastructure. Taken together, these European and national policy instruments establish both the statistical reporting requirements and the quantitative and qualitative objectives that frame the evolution of R&D expenditure in the industrial sector. Consequently, this indicator serves as a key benchmark for monitoring progress towards growth driven by innovation and technological competitiveness.
ISTAT, Statistical survey on research and development in companies;
https://siqual. istat. it/SIQual/visualizza. do? id=5000075
ISTAT, Statistics report, various years, “Research and Development in Italy”;
Eurostat, Statistics explained, various years, “Expenditure on environmental protection”;
OECD, 2002 (first ed. 1964). Manual on statistical surveys of R&D activities (Frascati Manual).
R&D expenditure is not necessarily positively correlated with improvements in firms' environmental performance. It encompasses a wide range of scientific and technological disciplines that may have positive, neutral, or negative environmental impacts, and whose effects may in any case materialize only over the long term. The indicator has been classified as a "Response" according to the DPSIR framework; however, this classification should be understood as referring only to the share of business R&D expenditure that has a demonstrable positive effect on environmental protection. At present, however, the methodology used for data collection does not allow this specific component to be distinguished from the overall aggregate. Consequently, the indicator should be interpreted as providing contextual information rather than as a direct measure of environmental response.
-
EUROSTAT (Statistical Office of the European Communities), Istat (National Institute of Statistics)
Official Istat databasedati. istat. it under the heading “Business/Research and Development/Expenditure”
Eurostat data browser under the heading “Science, technology, digital society/Science and technology/Research and development (R&D)/Research and development expenditure, by sectors of performance”
National
2012-2023
The data used to produce the tables and figures are derived from official Istat and Eurostat statistics and are presented either in their original form or with only minimal processing, such as the calculation of percentage changes.
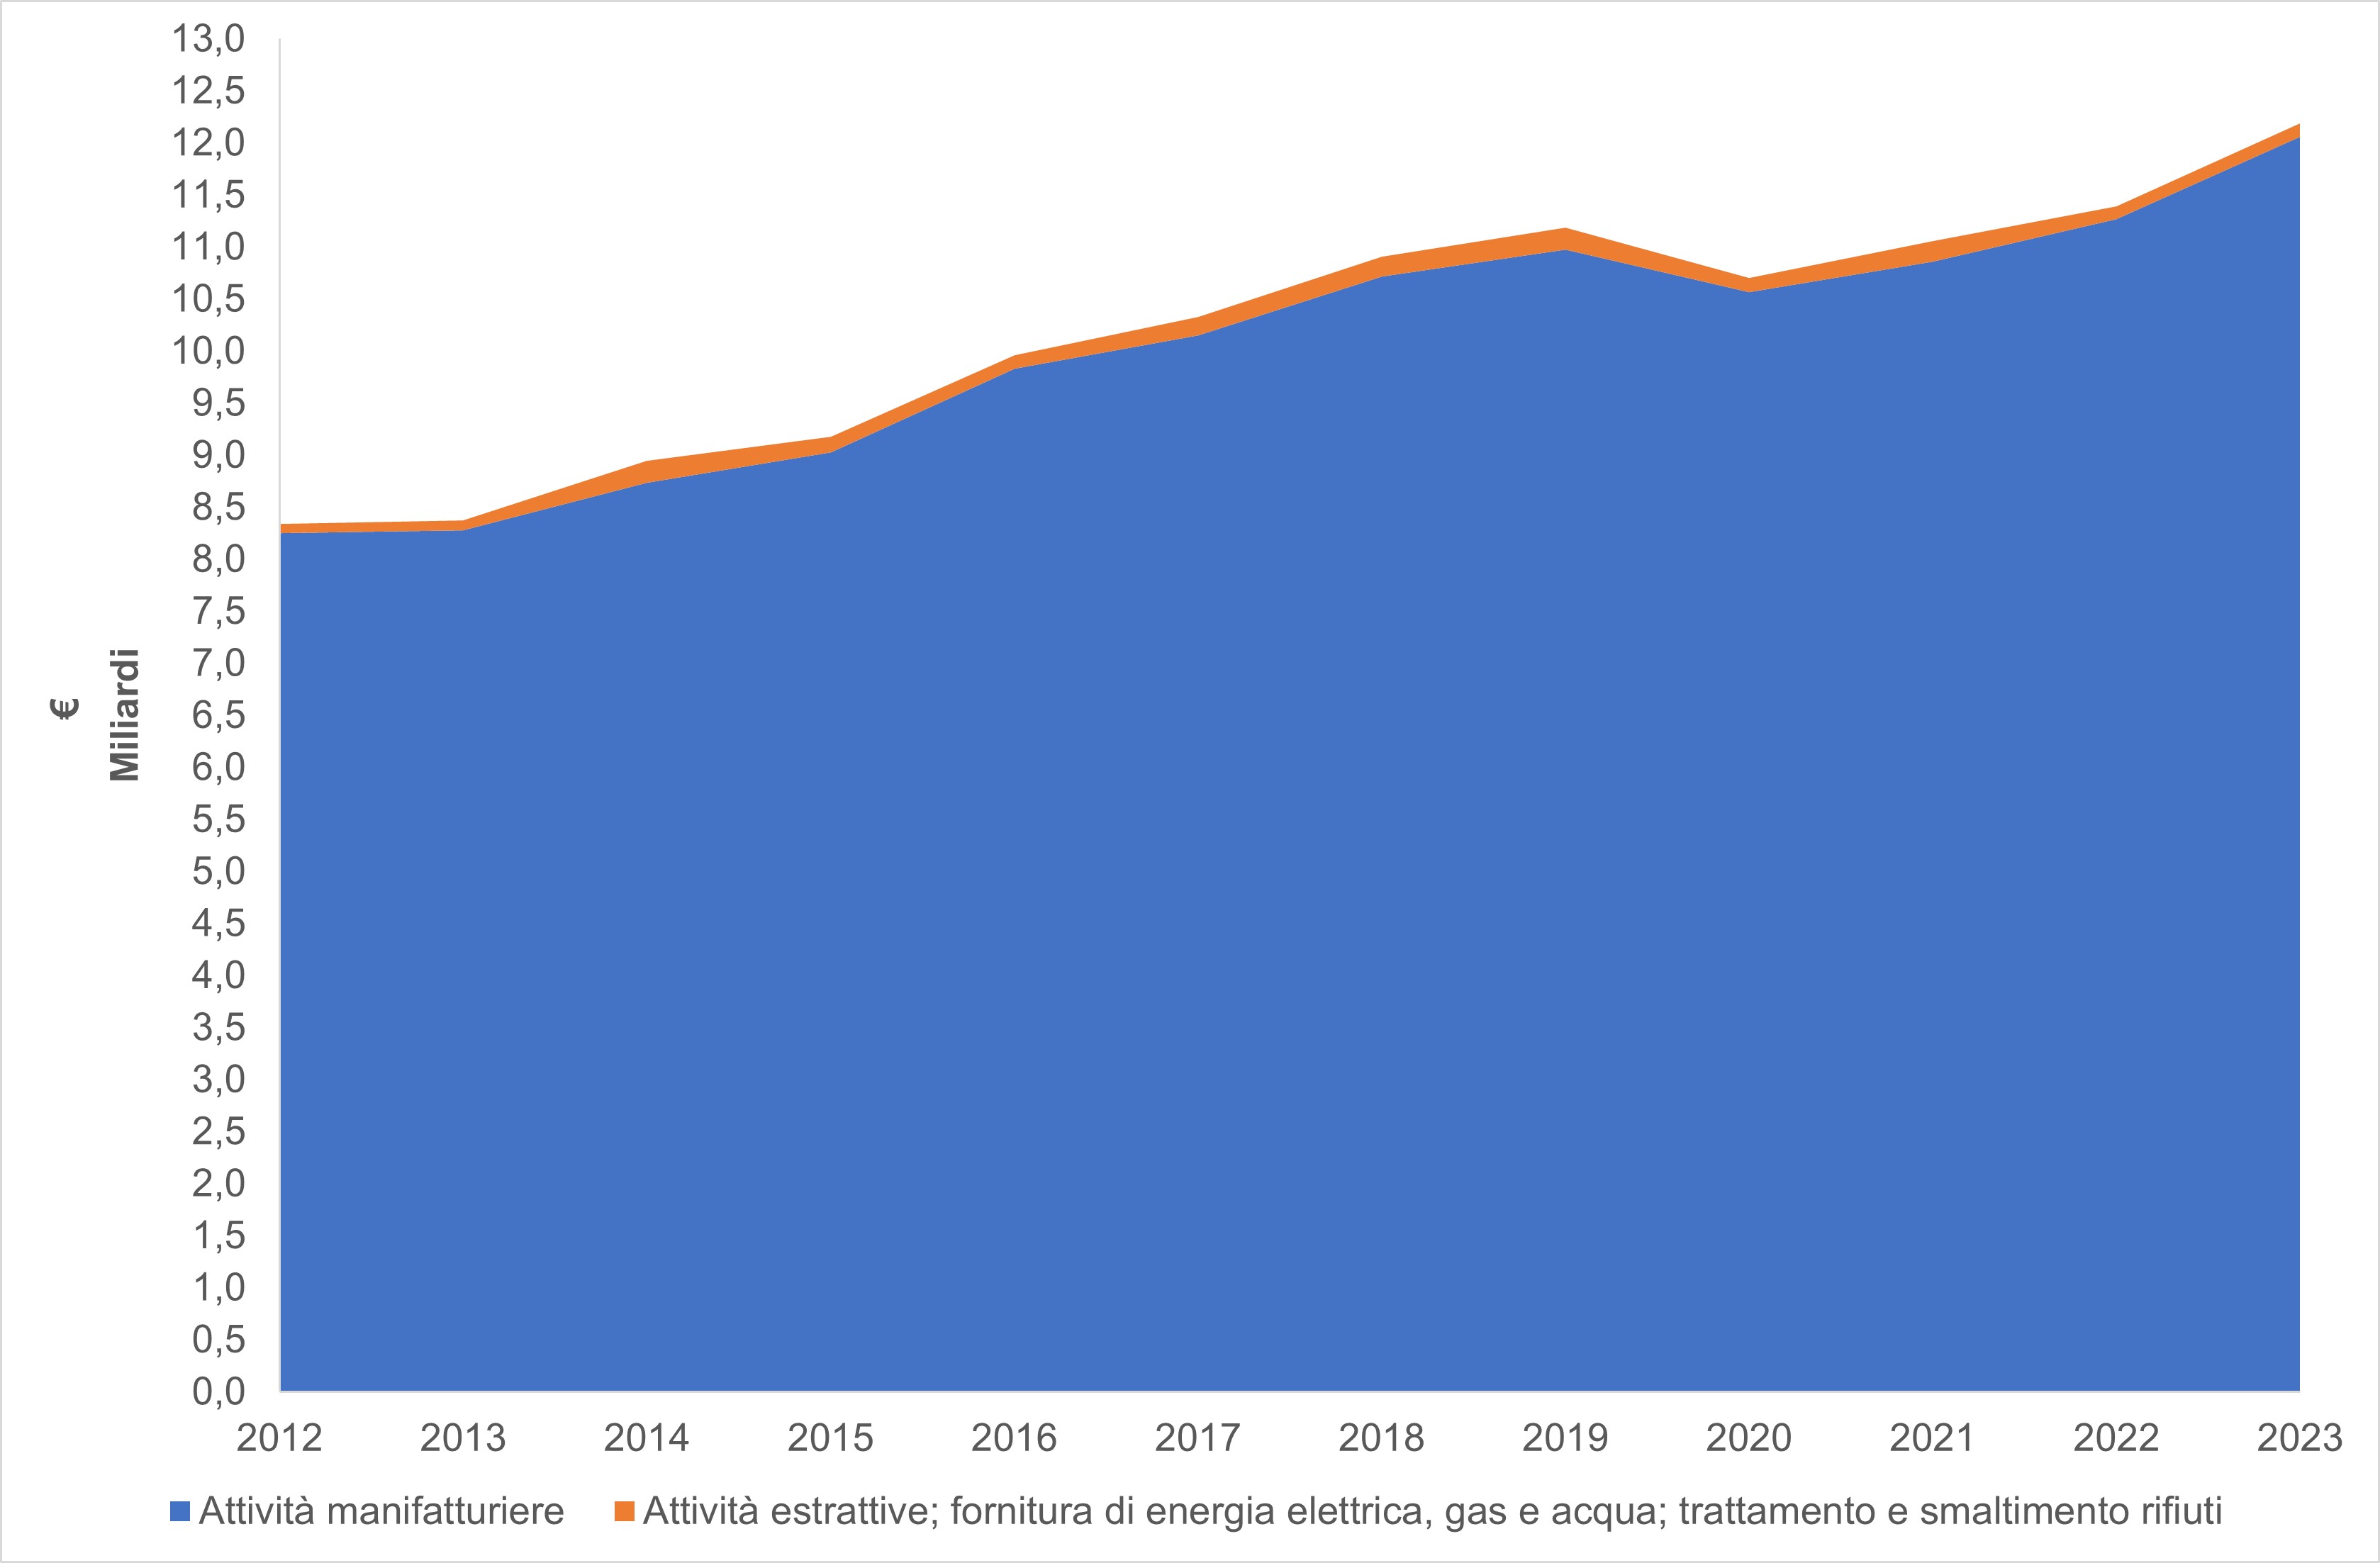
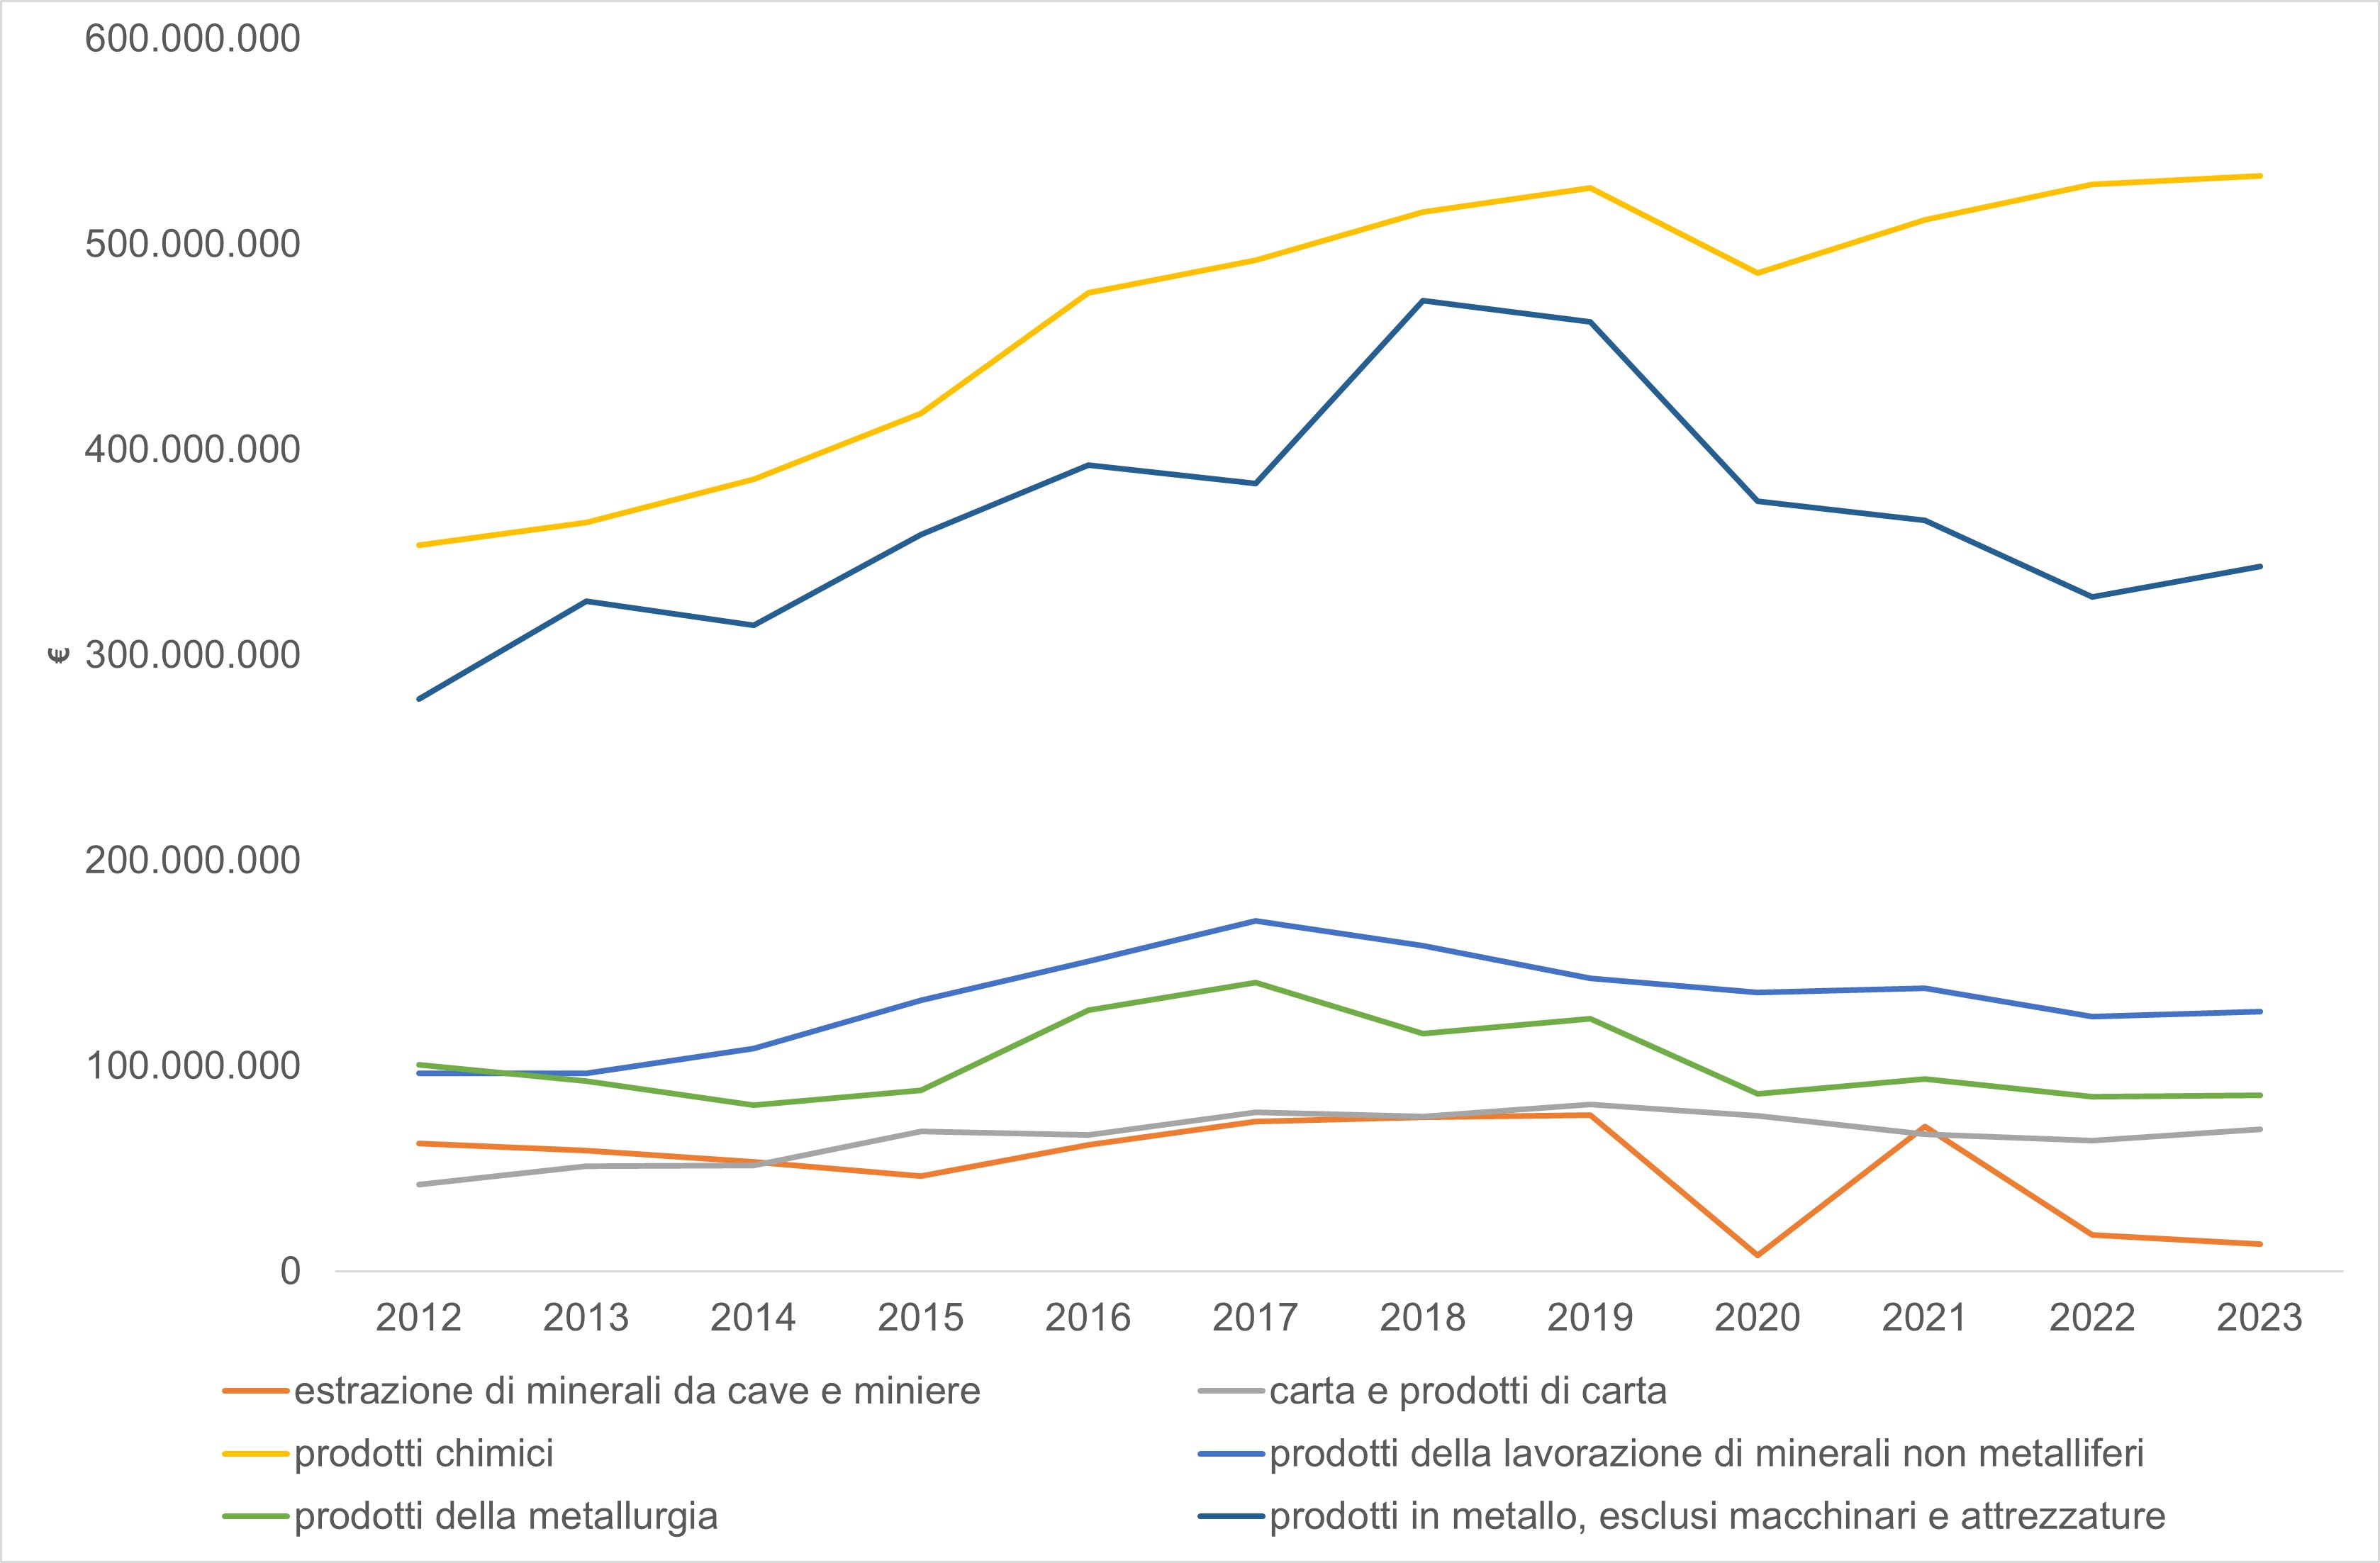
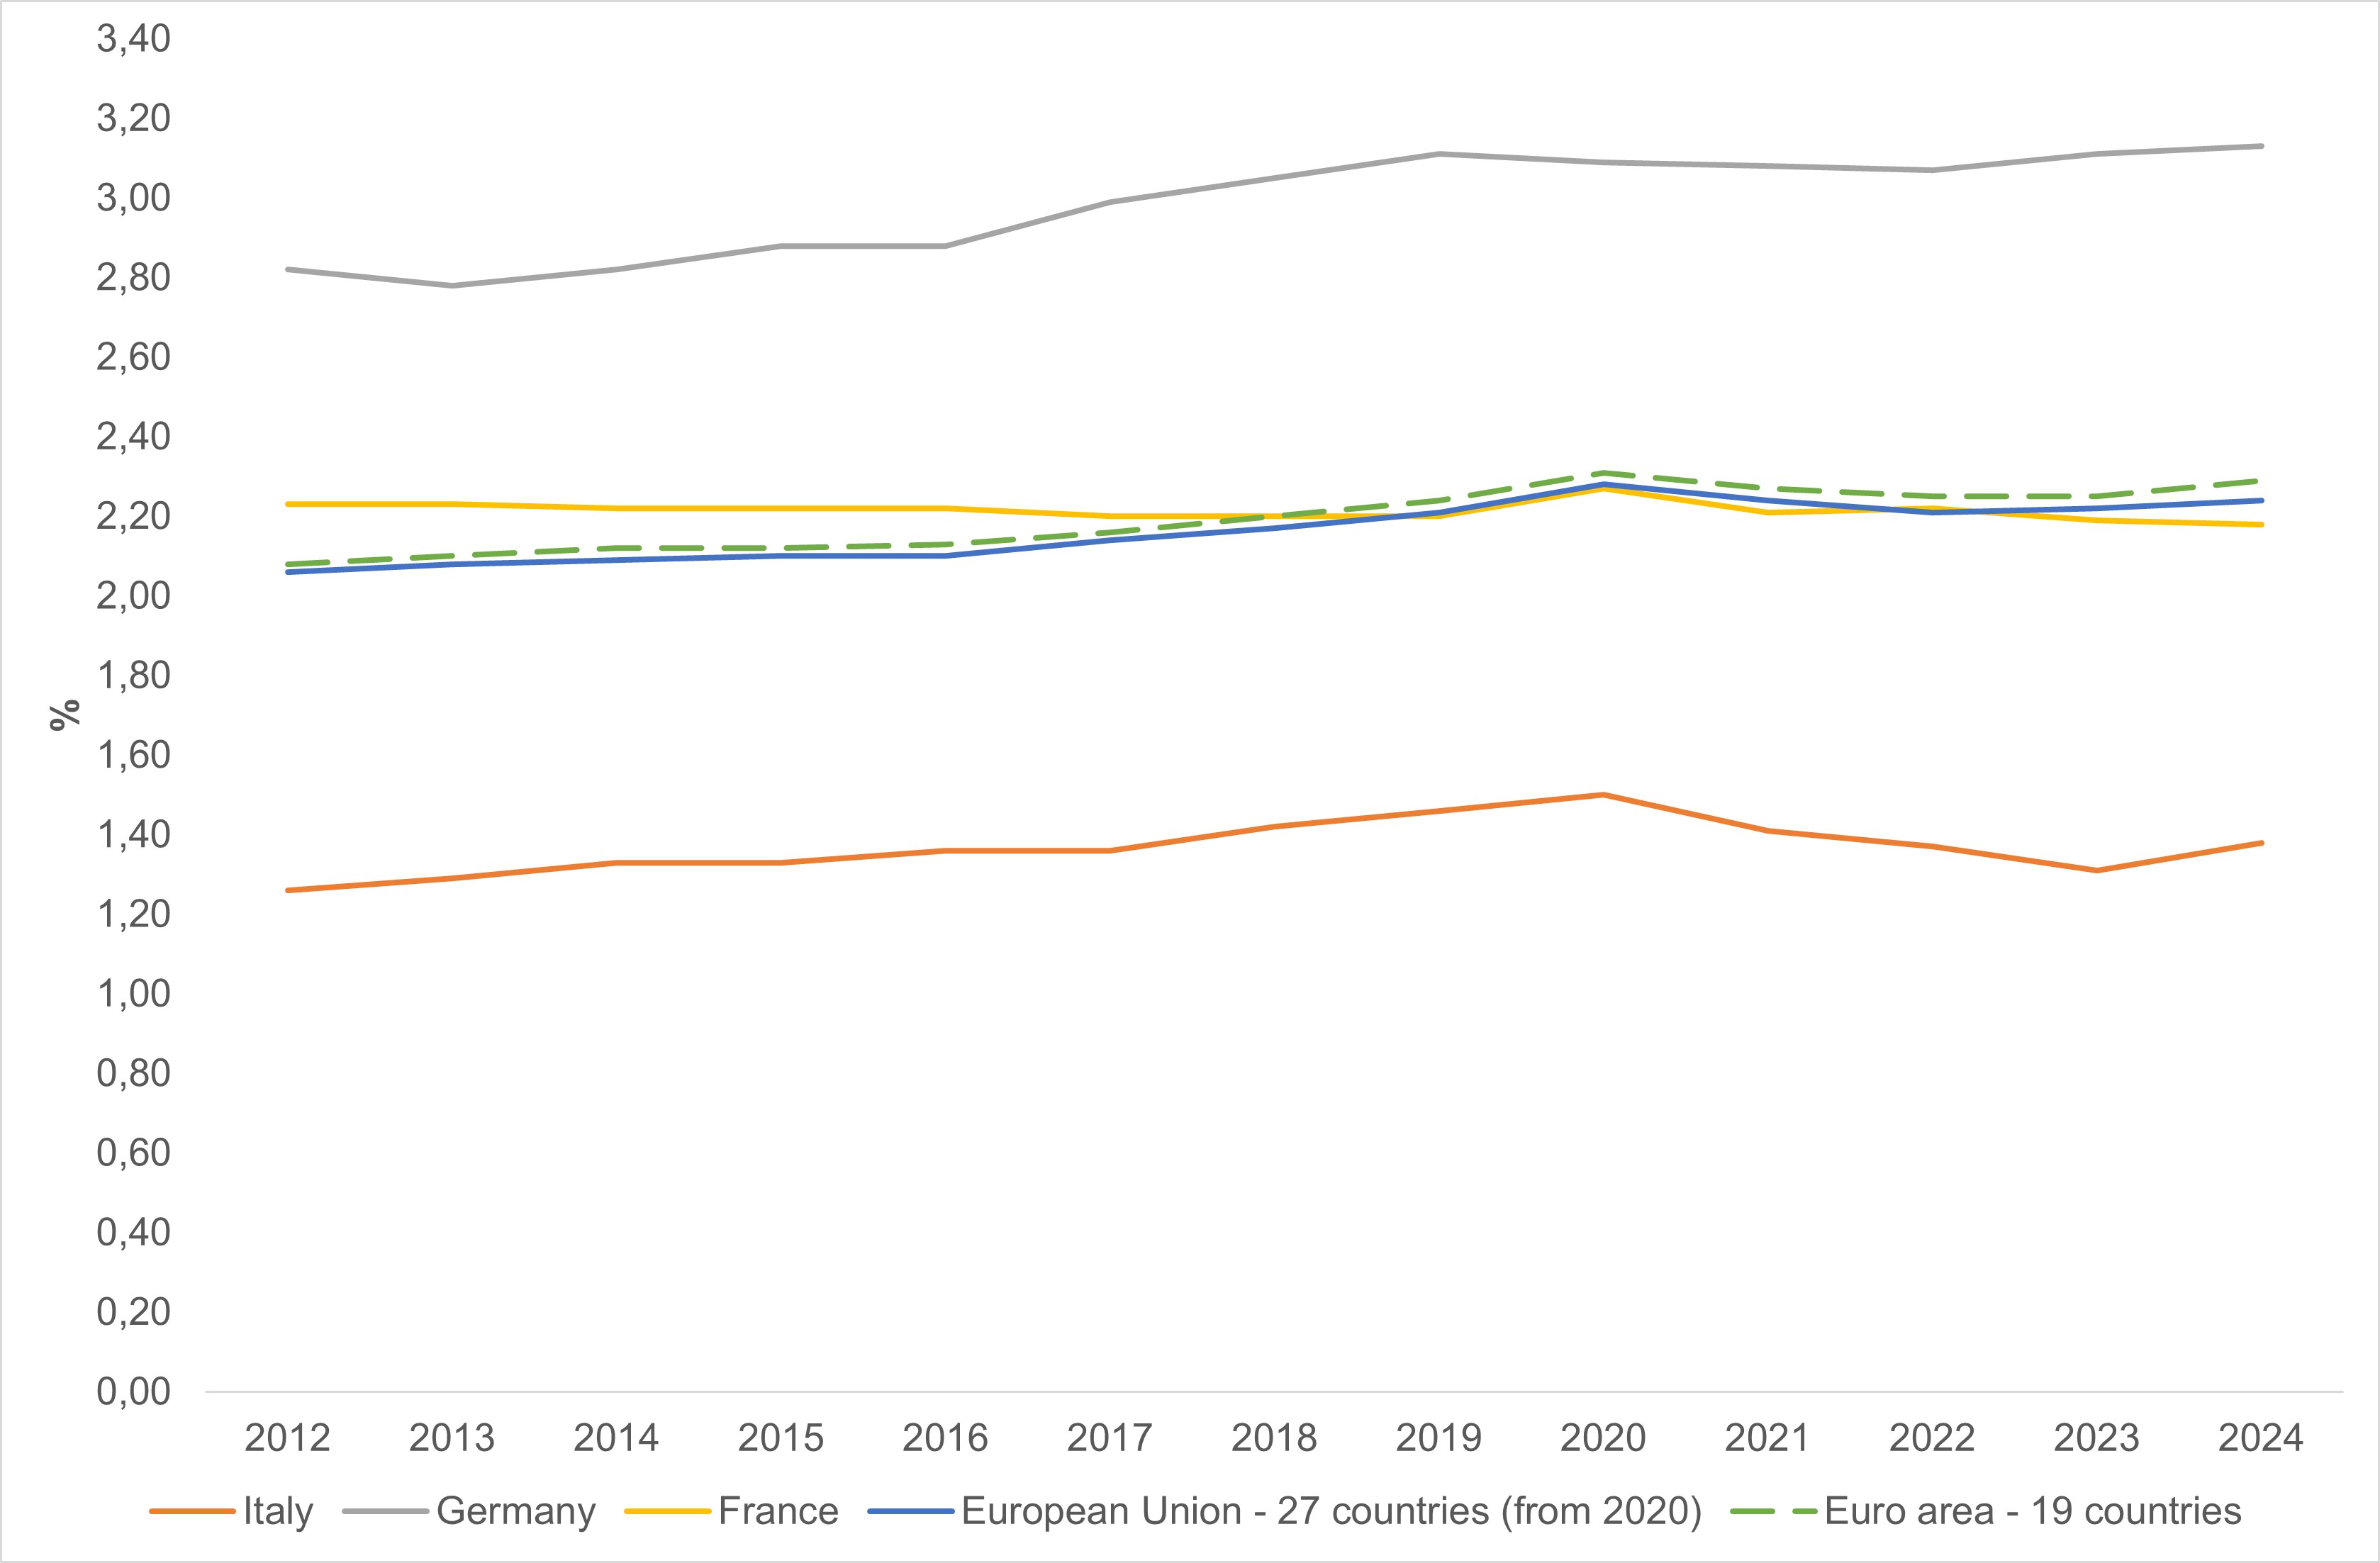
In 2023, intramural R&D expenditure by enterprises operating in industry amounted to EUR 12.19 billion, an increase of EUR 795 million (+7%) compared with 2022. Approximately 99% of total expenditure was generated by manufacturing activities (EUR 12.0 billion), while the remaining share (EUR 0.13 billion) was attributable to mining and quarrying and to electricity, gas, water supply, and waste management activities (Table 1). The main source of financing continues to be enterprises' own funds, accounting for 88.9% of total R&D expenditure, while funding from the rest of the world represents 8.3% (Table 2). Data relating to funding from public institutions, universities, and non-profit organisations cannot be published because of statistical confidentiality requirements. Expressed as a share of GDP, total R&D expenditure stood at approximately 1.38% in 2024, confirming Italy's gap with Germany (around 3.13%), France (around 2.18%), and the euro area average (around 2.24%) (Table 4, Figure 3). From an environmental perspective, the overall increase in R&D expenditure has not yet translated into a clear shift towards low-carbon technologies. Investment remains predominantly concentrated in the chemical and metallurgical industries, sectors that are potentially associated with relatively high environmental impacts (Figure 2). Although investment in the most energy-intensive activities has declined slightly, the data suggest the beginning of a gradual transition towards more efficient and sustainable production processes. This represents a positive signal; however, progress remains insufficient to consider the pathway towards climate neutrality fully satisfactory.
Between 2012 and 2023, intramural R&D expenditure in the industrial sector increased by 46.1%, rising from EUR 8.34 billion to EUR 12.19 billion (Table 1). Following the contraction recorded in 2020 (–4.3% compared with 2019) as a consequence of the COVID-19 pandemic, cumulative growth during 2022–2023 reached 13.9%, bringing expenditure above pre-crisis levels (Table 1). The dynamic is driven by the manufacturing sector (Figure 1), where expenditure increased by 7% over the last year, whereas mining and utility activities recorded a more modest increase of 2% (Table 1). After rising gradually to 1.51% of GDP in 2020, the R&D intensity indicator declined during the following three years to approximately 1.38% in 2024. Over the medium term, a significant divergence has emerged: while total R&D expenditure has continued to increase, investment in the most material-intensive sectors has declined, suggesting a gradual reallocation of resources towards industrial value chains with greater sustainability potential. Nevertheless, the pace of convergence remains modest, and the gap relative to the European target of 3% of GDP devoted to R&D, with a strong emphasis on green innovation, as set out in the Council Recommendation of 26 November 2021 on a Pact for Research and Innovation in Europe (2021/C 431/01), indicates that although the trajectory is moving in the right direction, substantially faster progress will be required to meet the European Union's environmental ambitions.
| Allegati |
|---|
Headline
Table 1: Intramural R&D expenditure by enterprises in the industrial sector (narrow definition) (2012–2023) Data source
ISPRA elaboration based on Istat data Note
The valuation is at current prices. The source of financing is the total economy. |
Headline
Table 2: Research and Development expenditure by the industrial sector (narrow definition) by source of funding (2012–2023) Data source
ISPRA elaboration based on Istat data Data legend
c: data suppressed to protect statistical confidentiality Note
Valuations at current prices |
Headline
Table 3: Intramural R&D expenditure by industrial enterprises by economic activity sector (2012–2023) Data source
ISPRA elaboration based on Istat data Note
Valuations at current prices |
Headline
Table 4: Business R&D expenditure as a percentage of GDP, major industrialized countries and European geopolitical aggregates (2012–2023) Data source
ISPRA elaboration based on EUROSTAT data Data legend
b: break in the time series; e: estimated data; p: provisional data |
Thumbnail
Headline
Figure 1: Intramural R&D expenditure by enterprises in the industrial sector (narrow definition) (2012–2023) Data source
ISPRA elaboration based on Istat data Note
The valuation is at current prices. The source of financing is the total economy. |
Thumbnail
Headline
Figure 2: Intramural R&D expenditure by industrial enterprises by economic activity sector (2012–2023) Data source
ISPRA elaboration based on Istat data Note
Valuations at current prices |
Thumbnail
Headline
Figure 3: Business R&D expenditure as a percentage of GDP, major industrialized countries and European geopolitical aggregates (2011–2024) Data source
ISPRA elaboration based on EUROSTAT data Data legend
b: break in the time series; e: estimated data; p: provisional data |
In 2023, the chemical industry remained the largest recipient of R&D investment, with 533 million euros allocated to R&D (+0.8% compared with 2022 and +50.8% relative to 2012), highlighting the strategic role of the chemical sector, including fine chemicals and specialty chemicals, in the development of new technological solutions. It was followed by the manufacture of fabricated metal products (EUR 343 million; +4.6%), non-metallic mineral products, including cement, glass, and ceramics (EUR 126 million; +1.8%), basic metallurgy (EUR 86 million; +0.9%), and the paper industry (EUR 69 million; +8.6%). By contrast, mining and quarrying activities experienced a sharp decline to EUR 14 million (–24.4%), confirming a trend already observed in 2020 (Table 3). In 2023, almost 46% of the R&D expenditure reported for the environmentally relevant sectors shown in Table 3 was concentrated in the chemical industry, while the combined share of the most material- and energy-intensive sectors (non-metallic mineral products, metallurgy, fabricated metal products, paper manufacturing, and mining) declined to 54%, representing a substantial reduction compared with 2012. When considered together with the financing structure presented in Table 2, these data indicate that enterprises' own financial resources are increasingly directed towards activities with higher technological content, while more traditional industrial value chains receive a comparatively smaller share of investment. If this gradual reallocation continues to favour clean technologies and resource-efficient production processes, it could contribute to reducing the environmental footprint of Italian industry. However, to translate this potential into measurable outcomes and to narrow the gap with the EU average, highlighted in Table 4, it will be necessary to strengthen targeted policy instruments, including green tax credits, Horizon Europe partnerships, and the allocation of National Recovery and Resilience Plan (NRRP) resources to eco-innovation projects.