Mara D'Amico, Valeria Tropea, Silvia Ubaldini
As of 31 December 2024, the number of organisations listed in the EMAS register, net of cancellations and suspensions, totals 1,185. This figure confirms a recovery compared to 2018, showing an increase of 22.8%. The total number of new EMAS certificates issued to organisations/businesses is 2,357. The productive sectors with the highest participation are: Waste and Material Recovery, Energy, Building and Landscape Services, Specialised Construction Works, Public Administration, and Wholesale Trade. The leadership of the Central-Northern regions is reflected in regional measures supporting EMAS. The most active regions are Lombardy, Tuscany, Emilia-Romagna, and Lazio. Regarding EMAS registrations by organisation type, recent years show a generally stable situation with a balanced distribution among small, medium, and large enterprises.
The indicator defines the number of EMAS registrations granted to organisations and businesses within the national territory. It represents a useful measure to assess the level of attention given to environmental issues by organisations/businesses. The motivations behind choosing EMAS registration are diverse and can be classified according to the benefits it provides. These include: prevention and reduction of environmental impacts; reduction of accident risks; decreased consumption of raw materials and energy; reduction of emissions and waste; combating climate change; improvement of environmental performance; enhanced communication and transparency; an environmental management approach aligned with the principles of the circular economy; bureaucratic/administrative facilitations; access to benefits and incentives; and increased employee engagement.
Provide an overview of the level of attention to environmental issues by the production sector and, more generally, by all organisations, with the aim of containing their pressure on environmental matrices. Monitor the evolution of prevention programmes and environmental performance improvement initiatives implemented by organisations, as well as the dissemination and promotion projects of environmental quality carried out by Public Administration.
Regulation (EC) No 1221/2009 and subsequent amendments.
The reference legislation does not set any predefined targets, as this scheme is voluntary.
L'indicatore non riporta il numero dei siti registrati e collegati a ogni singola organizzazione.
Development of the indicator for monitoring the number of registered sites.
ISPRA
List of EMAS Registered Organisations – https://www.isprambiente.gov.it/en/activities/certifications/emas/list-of-emas-registered-organisations
National, regional
1997-2024
Count of EMAS registrations (organisations and certificates).
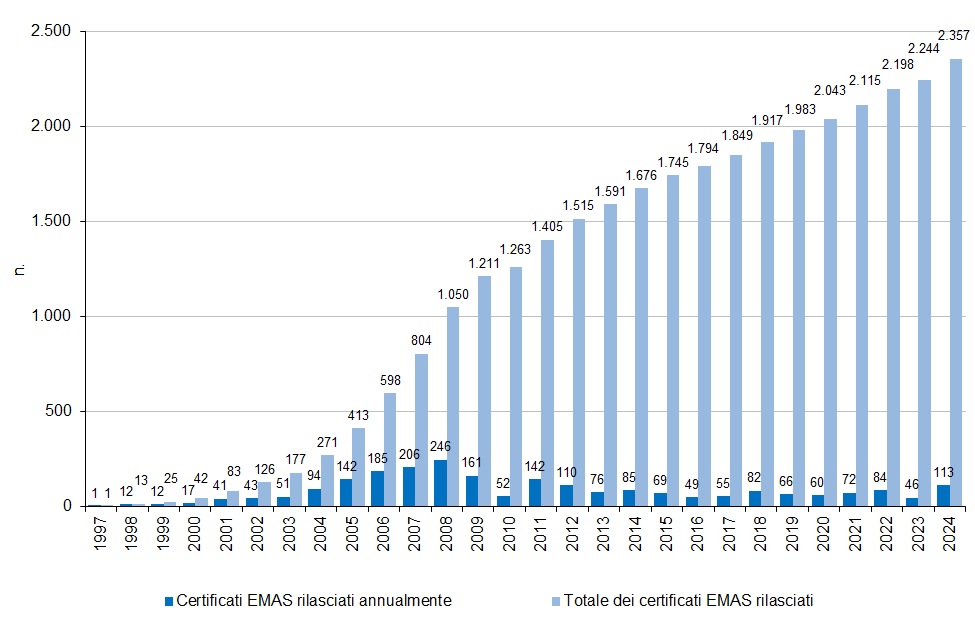
EMAS registrations have increased also thanks to policies promoting Green Public Procurement and environmental certifications (e.g., incentives included in the Public Procurement Code). In 2024, the total number of new EMAS certificates issued to organisations/businesses reaches 2,357 (Figure 2).
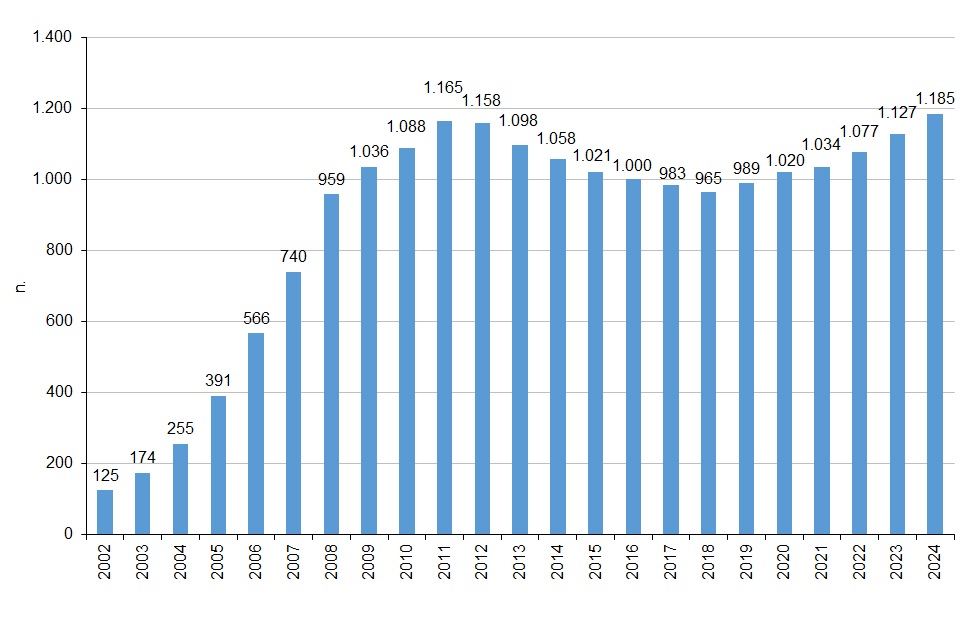
The upward trend is confirmed, essentially driven by an increase in new registrations compared to cancellations. From 2018 to 2024, the number of registered organisations/businesses rose from 965 to 1,185, representing a growth of 22.8% (Figure 1).
| Allegati |
|---|
Titolo
Table 1: Number of EMAS-registered organisations/companies by region Fonte
ISPRA |
Thumbnail
Titolo
Figure 1: Evolution of the number of EMAS-registered organisations/companies in Italy Fonte
ISPRA |
Thumbnail
Titolo
Figure 2: Evolution of the number of EMAS certificates issued in Italy Fonte
ISPRA |
Thumbnail
Titolo
Figure 3: Distribution of EMAS-registered organisations/companies by NACE code (2024) Fonte
ISPRA |
Thumbnail
Titolo
Figure 4: Regional distribution of EMAS-registered organisations/companies (2024) Fonte
ISPRA |
Thumbnail
Titolo
Figure 5: Percentage breakdown of EMAS-registered organisations/companies by geographical area (2024) Fonte
ISPRA |
Thumbnail
Titolo
Figure 6: Percentage breakdown of EMAS-registered organisations/companies by type (2024) Fonte
ISPRA |
The indicator is effective for monitoring organisations (both public and private companies) undertaking a path of improving their environmental performance within the framework of the circular economy, through the adoption of eco-innovation and Best Available Techniques (BAT), as well as the implementation of green procurement policies (Green Public Procurement – GPP).
The number of active registrations corresponds to the number of certificates issued, net of cancellations or suspensions occurring each year. In 2024, the number of organisations/businesses registered in the EMAS scheme stands at 1,185 (Table 1 and Figure 1).
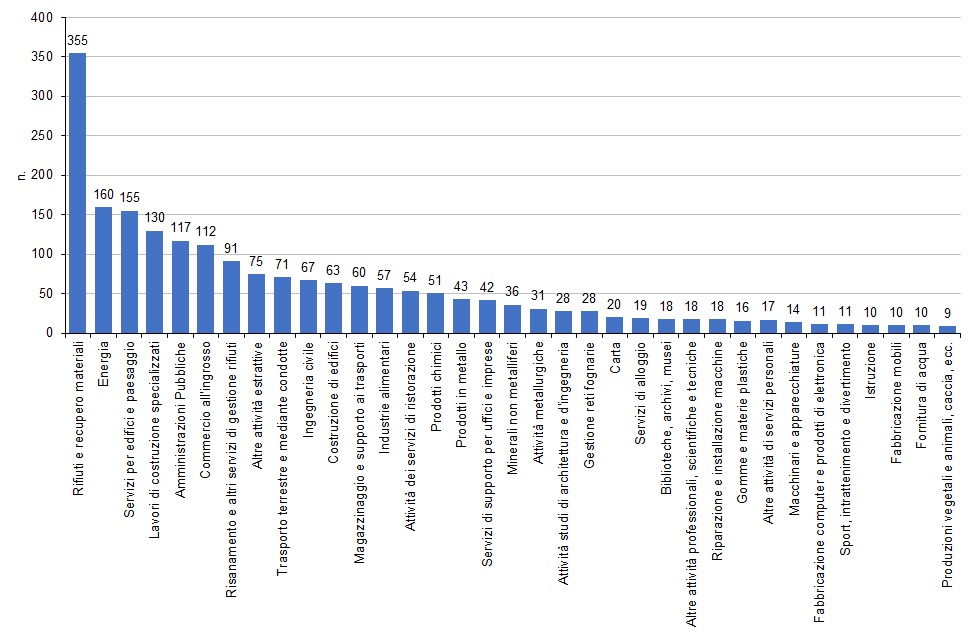
The sectors showing the highest participation belong to the following categories: Waste and materials recovery, Energy, Building and landscape services, Specialised construction works, Public administration, and Wholesale trade (Figure 3). Notably, the significant growth in the Building and landscape services sector consolidates its position in third place, ahead of Public administration and Wholesale trade.
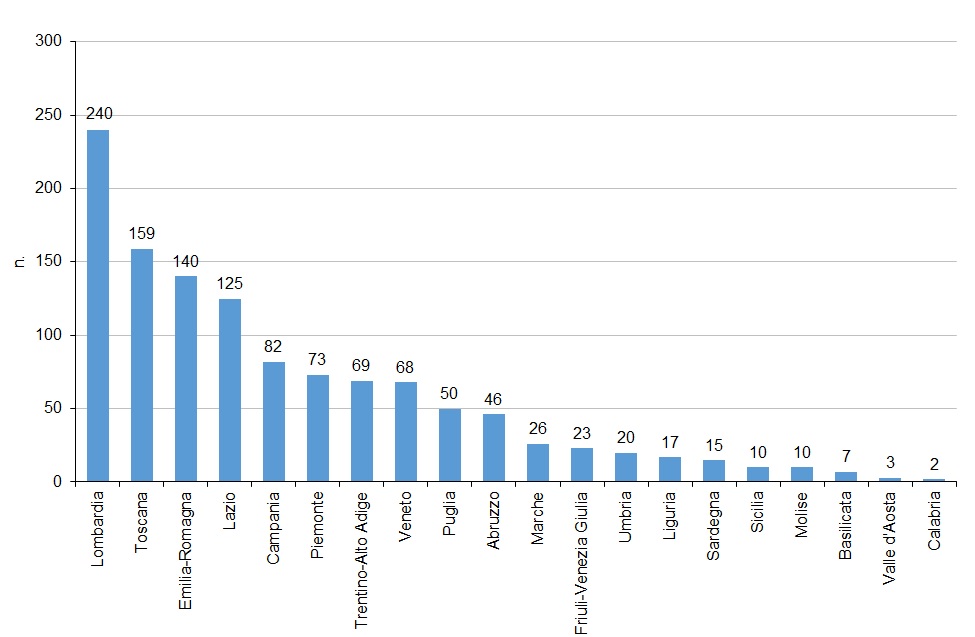
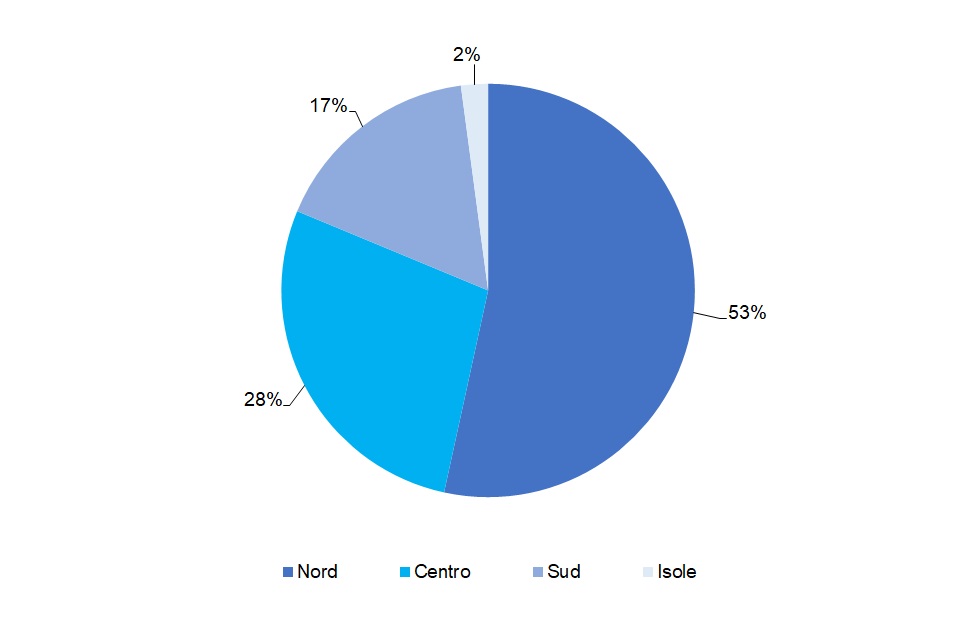
The leadership remains with the Central-Northern regions (Figure 5). Indeed, the highest number of registrations is observed in Lombardy, Tuscany, Emilia-Romagna, and Lazio (Table 1 and Figure 4); Tuscany’s second place is primarily due to the participation of the marble sector.
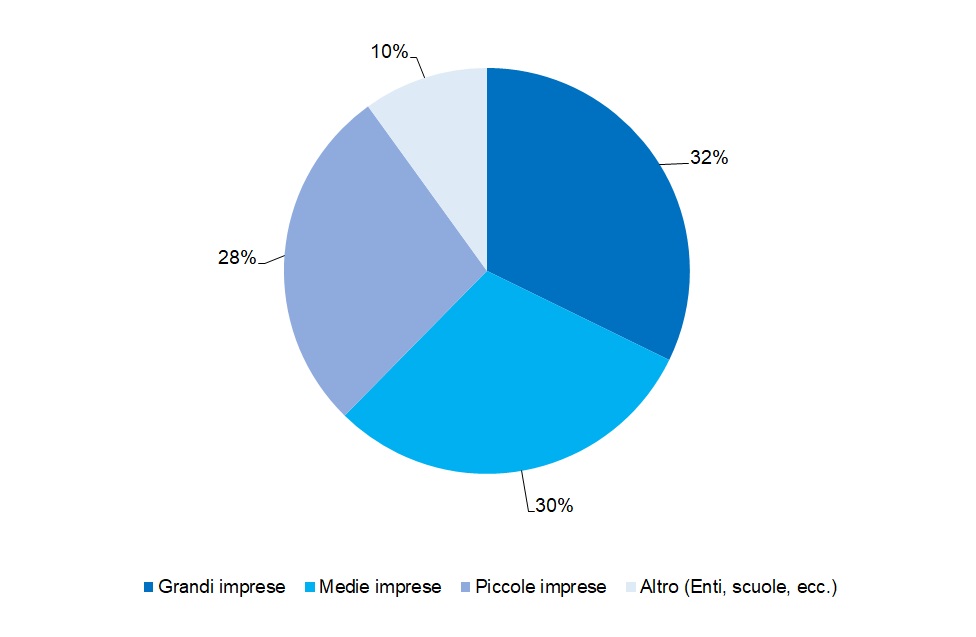
Regarding EMAS registrations by type of organisation, there is a substantially even distribution among small, medium, and large enterprises (Figure 6).