Antonio Caputo
The energy intensity indicator expresses the relationship between energy consumption (whether gross or final) and the Gross Domestic Product (GDP) expressed at chain-linked market prices. This parameter represents a fundamental measure of the energy efficiency of an entire economic system, indicating how much energy is consumed to generate a unit of wealth. The analysis of the Italian time series between 1995 and 2024 reveals a progressive and structural decoupling between economic growth and energy consumption. In the face of economic fluctuations, the Italian productive and civil system has recorded a clear increase in efficiency, significantly reducing the quantity of energy necessary to produce national wealth, driven above all by the technological transformation of the industrial and civil sectors.
The internal comparison within the European Union highlights that Italy's primary and final energy intensity is lower than the European average due to the historical shortage of primary energy sources (which has favored the creation of economical behaviors and infrastructures in the use of energy and a production structure that is not excessively energy-intensive), the strong taxation (which has increased the cost of energy sources to end users beyond the values of other countries), the lower per capita income, and the relatively mild climate. According to an increasing ranking of gross energy intensity values, Italy ranks 7th among the countries of the European Union.
The indicator measures the energy efficiency of economic systems, i. e. The quantity of energy needed per unit of GDP produced. In particular, gross energy intensity is defined by the ratio between gross domestic energy consumption and GDP, while final energy intensity is defined by the ratio between final energy consumption and GDP.
Evaluate the relationship between the trend of energy consumption and economic growth, in order to increase the efficiency of energy consumption.
With Decision no. 1386/2013/EU, the European Union has defined the VII general action program on the environment, the guidelines of which have guided community policies until 2020. As a continuation of this commitment, on 6 April 2022 the European Parliament and the Council formally approved Decision (EU) 2022/591, which establishes the VIII environmental action program (PAA) in force until 31 December 2030. This new strategic framework aims to accelerate the green transition by establishing six priority thematic objectives for climate and biodiversity, supported by annual monitoring and a mid-term review to assess progress. Nonetheless, for the indicator in question, specific quantitative objectives or targets deriving from this programming are not applicable.
ENEA, Energy and Environment Report, various years
MASE, EUROSTAT (Statistical Office of the European Communities)
EUROSTAT, https://ec. europa. eu/eurostat/data/database
MASE, National Energy Balance, various years, https://sisen. mase. gov. it/dgsaie/
National
1995-2024
The indicator consists of several parameters: • the ratio between gross domestic energy consumption and gross domestic product (GDP) at chain-linked market prices in 2020 for a given calendar year. • the ratio between final consumption and GDP at market prices at chained values in 2020, while the sectoral intensity is given by the ratio between final consumption in toe and value added at chained values in 2020.
The final energy intensity in 2024, equal to 55.5 toe consumed per million € (toe/M€), grew by 0.65% compared to 2023. The various sectors have very different intensities (Table 1). The extractive and manufacturing industries and agriculture have the highest values: 77.2 toe/M€ and 87.4 toe/M€, respectively. Among the sectors with the lowest energy intensity are the construction sector (7.2 toe/M€) and services (13.4 toe/M€).
Despite considerable annual variability, over a long-term period a decreasing trend in final energy intensity is observed, due to a decrease in energy used per unit of GDP produced. Overall, the final energy intensity in the period 1995-2024 was reduced by 20% (Table 1). In the same time interval, the construction and services sectors recorded a significant increase in energy intensity, 218% and 22% respectively. On the other hand, other sectors, especially industry, contribute to the decrease in intensity. The energy intensity of the mining and manufacturing industries fell by 37%, while those of the transport and agriculture and fishing sectors both fell by 14%.
| Allegati |
|---|
Headline
Tabella 1: Intensità energetiche finali settoriali e totali in Italia Data source
Elaborazione ISPRA su dati MASE, Eurostat |
Headline
Tabella 2: Intensità energetica lorda del PIL ai prezzi di mercato a valori concatenati Data source
Elaborazione ISPRA su dati MASE, Eurostat |
Headline
Tabella 3: Intensità energetica finale del PIL ai prezzi di mercato a valori concatenati Data source
Elaborazione ISPRA su dati MASE, Eurostat |
Thumbnail
Headline
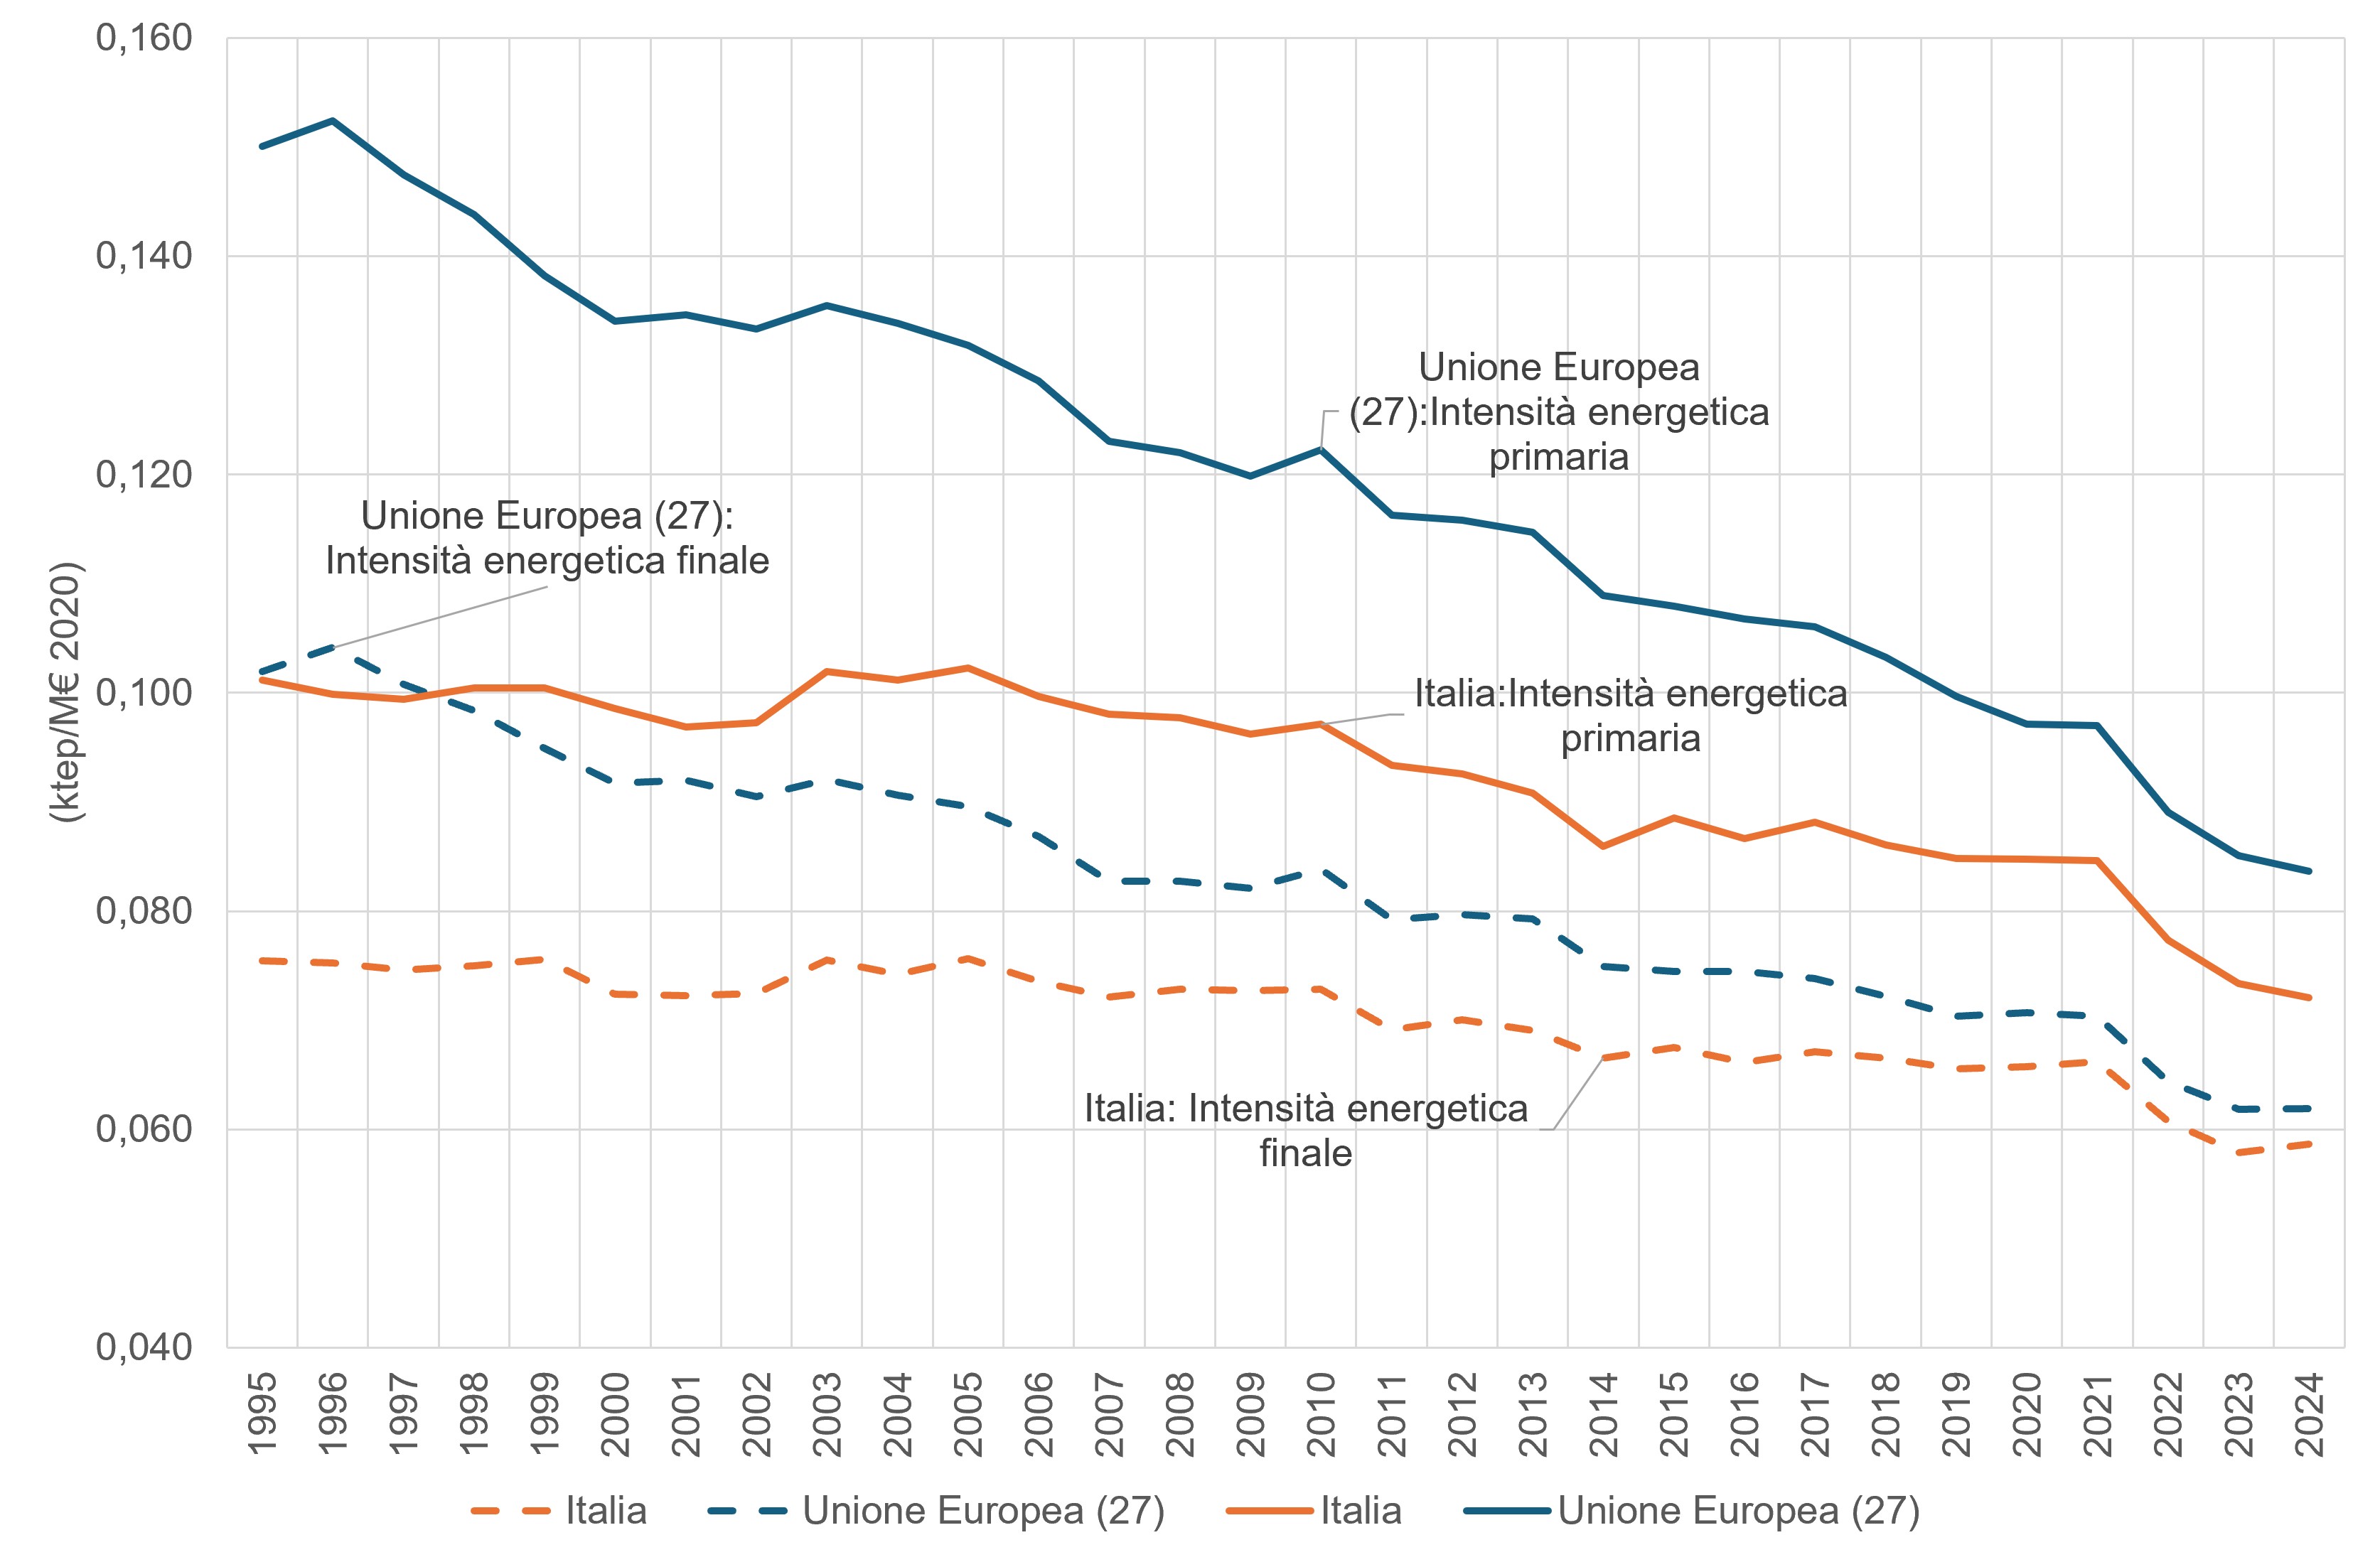
Figura 1: Intensità energetica primaria e finale per Italia e Unione Europea Data source
Elaborazione ISPRA su dati MASE, Eurostat |
The reasons behind this profound contraction in Italian energy intensity lie in both structural and technological factors. The clear decrease in intensity in industry reflects the progressive delocalization or closure of heavy and low value-added manufacturing activities in favor of high-tech industrial sectors, where the production of economic wealth requires less physical energy input. Added to this is the widespread adoption of energy management systems and high-efficiency industrial electric motors. The parable of the civil sector, which noticeably declined after 2010, finds its explanation in the strict European and national regulations on the energy efficiency of buildings, in the introduction of generous tax incentives for thermal renovations and in the replacement of old heating systems with modern heat pumps. As regards the gap between gross intensity and final intensity, the narrowing of the gap is linked to the profound transformation of the national electricity generation park: the progressive closure of traditional coal and fuel oil thermoelectric power plants, characterized by strong thermal losses, and their replacement with combined cycle gas power plants and above all with wind and photovoltaic plants has drastically increased the conversion efficiency of the energy system, reducing the gross energy necessary for the same final consumption. Finally, the decline recorded in the last years of the series is also affected by the dynamics of post-2022 energy prices, which have pushed businesses and citizens to optimize consumption and cut waste in order to preserve added economic value.
The internal comparison within the European Union highlights that both the gross energy intensity and the final energy intensity of Italy remain lower than the European average due to the historical shortage of primary energy sources (which has favored the creation of economical behaviors and infrastructures in the use of energy and a production structure that is not excessively energy-intensive), the strong taxation (which has increased the cost of energy sources to end users well beyond the typical values in other countries), the lower per capita income and the relatively mild climate.