Gaia Bazzi, Matteo Fontanella (LIPU), Simona Imperio, Federica Luoni (LIPU), Roberta Righini (LIPU)
Birds in agricultural areas represent effective indicators of environmental quality thanks to their sensitivity to habitat changes and the possibility of monitoring their populations with standardized methodologies on a large scale. Due to these characteristics, the Farmland Bird Index is adopted by the European Commission as a context indicator of the Common Agricultural Policy to evaluate the state of biodiversity in agroecosystems and the effectiveness of rural land conservation and management measures.
The national indicator, calculated on the basis of the trend of 28 species typical of agricultural environments in the period 2000-2025, highlights an overall decline of 33.49%, with 71% of the species considered to be decreasing. Even the indicator relating to the typical species of mountain grasslands (FBIpm), calculated on the trend of 13 species, shows a reduction of 29.90%, with 46% of the species in decline. The results reveal a persistent deterioration of biodiversity associated with Italian agricultural environments and the need to strengthen the conservation measures envisaged by national and European strategies for biodiversity.
The Farmland Bird Index (FBI) provides a summary assessment of the health of agricultural ecosystems through the trend of populations of common birds associated with rural environments. It is based on data collected as part of the national monitoring program for common nesting birds, started in 2000 and subsequently integrated into the Farmland Bird Index project promoted by the Ministry of Agriculture, Food Sovereignty and Forestry (MASAF). Since 2009, the calculation of the indicator has been carried out by Lipu as part of the same project.
the Farmland Bird Index (FBI) is constructed using population trends of 28 bird species associated with agricultural environments, while the Farmland Bird Index of mountain grasslands (FBIpm) considers 13 species from open mountain environments.
In addition to these national level indicators, indicators referring to six ornithological zones are also developed (Alpine zone, pre-Alpine and Apennine reliefs, hill systems, alluvial plains, Mediterranean reliefs, Mediterranean steppes), each with indicator species representative of the respective ecological peculiarities; this in order to highlight the dynamics of bird populations in homogeneous environmental contexts. The analysis on an environmental scale allows us to integrate the information provided by national indicators, highlighting geographical differences and local critical issues that may not emerge from the overall trend observed at a national level.
Assess the health of Italian agricultural ecosystems by monitoring population trends of common birds associated with agricultural environments and mountain grasslands, providing a synthetic indicator of the state of biodiversity and the effectiveness of agri-environmental policies.
The European Commission has confirmed the Farmland Bird Index as a C36 context indicator - Index of avifauna present in agricultural areas, in the 2023-2027 CAP programming (already C35 in previous programming), within the scope of the Common Agricultural Policy (CAP), in order to monitor the effectiveness of the actions undertaken and the health of these habitats.
The main regulatory reference for the 2023-2027 CAP is Regulation (EU) 2021/2115 of the European Parliament and of the Council (2 December 2021), which contains the rules on support for the strategic plans that Member States must draw up. The indicator responds directly to Specific Objective 6 (SO6) listed in the Art. 7, namely "Contribute to halting and reversing biodiversity loss, improving ecosystem services and preserving habitats and landscapes".
- Blondel, J., Ferry, C., & Frochot, B. (1981)[SI1] . Point counts with unlimited distance. Studies in avian biology , 6(1), 87.
- Donald, P. F., Green, R. E., & Heath, M. F. (2001). Agricultural intensification and the collapse of Europe's farmland bird populations. Proceedings of the Royal Society of London. Series B: Biological Sciences, 268(1462), 25-29.
- Fornasari, L., de Carli, E., Brambilla, S., Buvoli, L., Maritan, E. & Mingozzi, T. (2002). Distribution of nesting birds in Italy: first bulletin of the MITO2000 monitoring project. Avocet, 26, 59–115.
- Gregory, R. D. & van Strien, A. (2010). Wild bird indicators: using composite population trends of birds as measures of environmental health. Ornithol Sci, 9, 3–22.
- Gregory, R. D., van Strien, A., Vorisek, P., Gmelig Meyling, A. W., Noble, D. G., Foppen, R. P., & Gibbons, D. W. (2005). Developing indicators for European birds. Philosophical Transactions of the Royal Society B: Biological Sciences, 360(1454), 269-288.
- Londi, G., Tellini Florenzano, G., Campedelli, T. & Fornasari, L. (2010). An ornithological zonation of Italy. In: Bermejo, A. (Ed.), Bird Numbers 2010 "Monitoring, indicators and targets". Book of abstracts of the 18th Conference of the European Bird Census Council, EBCC-SEO Birdlife, Madrid, pp.77.
- Pe'er, G., Zinngrebe, Y., Moreira, F., Sirami, C., Schindler, S., Müller, R., Bontzorlos V., Clough D., Bezák P., Bonn A., Hansjürgens B., Lomba A., Möckel S., Passoni G., C. Schleyer, J. Schmidt & Lakner, S. (2019). A greener path for the EU Common Agricultural Policy. Science , 365(6452), 449-451.
- Pannekoek, J. & van Strien, A. J. (2005). TRIM 3 Manual (TRends and Indices for Monitoring data). Statistics Netherlands, Voorburg.
- National Network of the CAP & LIPU (2025). National Farmland Bird Index and population trends of the species in Italy in the period 2000-2025. Periodic reports, also on a regional scale. Available on https://www. reterurale. it/farmlandbirdindex
- National Network of the CAP & LIPU (2025). Common birds of agricultural areas in Italy - Update of population trends and the Farmland Bird Index for the National CAP Network.
- Soldaat, L. L., Pannekoek, J., Verweij, R. J., van Turnhout, C. A., & van Strien, A. J. (2017). A Monte Carlo method to account for sampling error in multi-species indicators. Ecological Indicators, 81, 340-347.
- Van Strien, A. J. & Pannekoek, J. (1998). A pilot study on Euromonitoring. Bird Census News. 11, 46-49.
- Van Strien, A. J., Soldaat, L. L. & Gregory, R. D. (2012). Desirable mathematical properties of indicators for biodiversity change. Ecological Indicators. 14, 202-208.
- Voříšek, P., Klvaňová, A., Wotton, S., & Gregory, R. D. (2008). A best practice guide for wild bird monitoring schemes. Czech Society for Ornithology/Royal Society for the Protection of Birds, Prague.
[SI1] Remove bold from all authors
A possible limitation of monitoring is represented by carrying out only one annual visit to each sampling station. This approach may not allow us to optimally intercept the entire period of reproductive activity of all the species considered, in particular those characterized by earlier or later phenologies. However, maintaining a survey period and sampling protocols constant over time guarantees the comparability of the indices between subsequent years and the robustness of the long-term trend analyses.
The increase in the annual sampling effort carried out on the territory could be achieved through the integration of the national monitoring plan with regional and local monitoring projects.
Lipu/RetePac/Mito2000.
The data were processed as part of the Farmland Bird Index project, financed by the Ministry of Agriculture, Food Sovereignty and Forestry through the Pac Network program 2025/2027, EAFRD - European Agricultural Fund for Rural Development.
The data collected as part of the Farmland Bird Index project is owned by the Ministry of Agriculture, Food Sovereignty and Forestry (MASAF). Lipu takes care of its management and extraction subject to ministerial authorization.
To request data it is necessary to send a formal request to the email address farmlandbird@lipu. it
National
2000 - 2025
The detection technique adopted is that of listening points without distance limits (Blondel et al., 1981), with observation sessions lasting 10 minutes for each point (Fornasari et al., 2002). The censuses are carried out during the reproductive period, mainly between May and June, and in the Alpine areas until the first days of July and involve a single repetition within the season. For each listening point, the species observed or heard and the number of individuals contacted within and beyond 100 m of distance are noted on specific field sheets. The data collected are archived in a centralized database and annually subjected to standardized control and validation procedures.
The temporal trends of the populations are processed using the TRIM (TRends and Indices for Monitoring data) software, designed specifically for the analysis of count data deriving from the monitoring of wild populations and recommended by the European Bird Census Council (EBCC) for the analysis of time series deriving from wildlife monitoring programs. For each species, annual abundance indices and related population trends are estimated. The FBI and FBIpm are subsequently calculated as the geometric mean of the indices of the respective target species, taking 2000 as the base year (index = 100).
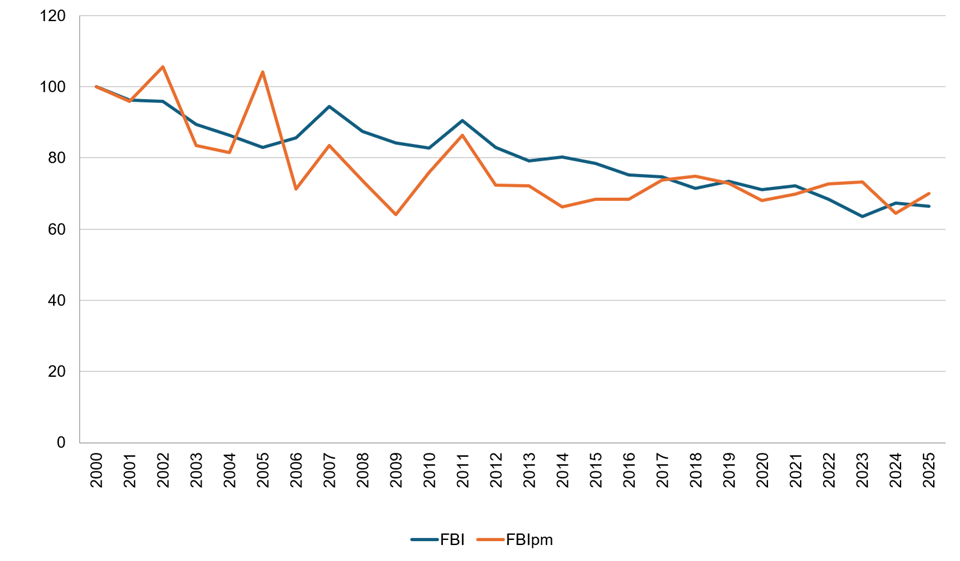
In 2025 the FBI takes on a value of 66.51 and the FBIpm a value of 70.10, considering 100 the reference value of the year 2000 (Figure n.1). The observed values indicate that the overall abundance of the species considered is currently approximately one third lower than at the beginning of the time series.
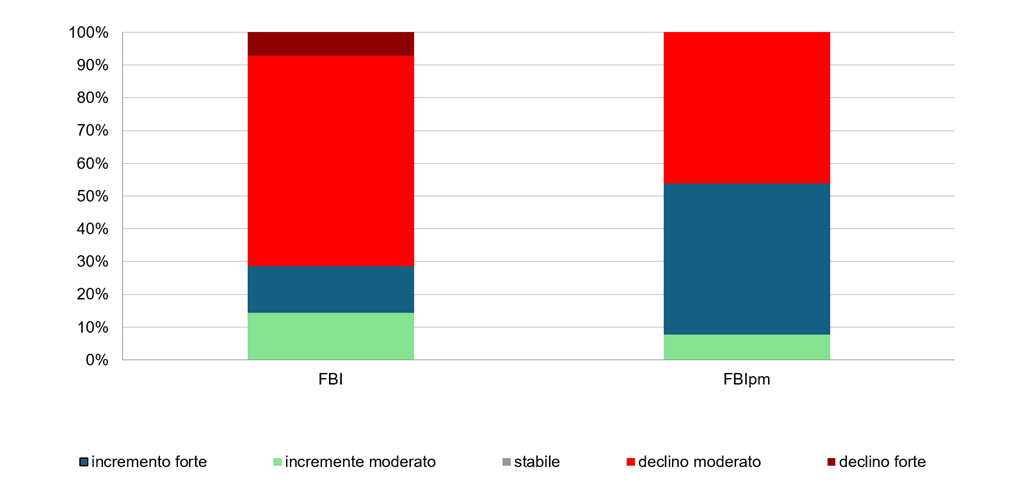
The picture is particularly critical for birds in agricultural environments, since over 70% of the 28 species that make up the indicator present populations in decline or, although stable today, still characterized by lower abundances than those historically observed (Figure n.2). The status of the indicator therefore highlights unfavorable conditions for the biodiversity associated with Italian agroecosystems.
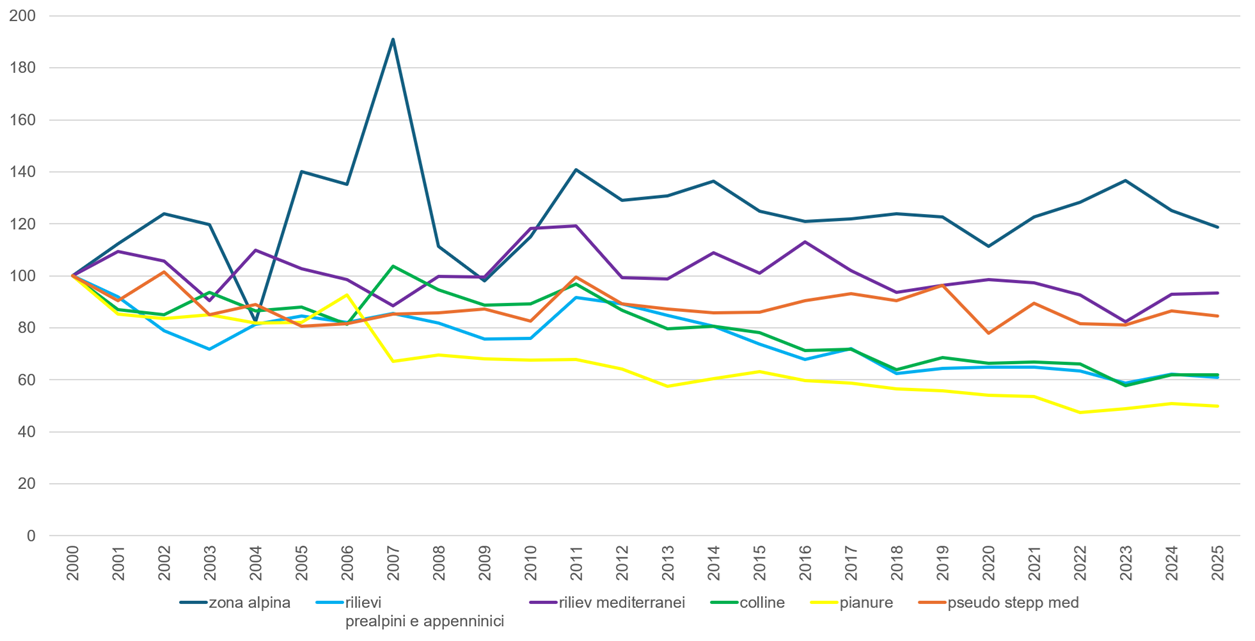
As regards the FBI indicators of the six ornithological zones (Alpine zone, pre-Alpine and Apennine reliefs, hill systems, alluvial plains, Mediterranean reliefs, Mediterranean steppes), the 2025 data highlight a decline in trends in all ornithological zones with the exception of the Alpine one whose trend is statistically classified as stable (Figure no. 3).
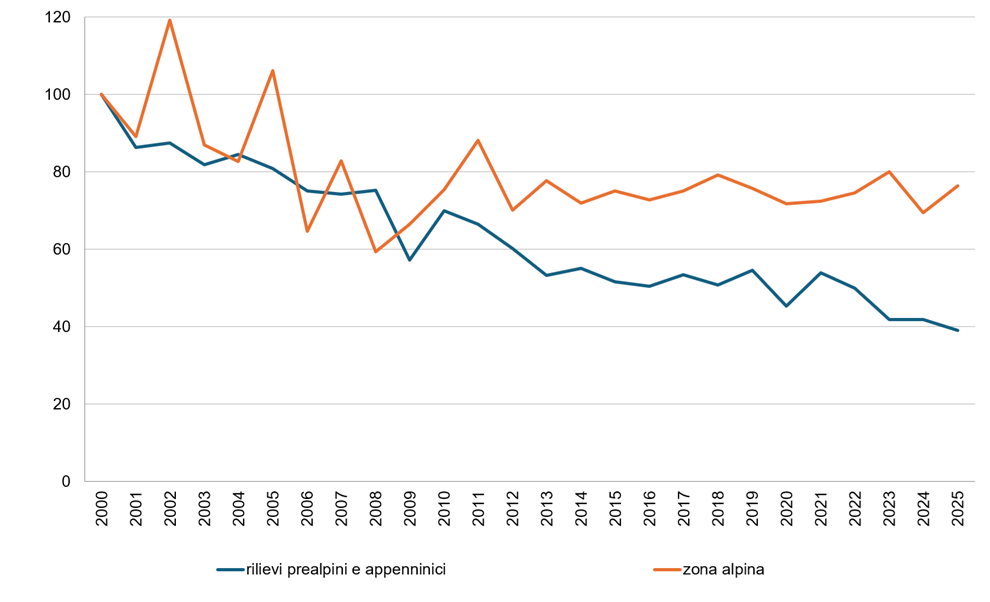
In a similar way, for the ornithological area of the Alps and in that of the pre-Alpine and Apennine reliefs, the trends of the species linked to mountain grasslands are analyzed (FBIpm). For 2025, both indices appear to have a statistically declining trend (Figure n.4).
The analysis of the 2000-2025 time series highlights a progressive and persistent decrease in the indicators. In the period considered, the FBI recorded an overall reduction of 33.49%, while the FBIpm decreased by 29.90% (Figure n.1).
The long-term trend is classified according to a standard method defined on a European scale by the EBCC ( European Bird Census Council ). The attribution to one of the identified trend categories (strong increase, moderate increase, stable, moderate decline and strong decline) takes into account both the average annual change and its confidence interval. For further information, please refer to the National Network of the CAP & LIPU (2025).
The negative trend affects a large part of the national territory. The FBI indicators developed for the six ornithological zones show a decline in all the areas considered, with the exception of the Alpine zone, for which the trend is defined as stable (Figure n.3). The most marked decreases are observed in the floodplains, where the decline exceeds 50% compared to initial values, confirming the urgent need for environmental restoration interventions. The absence of signs of recovery in the long term confirms a negative trend in the biodiversity of Italian agricultural environments. The negative trend in the Mediterranean areas is also particularly alarming, where in addition to changes in agricultural practices, the impacts of climate change and the transformation of land use also have a marked impact.
The concern for the areas of the pre-Alpine and Apennine reliefs is also confirmed by the analysis of the FBIpm indicator which for this ornithological area has now lost around 60% of its value in 2000 (Figure n.4).
| Data |
|---|
Thumbnail
Headline
Figure 1: Trends in the Farmland Bird Index (FBI) and the national Mountain Grassland Species Index (FBIpm) for the period 2000–2025 Data source
Lipu/RetePac/Mito2000 |
Thumbnail
Headline
Figure 2: Breakdown of trends for agricultural species (FBI) and mountain grassland species (FBIpm) based on current trends for the period 2000–2025 Data source
LIPU/RetePAC/MITO2000 |
Thumbnail
Headline
Figure 3: Trends in the Farmland Bird Index for the period 2000–2025 across the six ornithological regions Data source
Lipu/RetePAC/MITO2000 |
Thumbnail
Headline
Figure 4: Trends in the Mountain Grassland Species Index (FBIpm) for the period 2000–2025 in the Alpine region and in the Pre-Alpine and Apennine regions Data source
Lipu/RetePAC/MITO2000 |
Birds represent one of the faunal groups most sensitive to the transformations of agricultural environments, as well as one of the most studied taxa and therefore constitute an effective indicator of the conservation status of agroecosystems. The changes in their populations reflect the combined effects of multiple environmental pressures, including the intensification of agricultural practices, the simplification of the landscape mosaic, the reduction of marginal and semi-natural elements (hedgerows, isolated trees, permanent meadows, grassy and uncultivated margins), the abandonment of traditional practices in marginal areas and the effects of climate change.
The decline observed in the Farmland Bird Index indicates that these pressures continue to determine a progressive loss of ecological quality of Italian agricultural environments. The situation of lowland agricultural areas is particularly relevant, where the strong simplification of habitats and the high intensity of production practices have probably contributed to the marked decreases observed in the populations of many species.
The negative trend of the indicator is consistent with what has been found in numerous European countries and confirms how the conservation of the biodiversity of agroecosystems represents one of the main challenges for achieving the objectives set by the Common Agricultural Policy and the European Strategy for Biodiversity for 2030.