Antonio Caputo, Daniela Romano
The indicator consists of the ratio between atmospheric emissions of greenhouse gases and final energy consumption by sector. The average value of emission intensities shows a difference between the sectors in relation to the different diffusion of renewable sources. Overall, emission intensity for final uses decreased by 29.8% from 1990 to 2024. The data shows that policies for the decarbonisation of energy consumption have produced appreciable results in the sectors of electricity production and in the manufacturing industry. On the contrary, the transport sector, decidedly less centralized than the sectors mentioned, represents the real "hard core" and the main challenge for the coming years.
The indicator consists of the ratio between atmospheric emissions of greenhouse gases and final energy consumption by sector.
Measuring greenhouse gas emissions per unit of energy consumed and responding to the need to reduce the carbon content of energy end uses.
Although the indicator monitors a dynamic for which historically there was no maximum threshold required by law, today it fits into the binding framework outlined by the European Green Deal and the European Climate Law (EU Regulation 2021/1119), which requires the achievement of climate neutrality by 2050 and an intermediate objective of reducing net greenhouse gas emissions by at least 55% by 2030 (compared to 1990 levels).
Specifically, the trend of the indicator responds directly to the energy efficiency trajectories traced by the Energy Efficiency Recast Directive (EU) 2023/1791 (part of the regulatory package "Fit for 55"), which introduced a collective obligation for Member States to reduce final energy consumption at EU level by 11.7% by 2030 compared to the 2020 baseline projections.
At a national level, these stages are applied and monitored within the National Integrated Plan for Energy and Climate (PNIEC), which defines the Italian energy efficiency and transition targets for the coming decades.
The relevance of the indicator is reduced when moving from the national to the local level, due to the non-uniform distribution of energy production and consumption across the national territory.
ENEA (Authority for New Technologies, Energy and the Environment)
EUROSTAT (Statistical Office of the European Communities)
MASE (Ministry of the Environment and Energy Safety)
Terna - Rete Elettrica Nazionale S. p. A.
ISPRA, Inventory of atmospheric emissions, https://emissioni. sina. isprambiente. it/economia-nazionale/
MASE, National Energy Balance, various years, https://dgsaie. mise. gov. it/bilancio-energetico-nazionale
National
1990-2024
The emission intensity indicator is developed by ISPRA on a national basis through the direct relationship between emissions and consumption of the respective sectors. The solidity of the calculation rests on the perfect logical coherence between two main sources: the ISPRA estimates relating to emissions from energy processes and the data on sectoral consumption collected by the Ministry of the Environment and Energy Security. At an operational level, the distribution of data follows well-defined attribution criteria. The emissions generated by the energy industries are assigned to the transformation sector, while those from the residential and tertiary sectors also include emissions from agriculture and fishing. Finally, in calculating the overall total useful for calculating the indicator, consumption linked to transformation is integrated, while bunkering and non-energy uses are strictly excluded.
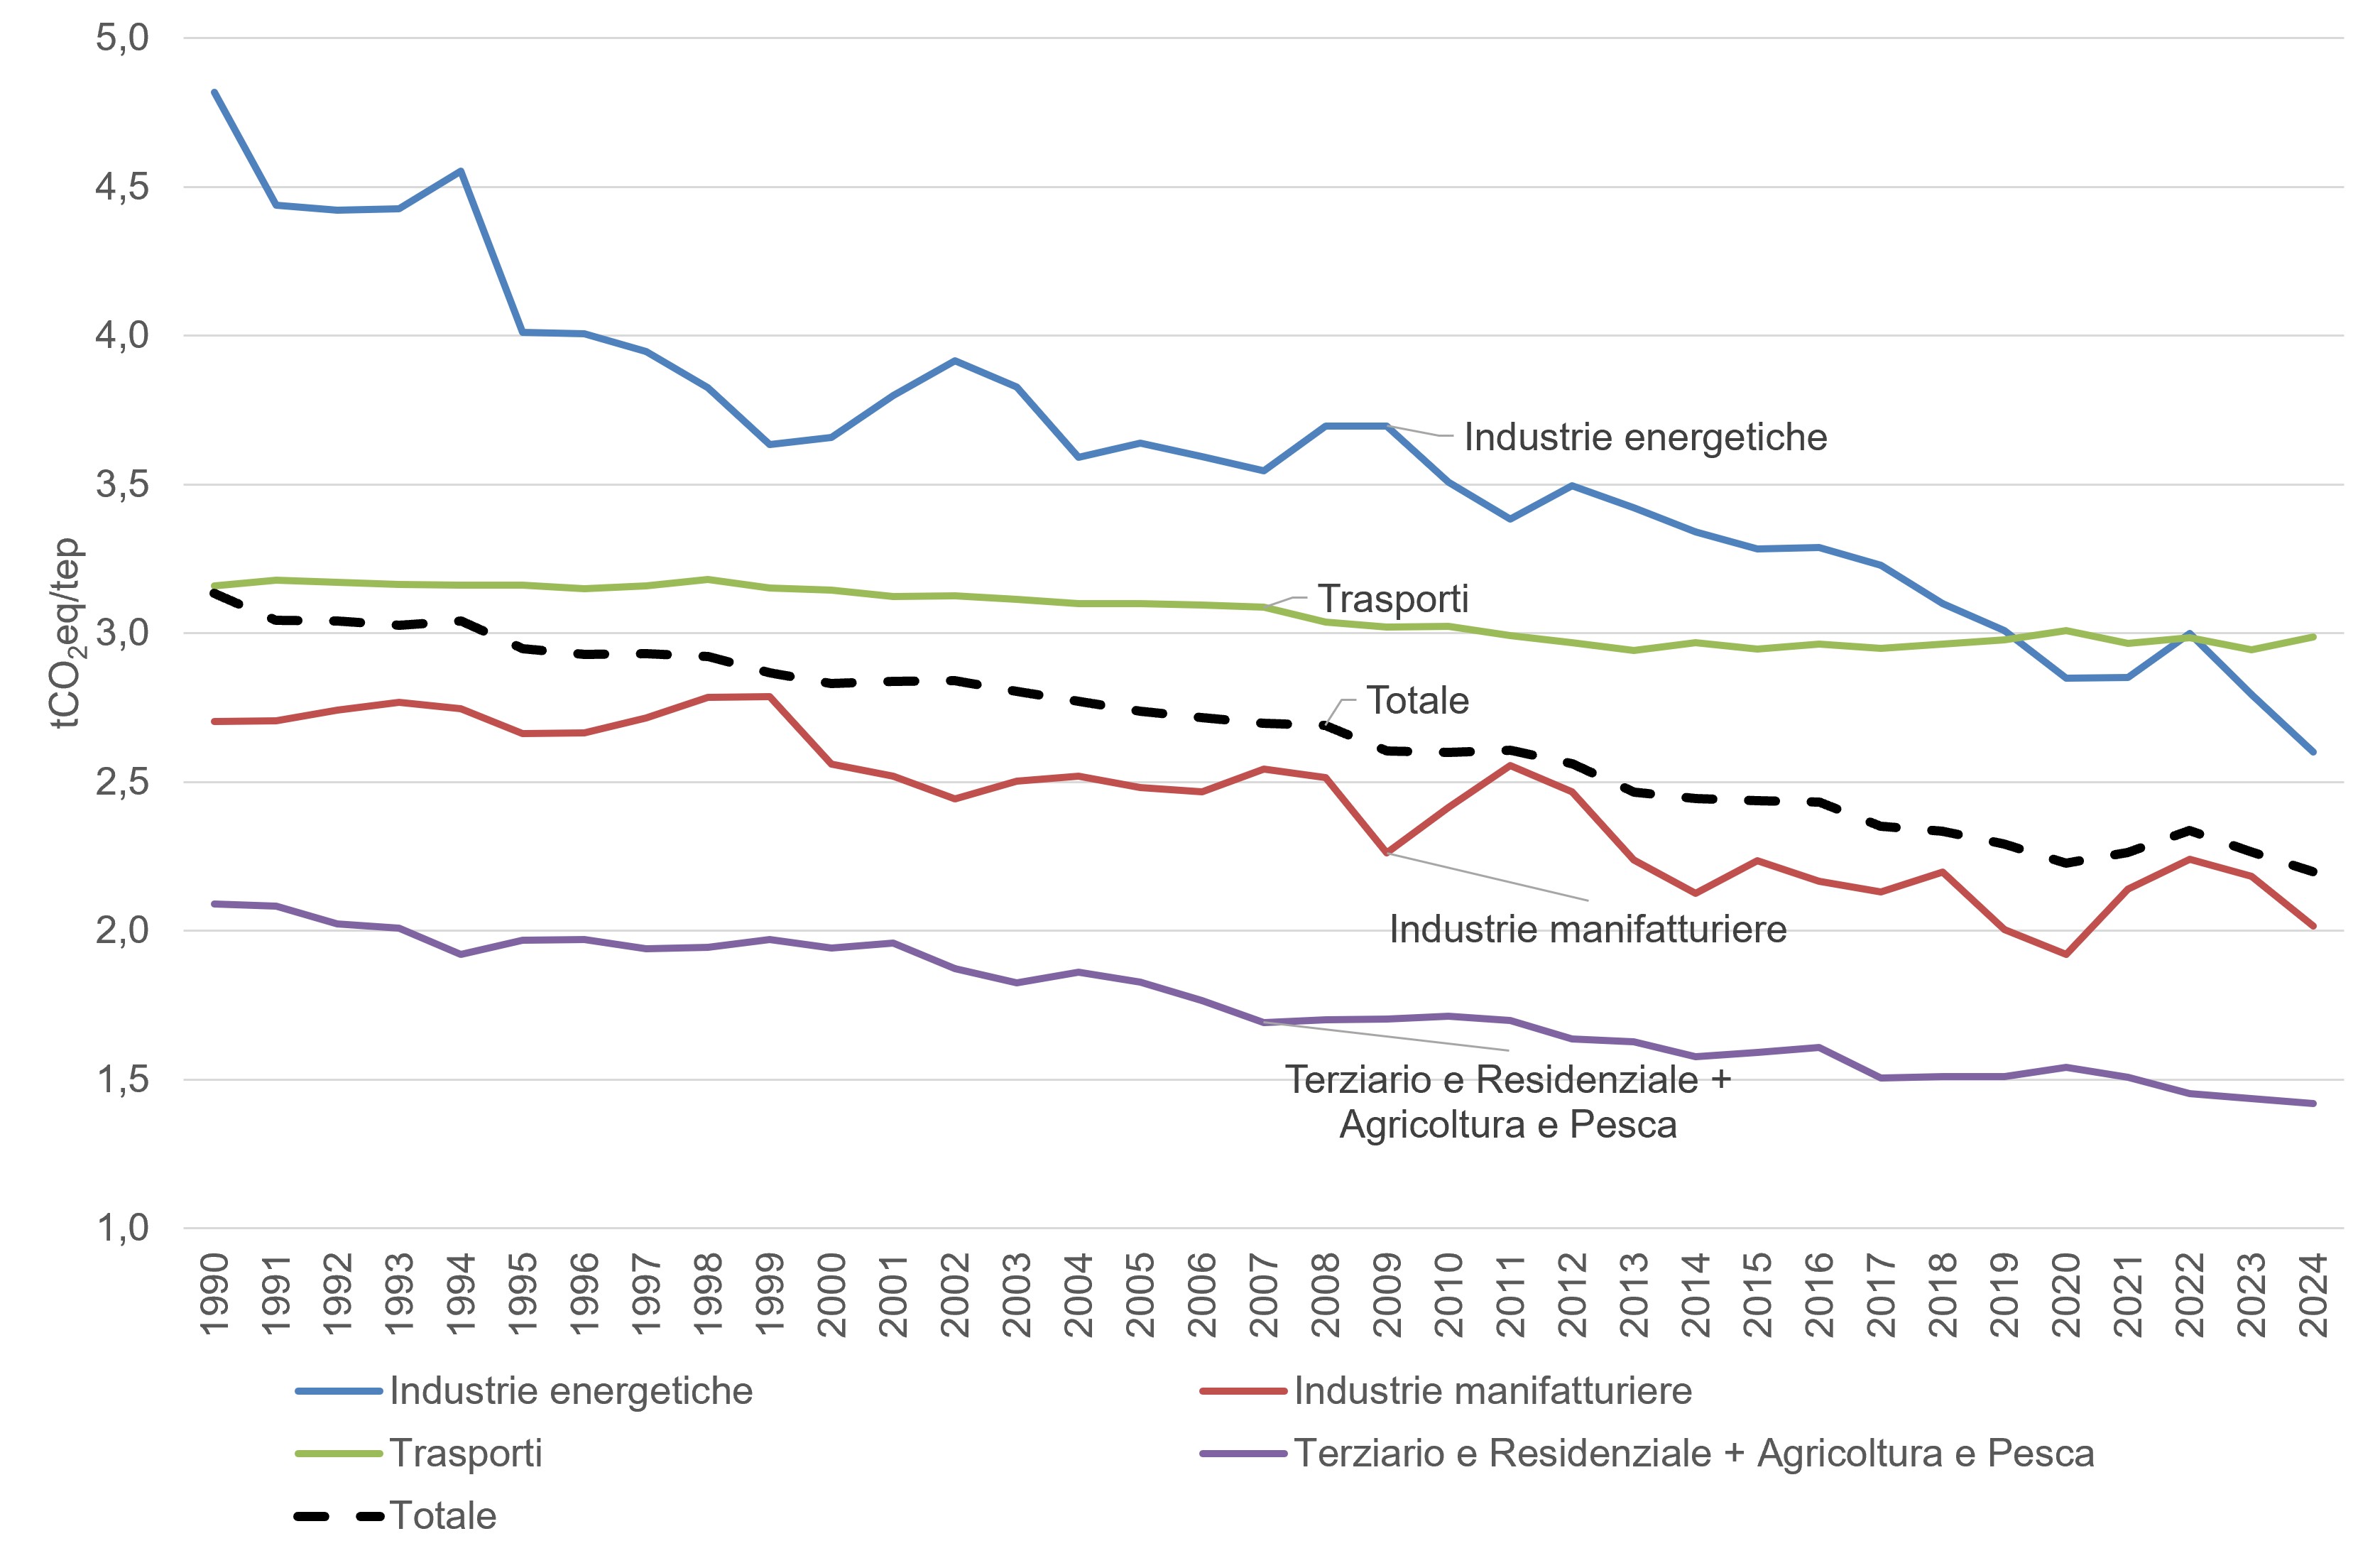
In 2024, the emission intensity is 2.20 tCO 2 eq/toe (Table 1). In detail: energy industries show an emission intensity of 2.6 tCO 2 eq/toe; the manufacturing industry a value of 2 tCO 2 eq/toe. In transport, a value of 3 tCO is recorded 2 eq/toe, while in the civil sector (residential, tertiary, agriculture and fishing) the value is 1.42 tCO 2 eq/toe.
The total national index experiences a constant and linear contraction, going from 3.13 (1990) to 2.20 (2024), marking an overall improvement in the emission efficiency of the Italian system of approximately 30%. The most macroscopic and impactful data concerns the energy industry sector (electricity production and refining). In 1990 this sector recorded the highest index ever, equal to 4.82 tCO 2 eq/toe. The progressive abandonment of coal and liquid fossil fuels in favor of natural gas and, since 2007, the spread of renewable sources, this value has collapsed to 2.60 tCO 2 eq/toe in 2024. This is a cut in emission intensity of 46%, the clearest result among all the sectors analysed, which demonstrates the profound decarbonisation of Italian electricity generation. In contrast to the energy sector we find Transport. In 1990 the index was at 3.16 tCO 2 eq/toe and in 2024 it will stand at 2.99 tCO 2 eq/toe, remaining almost unchanged for 35 years (with minimum fluctuations always around 3.00 tCO 2 eq/toe). Manufacturing and Tertiary/Residential/Agricultural industries show a reduction in emission intensity. Manufacturing drops from 2.70 tCO 2 eq/toe at 2.02 tCO 2 eq/toe (thanks to efficiency and electrification processes), while the residential/agricultural block drops from 2.09 tCO 2 eq/toe at 1.42 tCO 2 eq/toe, benefiting from the electrification of domestic consumption (e. g. Heat pumps).
| Allegati |
|---|
Headline
Tabella 1: Intensità emissiva di gas serra da consumi energetici Data source
Elaborazione ISPRA su dati MASE, ISPRA e EUROSTAT |
Thumbnail
Headline
Figura 1: Intensità emissive di gas serra da consumi energetici Data source
Elaborazione ISPRA su dati MASE, ISPRA e EUROSTAT |
In 2024, transportation has become the most emissions-intensive sector in the entire economy. This phenomenon illustrates a structural resistance to change: although engines have individually become more efficient and less polluting, the increase in demand for mobility, the persistent movement of goods by road and the slowness in the overall turnover of the national fleet have neutralized much of the technological progress. The average value of emission intensities by sector shows a marked difference between sectors in relation to the different diffusion of renewable sources. All sectors present a reduction in emission intensities with transport being the sector with the least reduction in intensity. The electricity sector, being made up of large, highly regulated industrial players subject to the emission permits market (European ETS system), has been able to rapidly convert thermoelectric power plants and refineries, while in the transport sector purchasing decisions depend on individual citizens and small businesses (private cars, vans, truck drivers) and technological change is linked to individual economic capabilities.