Roberto Sannino, Federico Silvestri
The indicator takes into account the fertilizers distributed in agriculture, i.e. the technical inputs used essentially for the growth of agricultural crops. It analyses their territorial and temporal distribution, for an overall representation of the environmental impact based on the quantities and types of fertilizers placed on the market.
In 2024, over 4 million tons of fertilizers were placed on the market.
44.7% is made up of mineral fertilizers (simple, compound, based on meso and microelements), which have always been the best-selling type, with the only exception in 2022 and despite a negative propensity in their long-term distribution (2000 - 2024).
Organic fertilizers (soil improvers and organic fertilizers) follow, with a sales figure of 35.3% and a reversal in the propensity in long-term distribution, positive until the previous year (2000 - 2023).
The most popular category The largest share of fertilizers sold is that of simple minerals, with over 1.2 million tons (29.7% of total fertilizers). Their sales volume has fluctuated for several years, but their slight increase (compared to 2023) is more significant than the simultaneous decline in soil improvers, leading to a reversal of the prevalence of soil improvers in the last two years (a drop of over 250,000 tons, for a sales volume in 2024 of approximately 1 million tons).
The indicator allows us to evaluate the quantities of fertilizers released annually for agricultural consumption and to compare distribution trends over time and across the country. The relevant data are provided by Istat and come from the annual census survey conducted among companies that distribute fertilizers under their own brand or under foreign brands.
The Istat survey considers the different types of fertilizers, such as a) mineral, organic, and organo-mineral fertilizers, i.e., products whose primary function is to provide nutrients to plants; b) soil improvers and correctives, i.e., substances primarily designed to modify and improve the structure and chemical, physical, and biological characteristics of the soil; c) growing materials of a different nature than agricultural soil (growing substrates); and d) other products that affect the absorption of nutrients or physiological anomalies (products with specific action). It does not include fertilizers distributed for non-agricultural use.
The indicator analyzes data in relation to the different fertilizer categories. It represents the nutrient content made available to plants, taking into account the primary nutrients (nitrogen, phosphorus, and potassium), the secondary nutrients as a whole (calcium, magnesium, and sulfur), the total micronutrients (boron, copper, iron, etc.), and the organic matter content.
Represent the quantity of fertilizers distributed for agricultural use and evaluate their distribution dynamics, on a national and regional basis. The indicator provides reliable data for a comprehensive representation of the environmental pressure associated with fertilizer distribution.
Legislative Decree No. 75 of 29 April 2010, as amended, regulates the production and marketing (within the national territory) of mineral and organic fertilizers. It is necessary to revise it to bring its content into line with the provisions of Regulation No. 2019/1009 of 5 June 2019 of the European Parliament and of the Council on the placing on the Community market of CE-marked fertilizer products, which repealed the previous Regulation (EC) No. 2003/2003 on 16 July 2022. With a view to developing a circular economy and protecting human, animal, and plant health, safety, and the environment, the new European Fertilizer Regulation supports the need to use recycled or organic materials in fertilization. For the recovery of organic matter, Directive 86/278/EEC on the agricultural use of sewage sludge is also worth mentioning. Council Directive 91/676/EEC (the Nitrates Directive), dated 12 December 1991, lays down provisions for the protection of waters from pollution caused by nitrates from agricultural sources and introduces specific measures for the land application of nitrogen fertilizers, with per-hectare limits on the distribution of livestock effluents and the concentration of nitrates in water. Specifically, it limits the application of livestock effluents to a quantity of 170 kg of N/ha/year, while the maximum nitrate concentration allowed in waters is 50 mg/l. Directly issued are the Ministerial Decree of 19 April 1999 "Code of Good Agricultural Practice", which provides guidelines for the correct use of nitrogen fertilizers, and the updated text of the Ministerial Decree of 25 February 2016 with the technical standards on the agronomic use of livestock effluents, wastewater and digestate.
With reference to the problem of pollution from nitrates of agricultural origin, Legislative Decree 152/99 "Provisions on the protection of water from pollution", updated with Legislative Decree 3 April 2006, no. 152 containing "Environmental standards", provides for the identification of areas vulnerable to nitrates (ZVN), in order to safeguard surface and groundwater from contamination. Also worth mentioning are the Water Framework Directive 2000/60/EC and Directive 2006/118/EC, which do not introduce limits on use but have the objectives of protecting inland, coastal, and groundwater from pollution and addressing the impacts of the agricultural sector on water resources.
Istat, Means of Production in Agriculture, https://www.istat.it/informazioni-sulla-rilevazione/distribuzione-per-u…
The data refers to the quantity marketed and not the quantity actually used by agricultural operators.
Have data on the quantities distributed, possibly recorded at agricultural and livestock farms representative of the different territorial contexts.
Istat (National Institute of Statistics)
Istat, Distribution of fertilizers for agricultural use (fertilizers, soil improvers and correctives) https://esploradati.istat.it/databrowser/#/it/dw/categories/IT1,Z1000AGR,1.0/AGR_MEANS/DCSP_FERTILIZZANTI
National, Regional
1971, 1981, 1985, 1990-2024
Nutrients contained in fertilizers (t)
Fertilizers distributed by category (t)
The indicator is based on statistical data made available by Istat, following the census survey called "Survey on the distribution of fertilizers for agricultural use".
In 2024, over 4 million tons of fertilizers were placed on the market. 44.7% of these were mineral fertilizers (simple, compound, meso- and microelement-based), in which the declared nutrients are present in the form of mineral compounds obtained through extraction or industrial physical and/or chemical processes. Organic fertilizers constituted 35.3% of the total and are represented by organic fertilizers, derived from organic materials of animal or plant origin, and soil improvers. These are followed by soil amendments (11.3%), organo-mineral fertilizers (4.4%), i.e. fertilizers obtained from one or more mineral fertilizers, organic matrices and organic fertilizers, growing substrates (2.5%) and products with a specific action (1.9%) (Table 1).
Among mineral fertilizers, simple minerals prevail, over 1.2 million tons (66.6%), while compounds are 532 thousand tons (29.3%), of which 47% are binary (nitrogen/potassium, nitrogen/phosphorus and phosphorus/potassium) and the remaining ternary (nitrogen/phosphorus/potassium). The remaining 4.1% (74 thousand tons) is represented by the combination of meso-based fertilizers (calcium, magnesium, sulfur) and microelements (boron, copper, iron, etc.). Nitrogen-based fertilizers continue to be the most widespread type of mineral fertilizer, representing over four-fifths of simple minerals (87%) and almost all composite minerals (97.7%). In total, nitrogen-based mineral fertilizers (simple and compound) amount to 1.6 million tons, equal to 86.6% of all mineral fertilizers. (https://esploradati.istat.it/databrowser/#/it/dw/categories).
Among organic fertilizers, soil improvers, amounting to over 1 million tons (71.6%), are the most widely sold type, and mixed soil improvers predominate, accounting for 63.5%, and plant improvers (15%). The sales volume of soil improvers is lower than that of straight mineral fertilizers and straight nitrogen-based minerals (180,000 tonnes and 24,000 tonnes, respectively).
26.1% of fertilizers, equal to over 1 million tonnes, are products authorised for use in organic production (https://esploradati.istat.it/databrowser/#/it/dw/categories). Of these, over half (51.4%) are distributed to maintain and improve the chemical, physical, and biological characteristics of the soil.
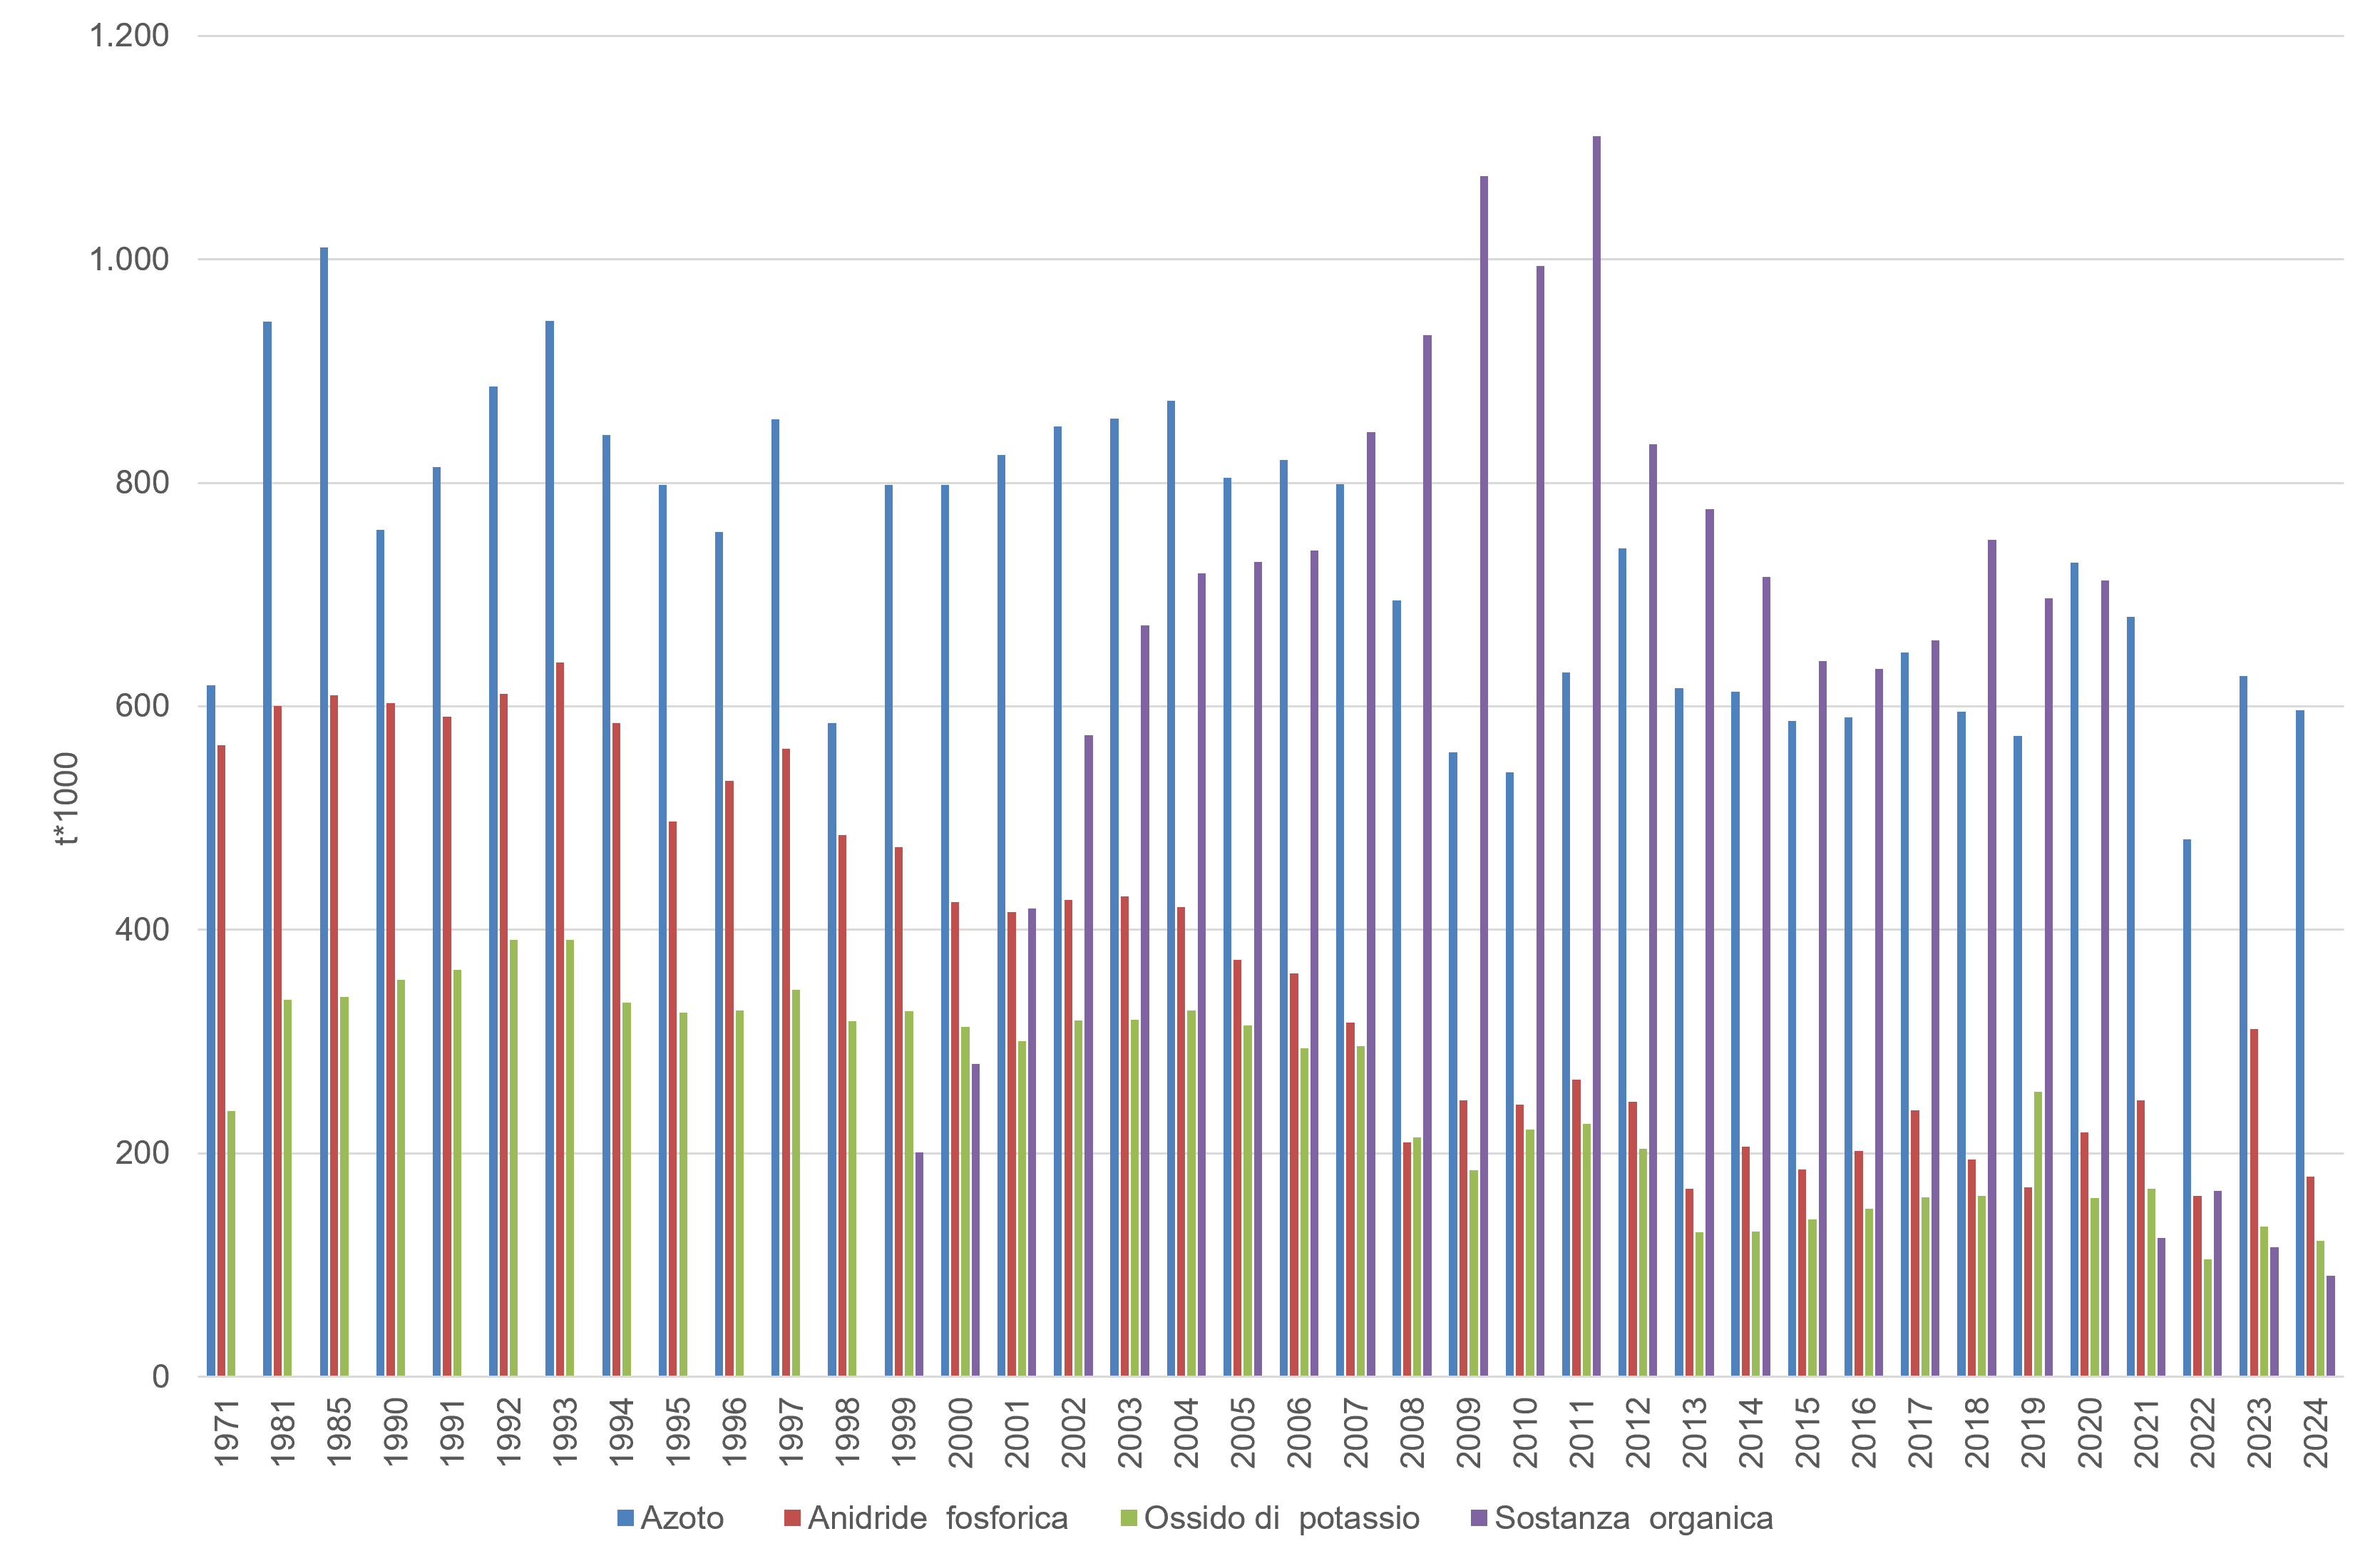
The content of each nutrient (primary, secondary, or mesoelements, microelements, and organic matter) is associated with the characteristics of the fertilizer placed on the market. In 2024, 596,000 tons of nitrogen, 179,000 tons of phosphorus, 121,000 tons of potassium oxide, 327,000 tons of mesoelements (calcium, magnesium, and sulfur), and 90,000 tons of organic matter were distributed (Table 3). Just over half of the nitrogen (54.2%) and potassium oxide (55.3%), approximately half of the phosphorus pentoxide (48.9%), and almost two-fifths of the organic matter (39.1%) were distributed in the four regions of the Po Valley (Piedmont, Lombardy, Veneto, and Emilia-Romagna) (Table 2). This concentration is determined by the type of agriculture, in particular by the company's production choices and the cultivation techniques adopted, consequently it must be associated with the nutritional needs of the agricultural crops grown and the characteristics of the soil, as well as being correlated with environmental factors, primarily the environmental variables.
During the period 2000-2024, fertilizer distribution decreased by 564,000 tons, equal to 12.2%. The significant element is the different trends in the various categories. The trend is negative in organo-mineral fertilizers, - 243,000 tons (-57.9%), and especially in mineral fertilizers, characterized by a contraction of over 1.6 million tons (-47.3%), significant for both simple minerals and compounds (-39.8% and - 62.6%, respectively). This contrasts with the notable increase in correctives, whose use has become significant in the last fifteen years, and the growth in organic fertilizers, approximately double (92.7%) and especially evident in soil improvers, whose sales volume is more than double (110.7%). The long-term trend of soil improvers is positive, given their role in maintaining organic matter in agricultural soils and in general in preserving soil biodiversity (Table 1).
The last five years (2020-2024), however, are characterized by marked annual variability in the quantities of fertilizers distributed (Table 1). Considering the average sales volume over the last five years (over 4.3 million tons), 2024 is below average, highlighting a contraction in overall fertilizer distribution. Analysis of the different types shows that the reduction only affects mineral fertilizers to a limited extent (-0.8%), due to the decline in compound mineral fertilizers (-9.4%), only partially offset by the increase in straight fertilizers (+0.8%). The decline in organic fertilizers (-9.5%) is more marked, mainly attributable to the reduction in soil improvers (-15.2%).
With respect to maintaining soil fertility, an important phenomenon is the direct application to the soil or after a transformation treatment (for example, anaerobic digestion) of organic materials from agricultural activities (livestock waste and plant residues). This phenomenon has the potential to impact the distribution dynamics of organic fertilizers, including the sales volume of soil improvers placed on the market. However, it is not analyzed here because it is not included in the ISTAT survey.
| Data |
|---|
Titolo
Tabella 1: Fertilizzanti distribuiti per categoria (1998-2024) Fonte
Istat, Rilevazione sulla distribuzione per uso agricolo dei fertilizzanti Legenda
a) Dato non rilevato; b) La rilevazione è iniziata nel 2006 |
Titolo
Tabella 2: Distribuzione regionale degli elementi nutritivi contenuti nei fertilizzanti (2024) Fonte
Istat, Rilevazione sulla distribuzione per uso agricolo dei fertilizzanti |
Titolo
Tabella 3: Elementi nutritivi contenuti nei fertilizzanti (1971, 1981, 1985, 1990-2024) Fonte
Istat, Rilevazione sulla distribuzione per uso agricolo dei fertilizzanti |
Thumbnail
Titolo
Figura 1: Elementi nutritivi contenuti nei fertilizzanti Fonte
Istat, Rilevazione sulla distribuzione per uso agricolo dei fertilizzanti |
In 2024, mineral fertilizers (simple, compound, meso- and microelement-based) will continue to be the best-selling type (Table 1), confirming a trend observed over the years, with the sole exception of 2022, when organic fertilizers (soil improvers and organic fertilizers) recorded a higher sales volume. The prevalence of mineral fertilizers in 2024 is associated with the evolution of sales compared to the previous year, as the decrease in mineral fertilizers (2%) is smaller than the simultaneous decline in organic fertilizers (20.8%).
Among mineral fertilizers, nitrogen-based fertilizers prevail, as nitrogen is the main nutrient capable of stimulating the growth of plants (and algae), and is consequently also responsible for the deterioration of soil and water. The most widespread form is amide nitrogen (54% of nitrogen-based nutrients), which is released slowly into the soil and is mainly found in urea-based mineral fertilizers. This is followed by ammoniacal nitrogen (21.8%), which cannot be directly assimilated by the plant root system, slow-release organic nitrogen (15.1%), and nitric nitrogen (9%), which is the form of nitrogen immediately assimilated by the roots, highly mobile in the soil and soluble in water and which constitutes the main element of nitrate-based mineral fertilizers.
The growth trend of organic fertilizers in the long term (+92.7% compared to 2000) appears to contrast with the decline in their sales over the last five years (-9.5% compared to 2020) and in the last year (-20.8%), highlighting a reversal of the trend compared to the greater propensity to use that had characterized the use of organic fertilizers in agriculture until 2023. The negative trend is associated with the decrease in their sales volume in the last year and represents a process that needs to be understood with the help of data from upcoming years. Here, however, it should be assessed negatively, given the greater capacity of organic fertilizers to contribute to the increase of soil organic matter and their lower impact on the potential pollution of groundwater and the emission of greenhouse gases into the atmosphere.
Among organic fertilizers, soil improvers prevail, including mixed soil improvers, with over 615,000 tons, and vegetable soil improvers and green compost, with over 150,000 tons (https://esploradati.istat.it/databrowser/#/it/dw/categories). The higher sales volume of mixed soil improvers is due to their composition, which includes both plant residues and waste (e.g., bark, crop residues, and ornamental greenery maintenance waste), which characterize the plant soil improver and green compost, and processed and stabilized organic waste from the organic fraction of municipal solid waste from separate collection, anaerobic digestate, animal waste and waste from agro-industrial activities, and the processing of wood and untreated textiles. These fertilizers, therefore, enhance the recovery of organic substances, in accordance with the principles of the circular economy.
As in previous years, it should be emphasized that the propensity to use organic fertilizers is related to the increased awareness among farmers of the need to restore and preserve the fertility of agricultural soils and the consequent decision to adopt company techniques geared towards sustainable management of natural capital. The reasons are varied and mainly include:
a) the greater environmental awareness of agricultural operators, supported by the growing attention of consumers towards the environment;
b) the consolidation of agricultural policy to support forms of agriculture that are more respectful of environmental balances, such as organic farming and conservative agriculture;
c) the decisions of EU policy and national legislators to enhance the environmental sustainability of organic matter recovery, as an alternative to landfill disposal of organic waste.
The observation of the dissimilar trend between the long and medium term in the distribution of organic fertilizers cannot be explained by the analysis of the distribution of the active part of fertilizers, i.e. the nutrients that act directly on soil and plant fertility. In fact, the absolute data of the last four years appears profoundly different from the values of previous years, a circumstance that impedes interpretation and evaluation (Table 3 and Figure 1). The last three years, in any case, have been characterized by a negative trend in the availability of organic matter. It is equally difficult to formulate technical considerations on the evolution of the other main nutrients, as the trend in use is influenced by the commercial characteristics of the fertilizer products placed on the market. In general, considering the average values of the long term (2000-2024) and the last five years (2020-2024), a predominantly decreasing trend emerges for the three elements in the long term, irregular in the medium term, and negative in the last year.