Costanza Mariotta; Jessica Tuscano
In 2024, the overall production of Waste from Economic Activities generated by the national production system (industrial, commercial, artisanal, and service activities, as well as waste treatment and environmental remediation) will show significant growth, reaching over 172 million tonnes (+4.6% compared to 2023, corresponding to almost 7.6 million tonnes).
Non-hazardous Waste from Economic Activities, which represents 93.7% of total waste produced, shows an increase of almost 7 million tonnes (+4.5%), while hazardous waste, on the other hand, increases by 612 thousand tonnes (+6.0%).
With regard to the construction sector, the incentives provided by the Government for the renovation of buildings aimed at energy requalification continued. These construction/renovation works, together with construction sites for infrastructure and public works and residential and commercial buildings, also supported by funding provided by the National Recovery and Resilience Plan (PNRR), have generated increased quantities of construction and demolition waste.
The indicator measures the total amount of Waste from Economic Activities generated in Italy. The information is provided disaggregated compared to the following types of waste: hazardous waste, non -hazardous waste and construction and demolition waste. The articulation for economic activity is also presented.
Measuring the total amount of Waste from Economic Activities produced and evaluating the impacts of economic activities, including those of waste treatment and environmental recovery, supporting decision -making processes and environmental policies in the adoption of the relative strategies.
Directive 2008/98/EC;
Legislative Decree 152/2006 and subsequent amendments;
Legislative Decree 205/2010;
Directorate Decree 7 October 2013 - Adoption and approval of the National Waste Prevention Programme (Official Journal 18 October 2013, no. 245). The National Waste Prevention Program (Directorate Decree 7 October 2013) sets the following prevention objectives for 2020, compared to the values recorded in 2010:
- 10% reduction in the production of hazardous special waste per unit of GDP
- 5% reduction in the production of non-hazardous special waste per unit of GDP. Based on new data relating to the production of special waste, this objective may be revised.
L 221 of 28/12/2015.
Decision 2000/532/EC.
Legislative Decree no. 4/2008.
Special waste is identified in Article 184, paragraph 3 of Legislative Decree 152/2006 and subsequent amendments. The aforementioned legislative decree reaffirms the inspiring principles of the European hierarchy, which provide for the following order of priority:
- prevention
- preparation for reuse
- recycling
- other types of recovery, for example energy recovery
- disposal.
ANPA - ONR, 1999, The ANPA waste accounting system – Initial data processing
ANPA - ONR, 2001, First report on Waste from Economic Activities
ANPA - ONR, Waste Report, 2001-2007
ISPRA, Waste Report 2008
ISPRA, Waste from Economic Activities Report, 2009-2026 Editions
ISPRA (Italian Institute for Environmental Protection and Research)
Use the information contained in the database of annual environmental declarations (MUD) submitted by entities required under current legislation, supplemented with the quantities estimated by ISPRA, which are not accessible to the public. Data on the production of special, hazardous, and non-hazardous waste at the regional level, by economic activity, and by chapter of the European waste list can be found on the Waste Registry website at: www.catasto-rifiuti.isprambiente.it
National
1997-2024
Total production of Waste from Economic Activities (tons)
The indicator measures the total quantity of Waste from Economic Activities generated in Italy. The information is provided disaggregated by different types of waste: hazardous special waste, non-hazardous Waste from Economic Activities, and Waste from Economic Activitiesfrom construction and demolition activities. A breakdown by economic activity is also presented. The production data for non-hazardous special waste for 2006 and, in part, for the years 2007 to 2024 have been integrated using specific estimation methodologies, as have those for the production of hazardous Waste from Economic Activitiesor the years 2015 to 2024.
The information base is constituted by the environmental declarations (MUD) submitted annually by the entities required pursuant to art. 189 of Legislative Decree 152/2006. The information from the MUD database has been integrated with estimated quantities through the application of specific methodologies for certain production sectors that, under current legislation, are fully or partially exempt from the reporting requirement. It should be noted that some sector studies have been updated to take into account that many materials previously classified as waste are now classified as by-products under current legislation. For this reason, estimates for the food and beverage industry in particular have been updated starting from 2011.
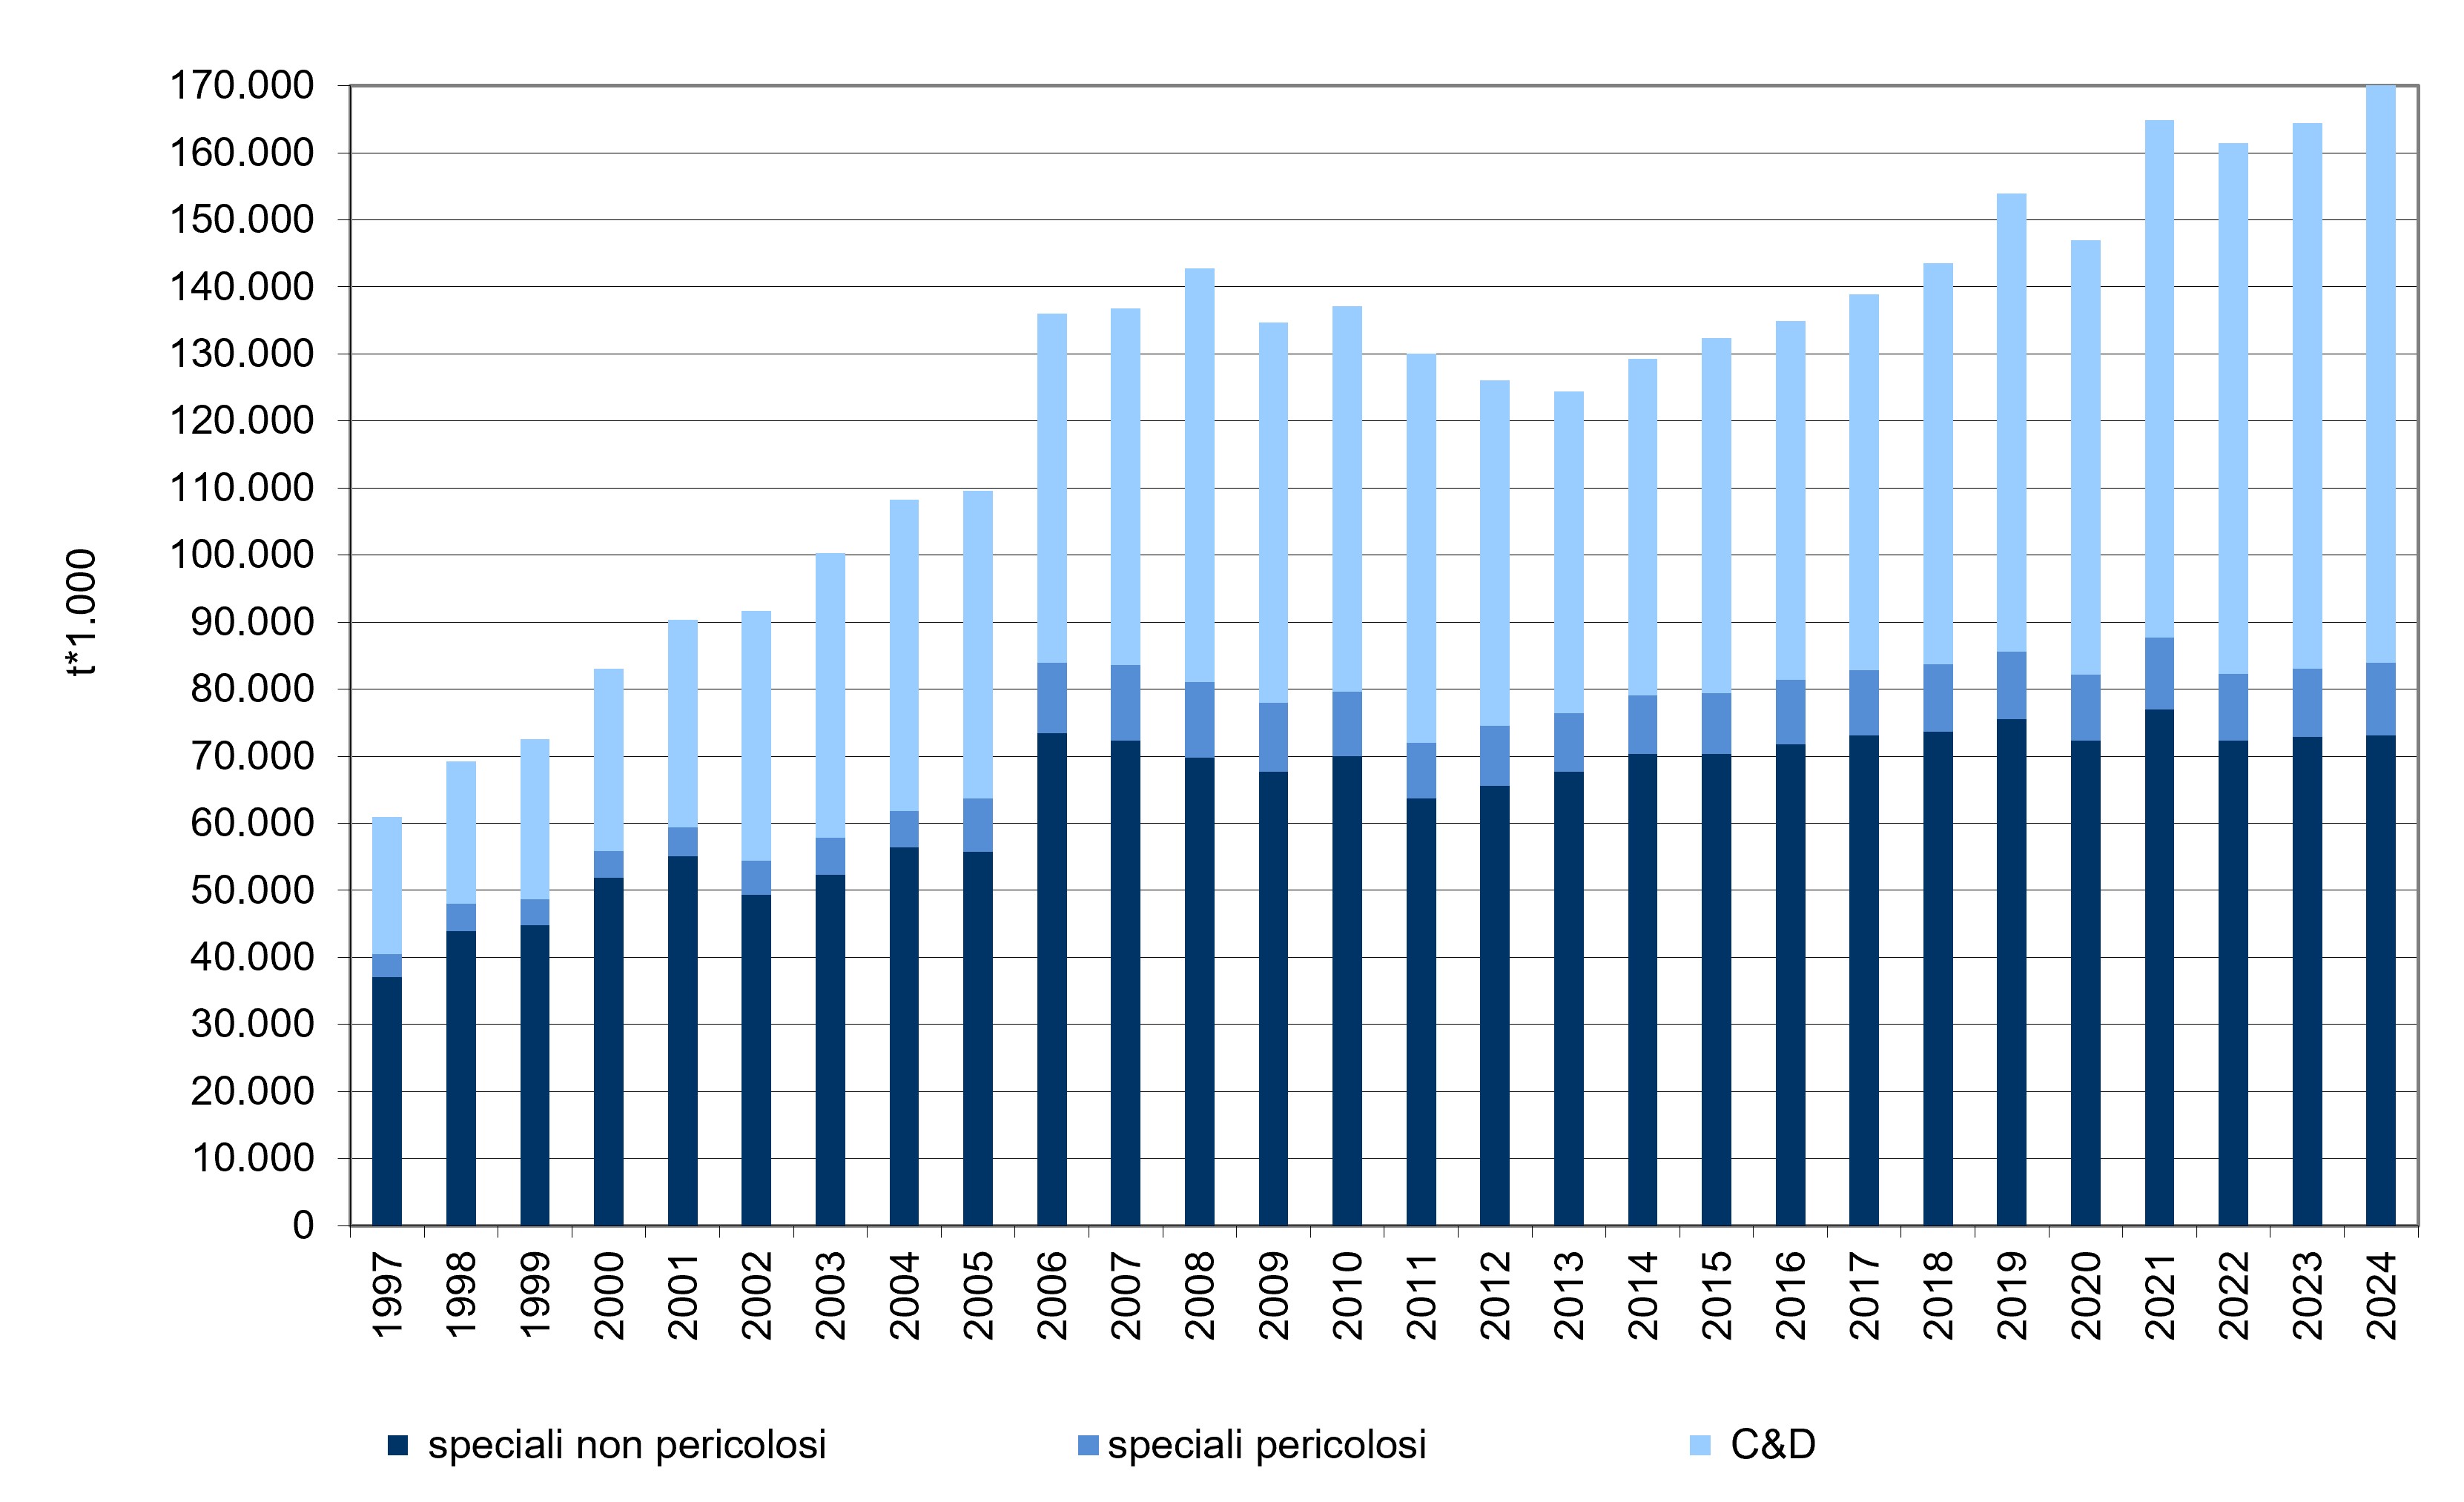
In 2024, national waste production from economic, industrial, and manufacturing activities will increase by 4.6% compared to 2023, corresponding to almost 7.6 million tons.
Italy has a historical data series on Waste from Economic Activities produced from 1997 to 2024, which highlights a strong growth trend. Specifically, there was a sharp increase in production between 1997 and 2006, followed by a more moderate growth until 2008. Between 2008 and 2009, due to the severe economic and financial crisis that hit our country, there was a contraction in the quantity of Waste from Economic Activities (-5.7%). In 2010, national production of special waste began to increase again (+1.8%). Between 2011 and 2017, special waste production experienced a fluctuating trend: between 2011 and 2013, it decreased by 4.3%, primarily due to the reduction in non-hazardous Waste from Economic Activities produced by construction and demolition activities, while between 2013 and 2014, it increased again (+4%), realigning with 2011 values. Growth continued in both the two-year periods 2014-2015 (+2.4%) and 2015-2016 (+2%). Specifically, Waste from Economic Activities production continued to grow in the last five-year period 2015-2019 (+16.3%), in line with the trend in socioeconomic indicators. Production in 2020 showed a 4.5% decrease compared to 2019, corresponding to almost 7 million tons, before increasing again in 2021 (+12.2%). 2022, marked by the delicate international geopolitical context, recorded a decrease (-2.1%), while in 2023 and 2024 production increased again (+1.9% and +4.6%, respectively) (Table 1 and Figure 1).
| Allegati |
|---|
Titolo
Table 1: : Production of total Waste from Economic Activities Fonte
ISPRA Legenda
a Partially estimated data; b Estimated data; c Including quantities of Waste from Economic Activities from the treatment of municipal waste;" Note
RS = Waste from Economic Activities; RSP = Hazardous Waste from Economic Activities ;RSNP = Non-hazardous Waste from Economic Activities " |
Titolo
Table 2: Generation of Waste by Economic Activities (NACE sector) Fonte
ISPRA Legenda
a Partially estimated data; b including quantities of Waste from Economic Activities from the treatment of municipal waste Note
RS = Waste from Economic Activities ;RSP = Hazardous Waste from Economic Activities; RSNP = Non-hazardous Waste from Economic Activities |
Thumbnail
Titolo
Figure 1: Trend in the total production of Waste from Economic Activities Fonte
ISPRA |
In 2024, the national production of Waste from Economic Activities generated by the national production system (industrial, commercial, artisanal, and service activities, as well as waste treatment and environmental remediation) showed a significant increase, exceeding 172 million tons. Non-hazardous waste, which represents 93.7% of total waste generated, increased by almost 7 million tons (+4.5%), while hazardous waste increased by 612,000 tons (+6.0%).
Regarding the construction sector, the government continued to provide incentives for the renovation of buildings aimed at improving their energy efficiency. These construction/renovation works, together with construction sites for the construction of infrastructure and public works and residential and commercial buildings, also supported by funding provided by the National Recovery and Resilience Plan (PNRR), have generated increased quantities of construction and demolition waste.
The analysis of data by economic activity (according to the ATECO 2007 classification) shows that the largest contribution to the overall production of Waste from Economic Activities is made by the construction and demolition sector (ATECO 41 to 43), which, with almost 90.4 million tonnes including waste from construction and demolition operations and other waste produced by these activities (e.g., packaging waste, used oils, etc.), covers 52.5% of the total. Waste treatment and environmental remediation activities (ATECO 38 and 39) contribute 23.1% (39.8 million tonnes), while manufacturing activities (ATECO 10 to 33, approximately 27.4 million tonnes) account for 15.9%. Other economic activities contribute, overall, to the production of Waste from Economic Activities with a percentage equal to 8.4% (14.5 million tonnes) (Table 2).