Marina Vitullo
The indicator represents, over the period 1990 - 2024, the trend in greenhouse gas emissions in Italy per inhabitant and compared to GDP. There is a decrease for both, accentuated by the growth of population and GDP, which therefore highlights a decoupling between determinants and pressures.
The indicator is developed by relating national greenhouse gas emissions to the population resident in Italy and the same emissions to GDP at national market prices.
Assessing the temporal trends in greenhouse gas emissions per capita and relative to GDP
United Nations Framework Convention on Climate Change (UNFCCC) 1992
Kyoto Protocol 1997
Law 65/1994
CIPE Resolution 123/2002
Law 120/2002
Law 316/2004 (conversion into law, with amendments, of Legislative Decree no. 273/2004, containing urgent provisions for the application of Directive 2003/87/EC on the trading of greenhouse gas emission quotas in the European Community)
Legislative Decree 51/2008
“Effort Sharing” Decision 406/2009/EC
Legislative Decree 30/2013
EU Regulation 525/2013
Legislative Decree 111/2015
Paris Agreement 2015
Law 79/2016
EU Regulation 842/2018
EU Regulation 1999/2018
EU Directive 2001/2018
ISPRA, various years. Italian Greenhouse Gas Inventory, National Inventory Report (https://www. isprambiente. gov. it/it/pubblicazioni/rapporti)
None
None
Used ISPRA data from the National Inventory of Atmospheric Emissions (https://emissioni. sina. isprambiente. it/interno-nazionale/) and Istat data on population and GDP (https://demo. istat. it and / https://esploradati. istat. it/databrowser/#/it/dw/categories).
National
1990 - 2024
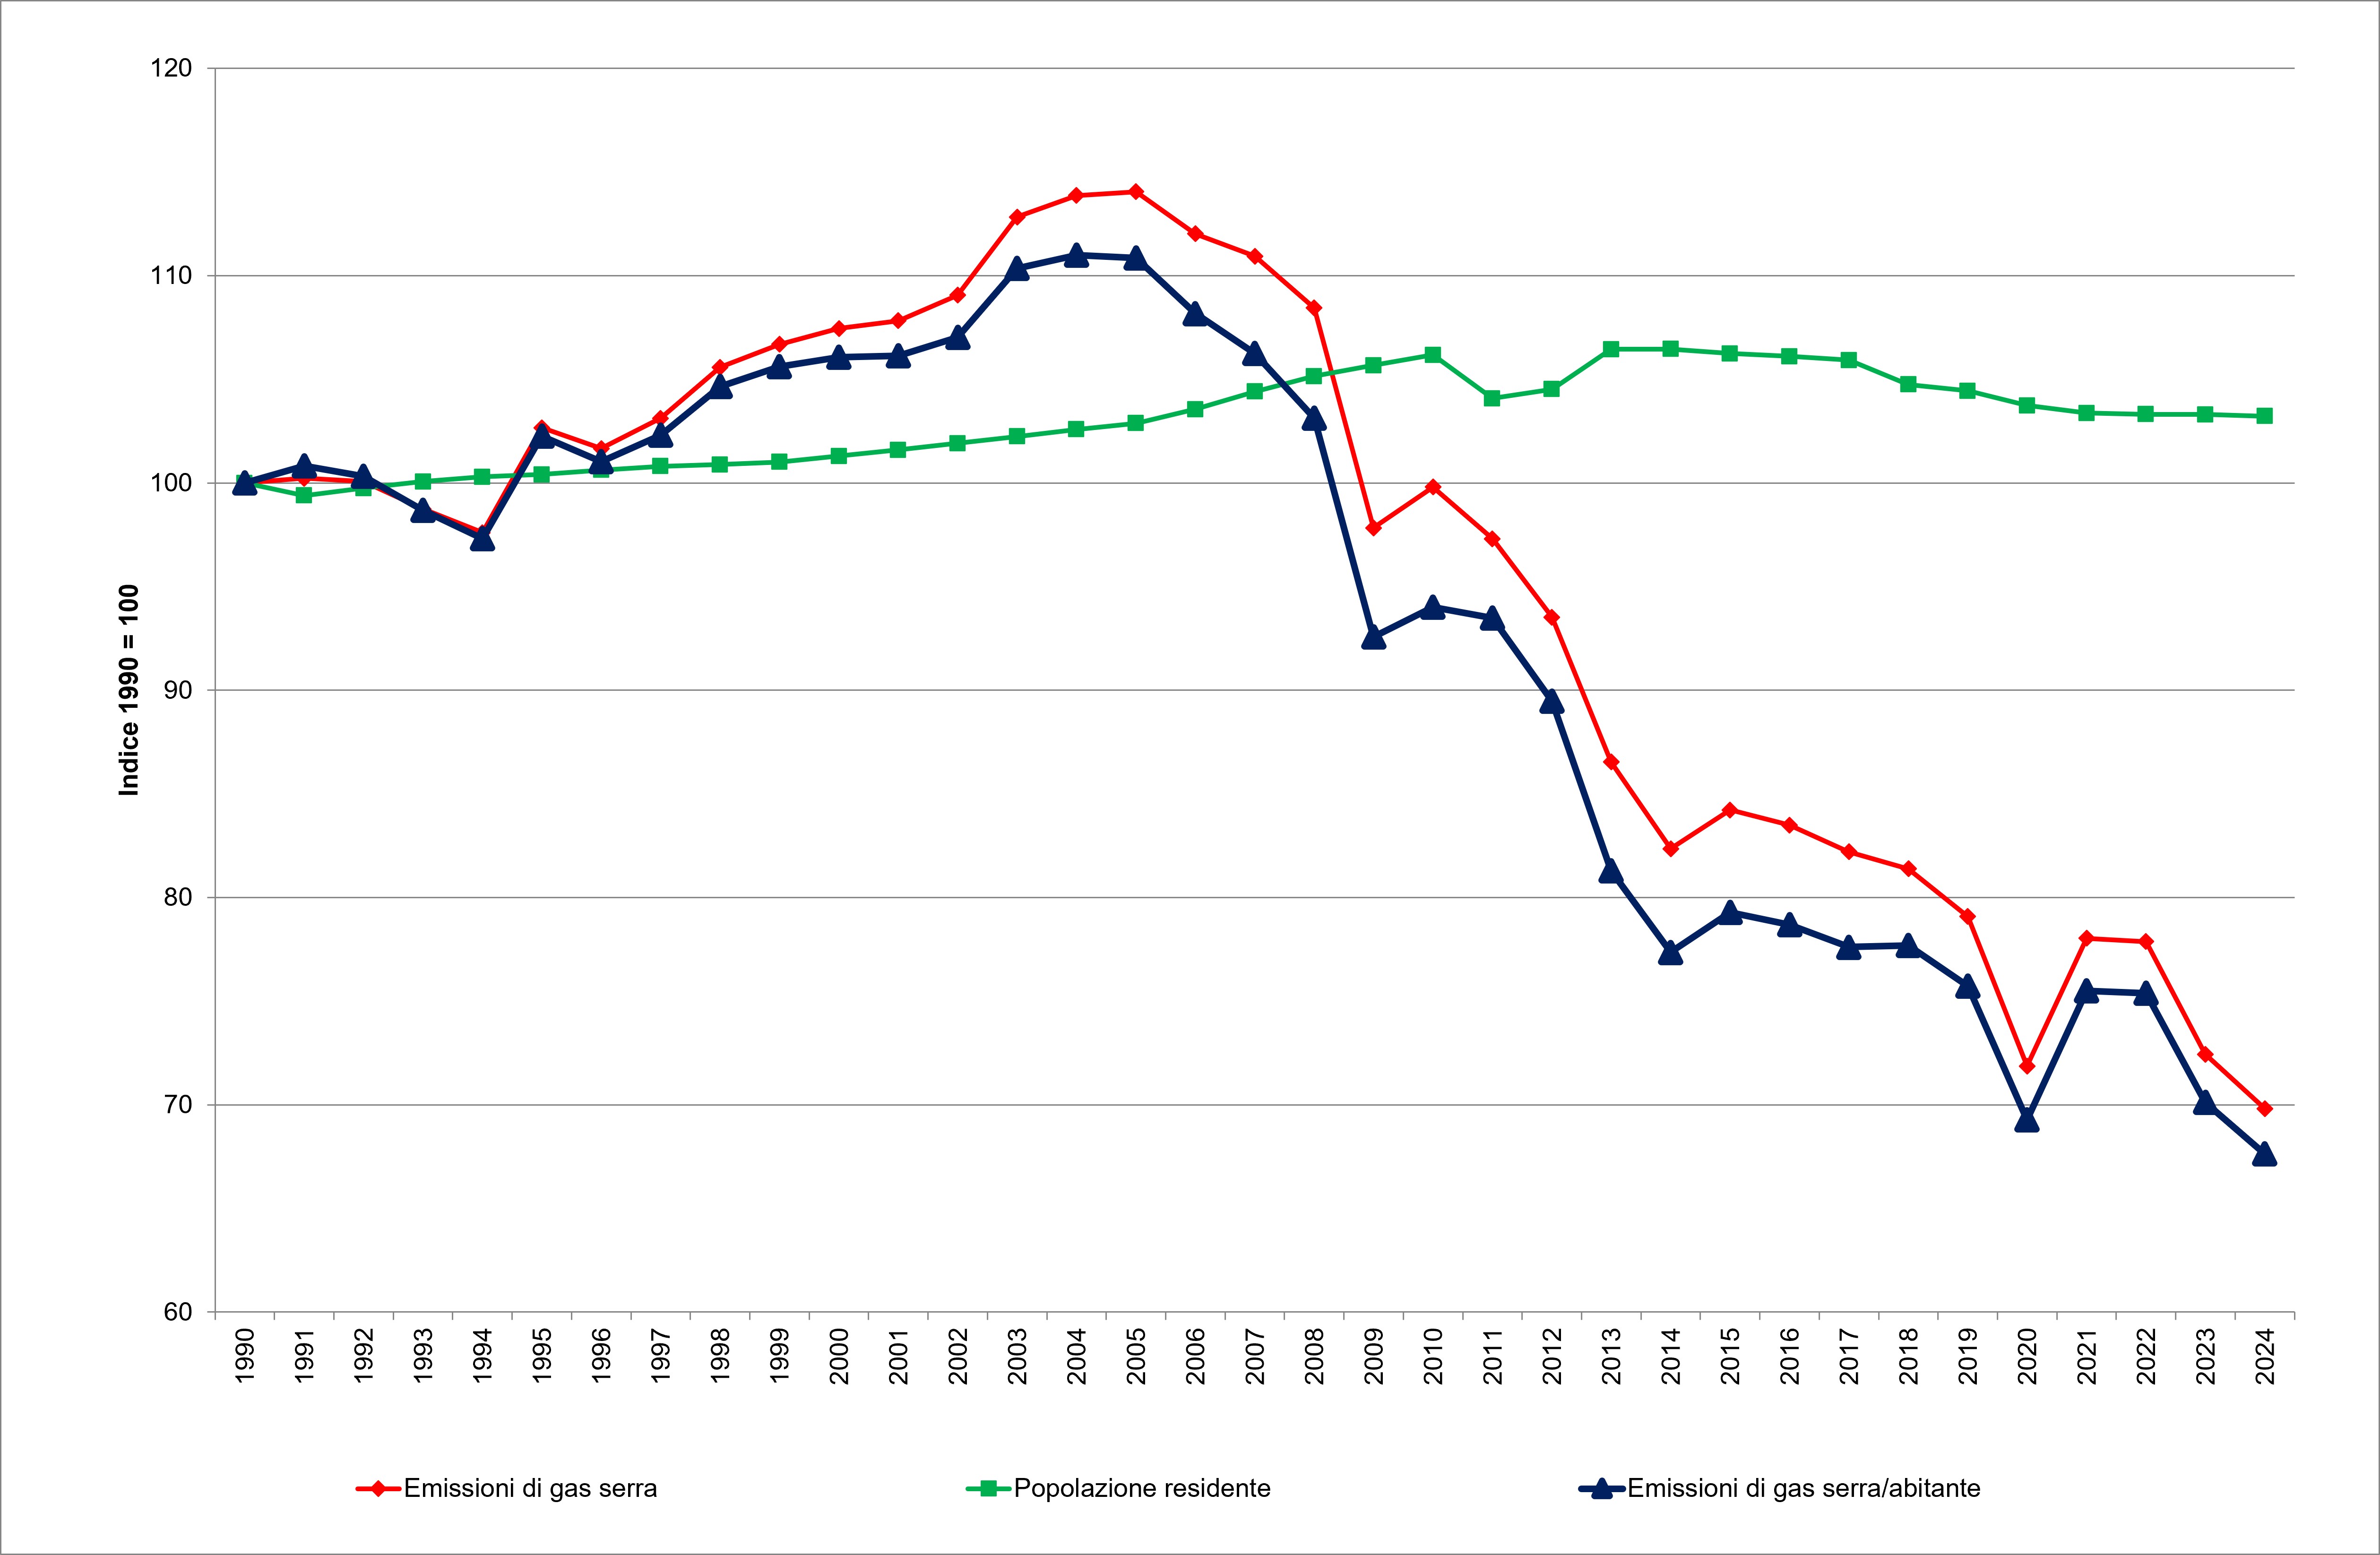
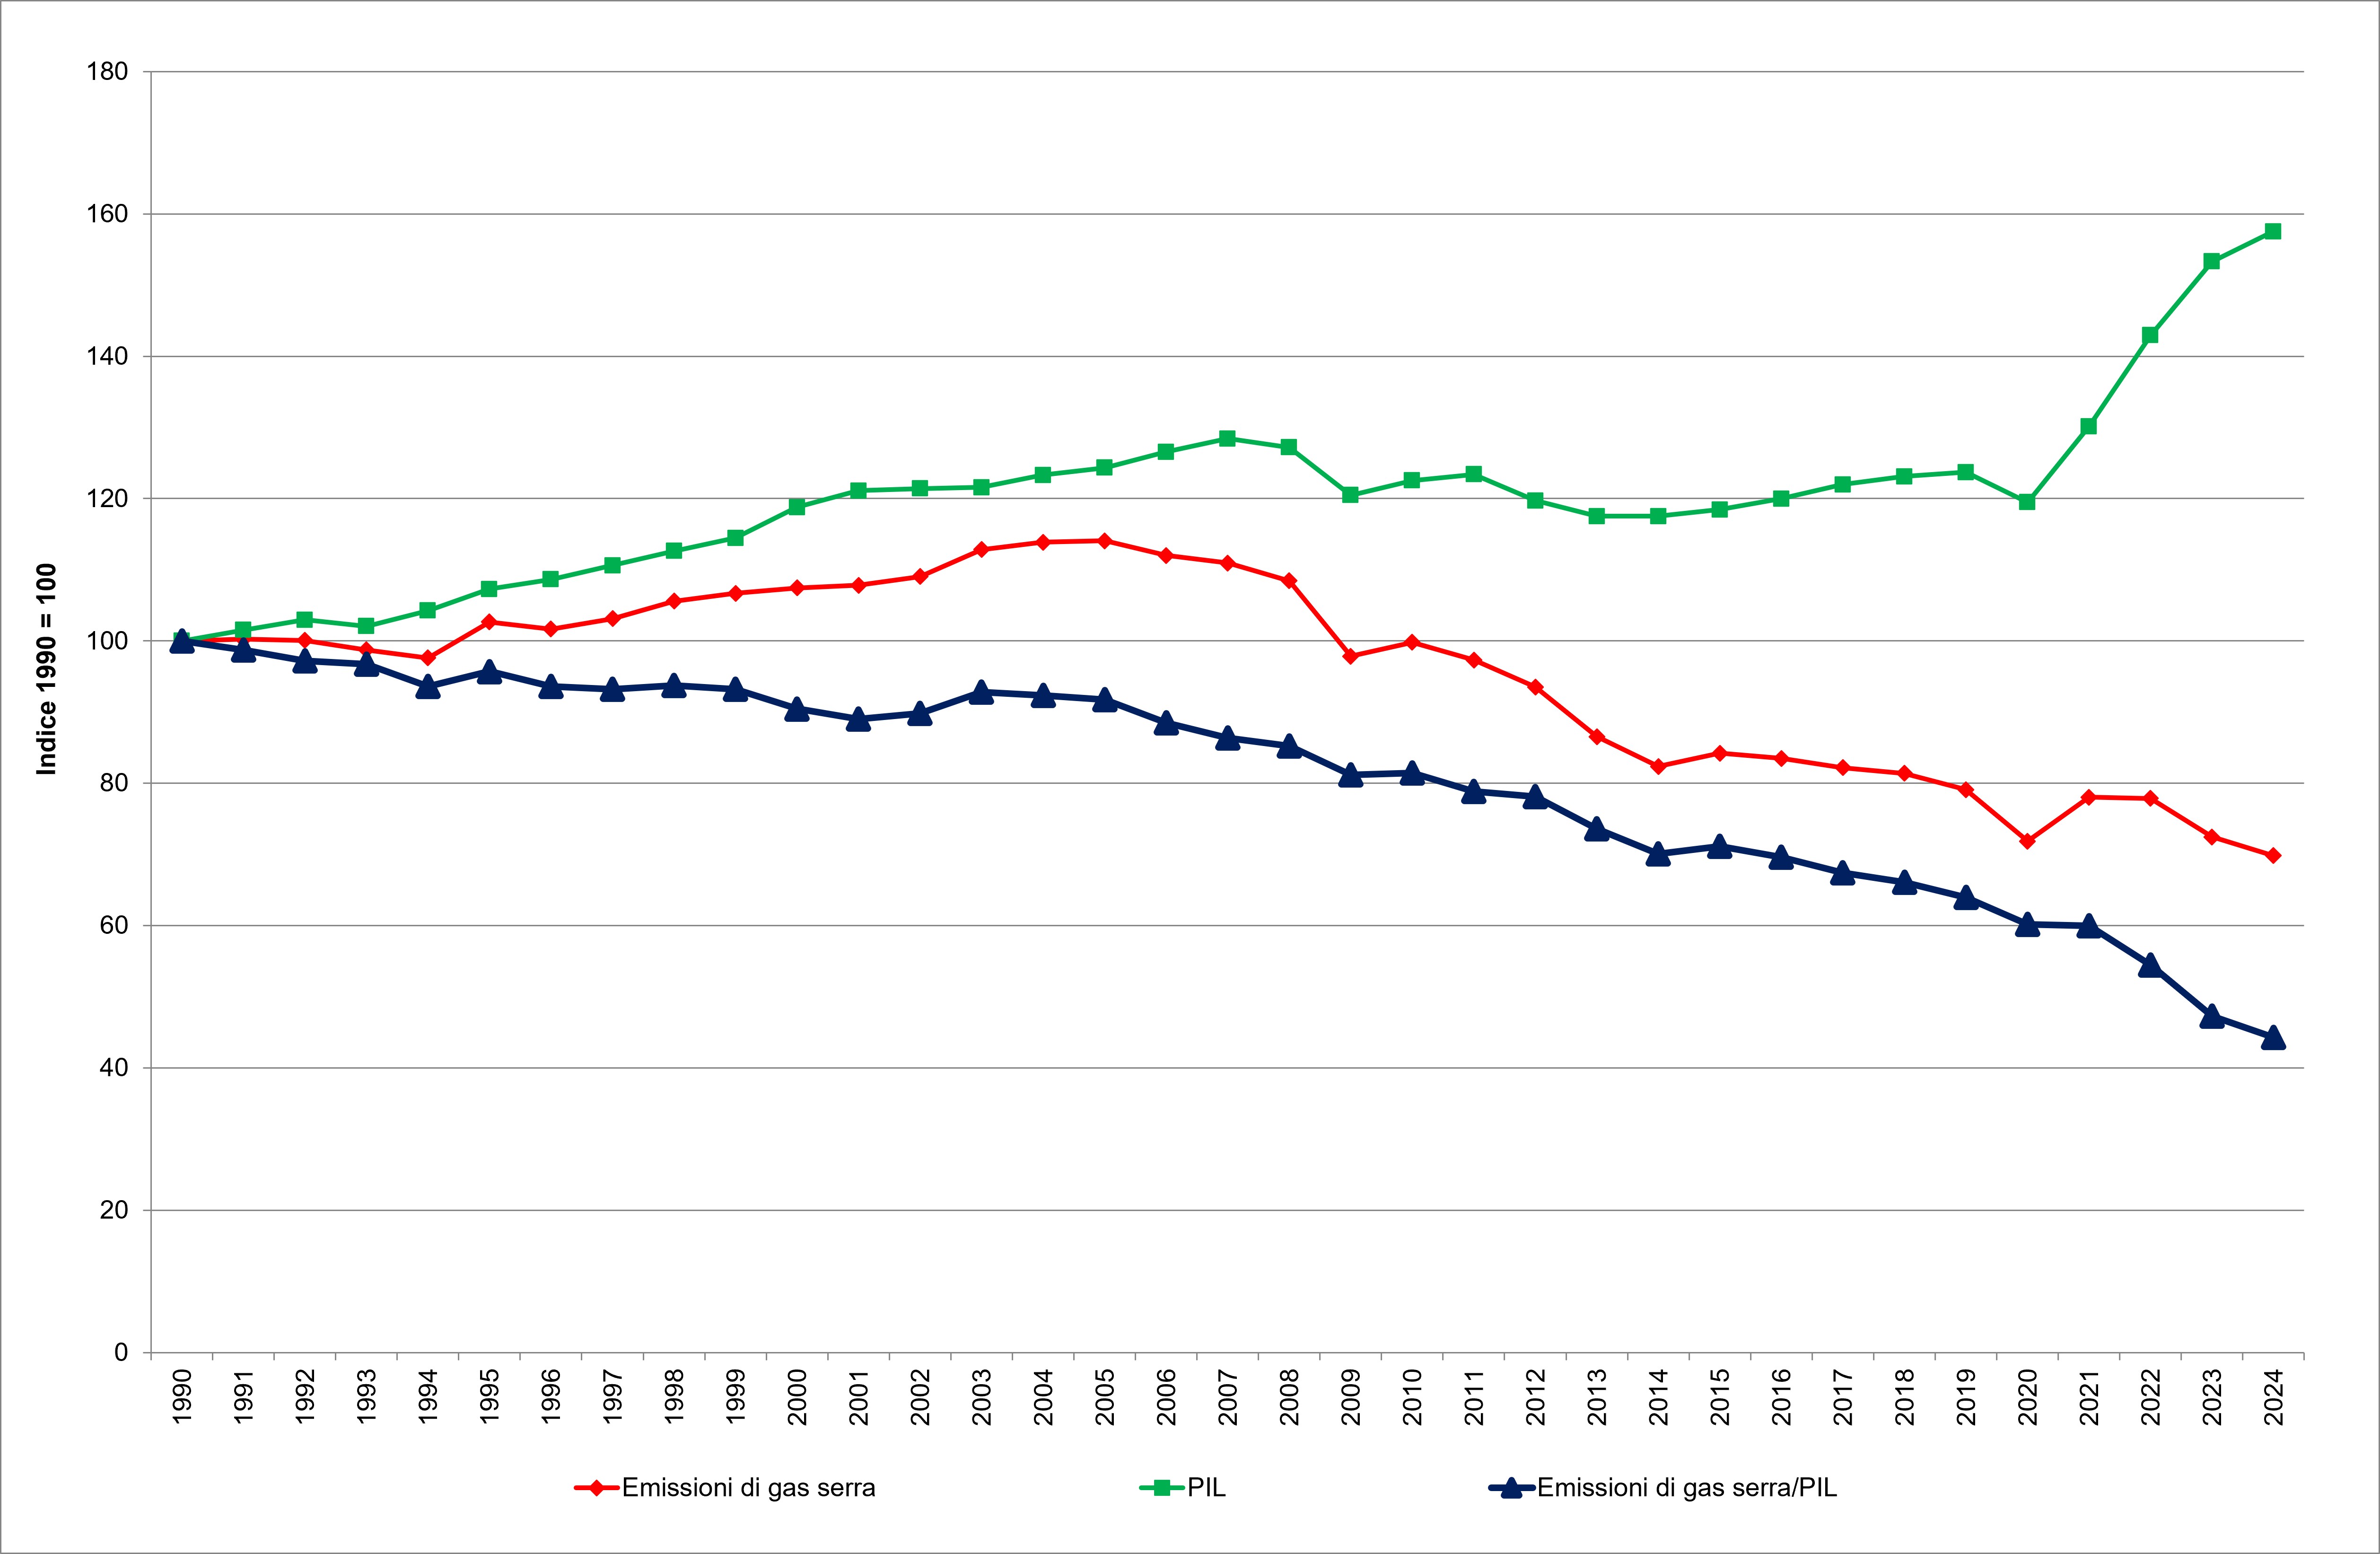
The indicator represents the trend of greenhouse gas emissions in Italy per inhabitant from 1990 to 2024, obtained by comparing the emission data officially communicated by ISPRA to the data on the resident population on 1 January published by Istat (Intercensus population reconstruction) and the trend of greenhouse gas emissions compared to the data on the Gross Domestic Product at market prices at current prices published by Istat. The indicators are represented as fixed-based index numbers (1990 = 100).
National greenhouse gas emissions in 2024 are equal to 363 million tonnes of CO2 eq.; in the same year the GDP is equal to 2,02,031 million euros, thus obtaining a value of emissions/GDP equal to 165.1 tonnes of CO2 eq per million euros, a decrease of 6.2%, while the resident population as of 01/01/2025 is equal to 58,943,000 inhabitants with per capita emissions equal to 6.2 tCO 2 per inhabitant with a reduction of 3.5% (Table 1 and Table 2). The reduction of both indicators highlights a favorable environmental situation and a progressive decoupling between climate-changing emissions, economic activity and demographic dynamics.
National greenhouse gas emissions will decrease by 30% from 1990 to 2024; in the same time frame there is an increase in the resident population of 3.2%, with a consequent decrease in per capita emissions of 32.4%, thus showing a decoupling between determinant and pressure (Table 1 and Figure 1). The same situation can be found for GDP, which however has a higher growth rate than the population (+57.5%), and a decrease in greenhouse gas emissions per GDP of approximately 56% (Table 2 and Figure 2).
| Data |
|---|
Headline
Table 1. Greenhouse gas emissions per capita in Italy Data source
Source: ISPRA processing based on greenhouse gas emissions data (ISPRA) and resident population data (Istat) |
Headline
Table 2. Greenhouse gas emissions relative to GDP in Italy Data source
ISPRA processing based on greenhouse gas emissions data (ISPRA) and gross domestic product (GDP) data (Istat) |
Thumbnail
Headline
Figure 1. Greenhouse gas emissions per capita (1990 = 100 index) Data source
ISPRA processing based on greenhouse gas emissions data (ISPRA) and resident population data (Istat) |
Thumbnail
Headline
Figure 2. Greenhouse gas emissions intensity of GDP in Italy, 1990–2024 (Index, 1990 = 100) Data source
ISPRA calculations based on greenhouse gas emissions data (ISPRA) and gross domestic product (GDP) data (Istat) |
The indicator, which expresses greenhouse gas emissions per capita and compared to GDP, highlights the national progress made with reference to a low-carbon, green and competitive economy, based on the efficient use of resources, showing clear decreases both compared to the population (-32.4%) (Table 1 and Figure 1) and compared to the GDP (-56%) (Table 2 and Figure 2).