Antonio Caputo, Giulia Iorio, Francesca Palomba
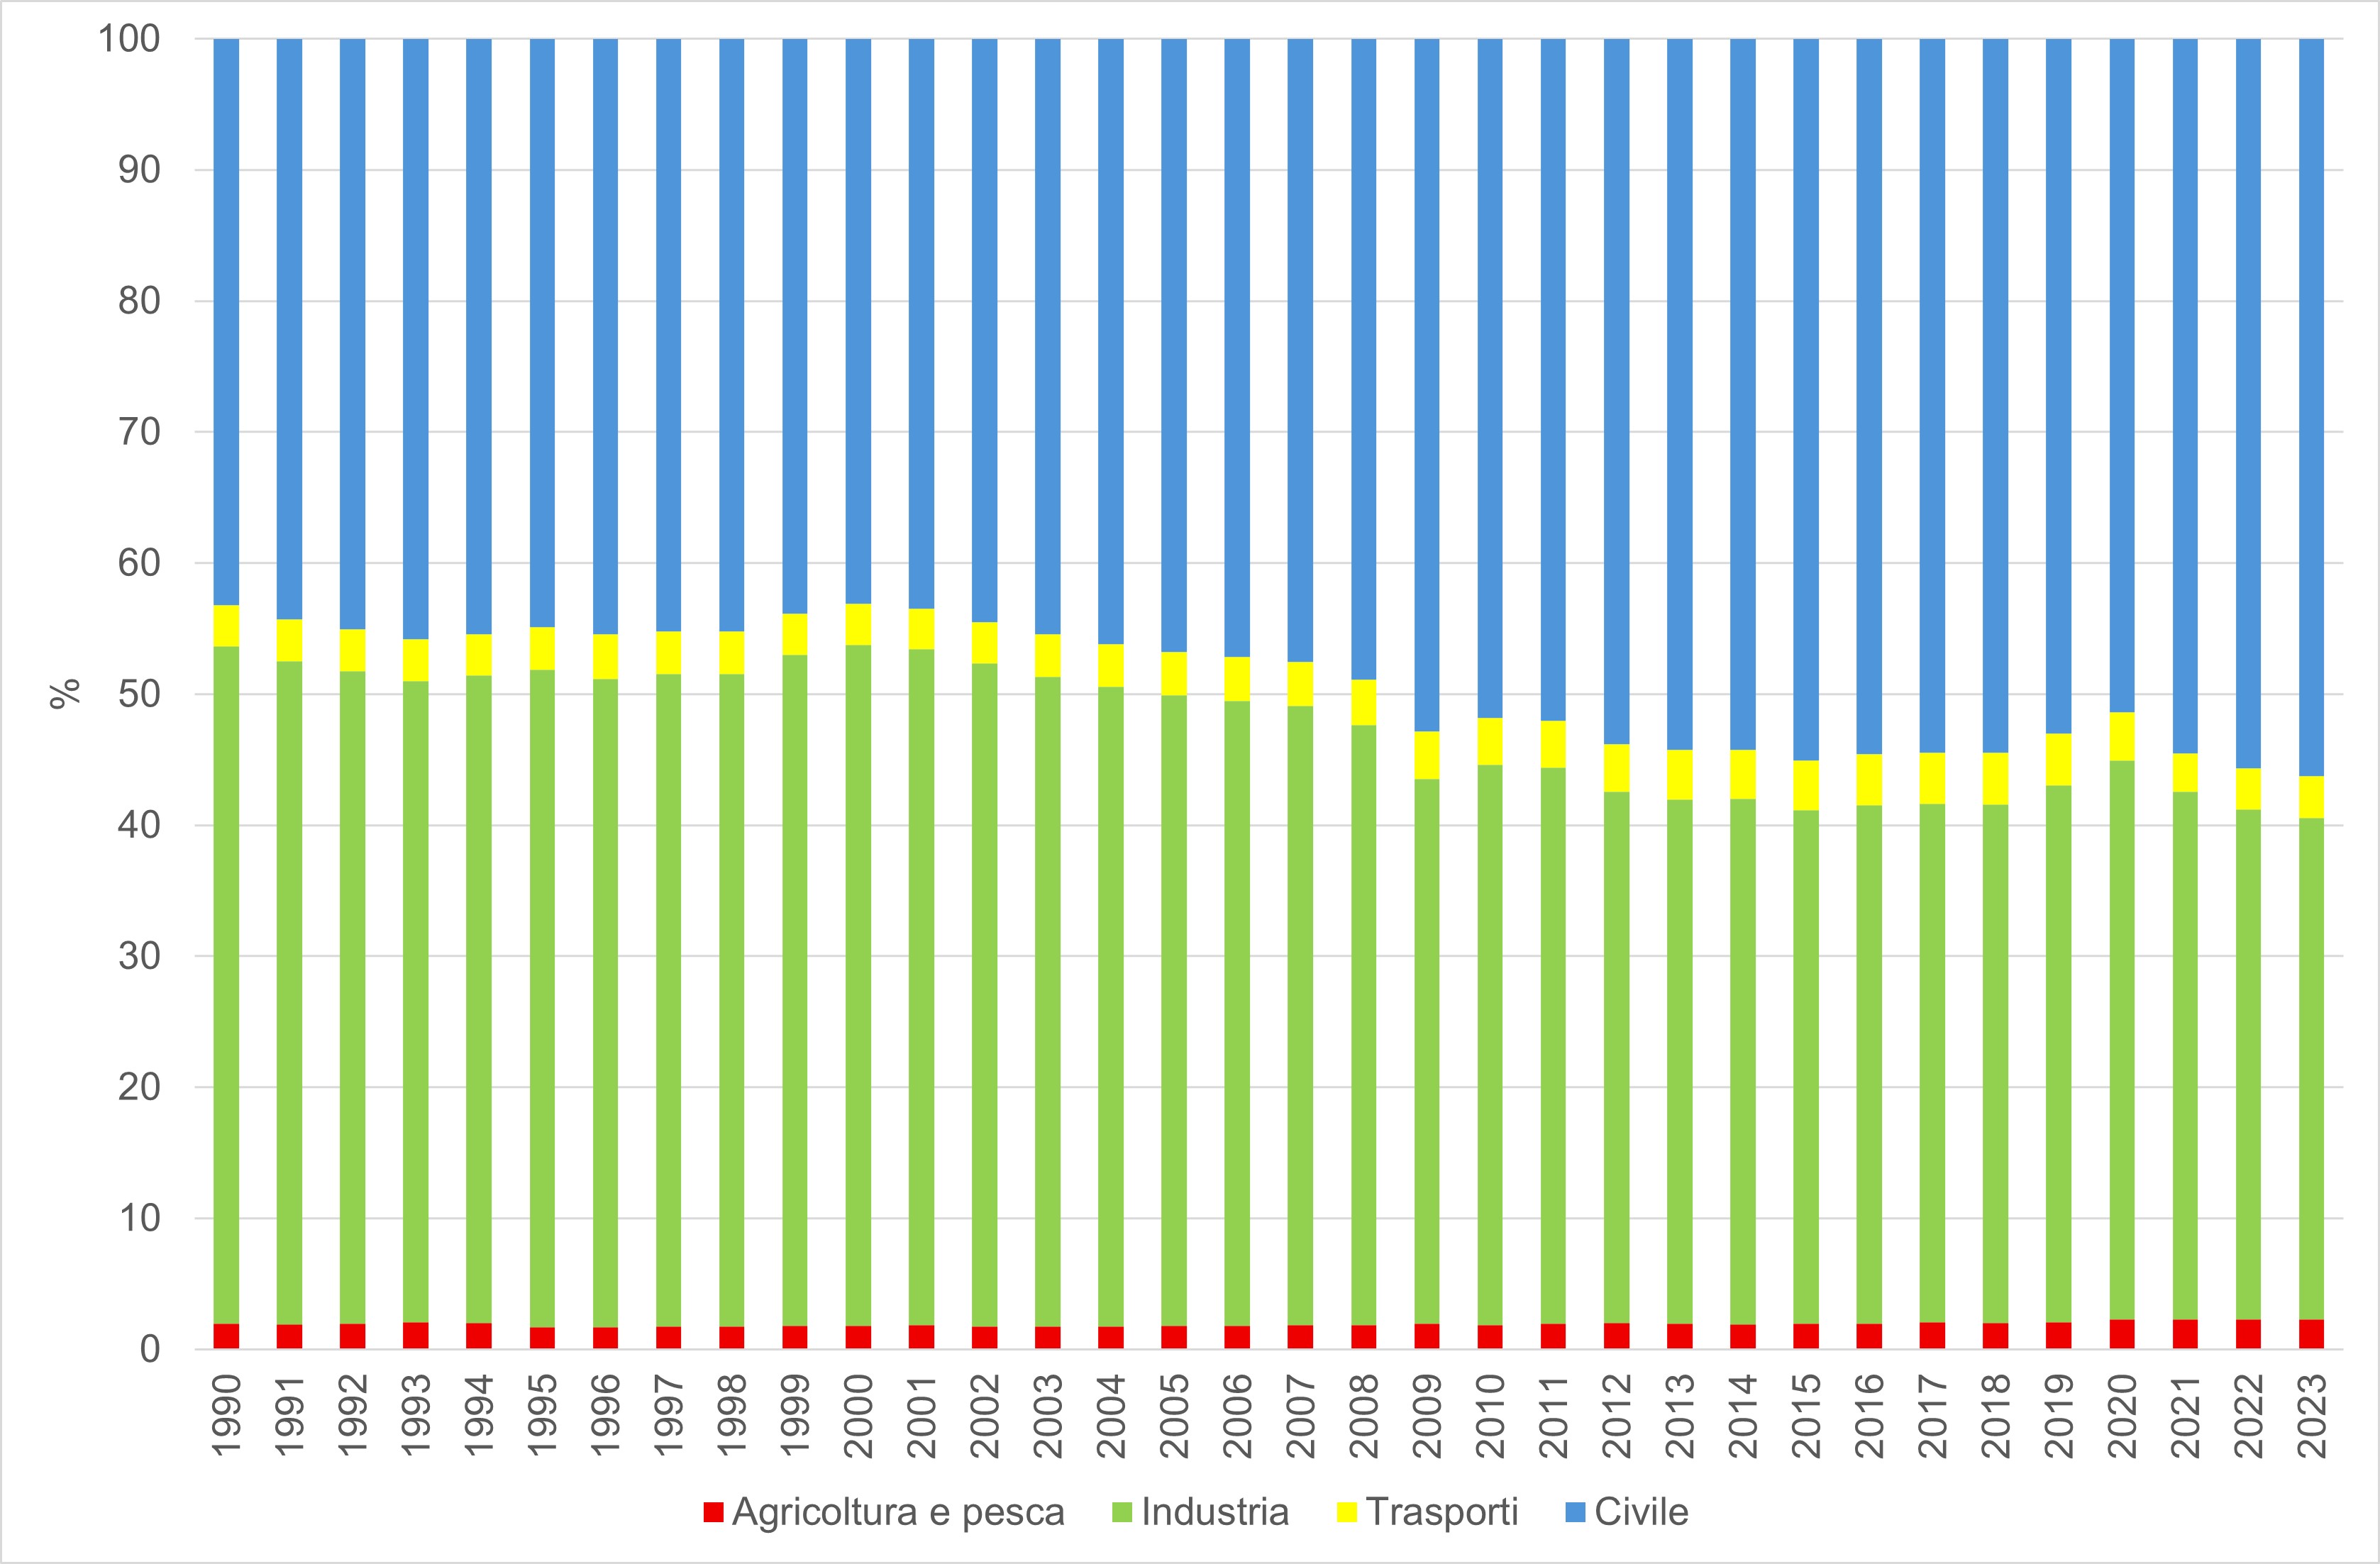
Final electricity consumption exhibited a steady upward trend from 1990 to 2008, subsequently declining as a consequence of the economic crisis. In 2020, in the wake of the SARS-CoV-2 pandemic, consumption contracted by 5.7% relative to the previous year, followed by a rebound of 6.2% in 2021, and a subsequent downturn in the following years. By 2023, consumption had decreased by 4.6% compared to 2021, stabilizing at 24 Mtoe. The share of industrial consumption declined from 51.7% in 1990 to 38.3% in 2023, while the combined share of the tertiary and residential sectors increased from 43.2% to 56.3%. The contribution of agriculture and fishery remained nearly constant at approximately 2%, whereas the transport sector, despite fluctuations, accounted for around 3.4%.
The indicator provides information on the electric energy needs of the entire national economy as well as of its various sectors.
To assess the trends in electricity consumption at both the national and sectoral levels, with the objective of reducing overall energy use.
With Decision No. 1386/2013/EU, the European Union established the 7th Environment Action Programme (EAP) up to 2020. On 29 March 2022, the Council of the EU adopted the 8th Environment Action Programme for the period 2021–2030. No specific targets are applicable to this indicator.
MASE, National Energy Balance (BEN),
https://sisen.mase.gov.it/dgsaie/
TERNA S.p.A., Statistical Data on Electricity in Italy, Various Years
The national data has been updated according to the new Eurostat classification. Based on the 2019 data, TERNA has reclassified economic activities by introducing the ATECO2007 classification, which may result in discrepancies between 2019 and previous years.
ENEA (Ente per le Nuove Tecnologie, l'Energia e l'Ambiente)
Terna - Rete Elettrica Nazionale S.p.A.
TERNA S.p.A., Statistical Data on Electricity in Italy
ENEA, Regional Energy Balances
National
1990-2023
The data are collected by Terna Rete Italia S.p.A. through a census-based survey of operators in the electricity sector, with acquisition via the web of the main electrical variables. The national data have been updated according to the new Eurostat classification. In addition to the national data collected by Terna and communicated to the Ministry of Economic Development, there are regional estimates provided by ENEA based on the Regional Energy Balances.
In 2023, electricity consumption amounted to 24 Mtoe (−2.8% compared to the previous year). Detailed analysis shows different trends across sectors, although all sectors experienced a reduction in consumption compared to 2022. The industry sector and agriculture and fishery sector recorded declines of 4.4% and 4.3%, respectively, while the transport sector reduced consumption by 1.8%. The residential and services sectors decreased by 1.9% and 1.6%, respectively. The share of consumption in the industry sector is 38.3%, while the combined share of the tertiary and residential sectors is 56.3%; agriculture and fishery sector account for 2.3%, and transport represents 3.2% (Table 1).
Final electricity consumption increased steadily from 1990 to 2008 (+44.1%), then declined in the following year (−6.2% compared to 2008) due to the economic crisis. In 2010 and 2011, electricity consumption recovered, followed by a new decline until 2014. From 2015, consumption began to rise again, reaching a stable level from 2017 onward. In 2020, a sharp drop in consumption was recorded due to lockdown measures implemented to contain the spread of the SARS-CoV-2 pandemic (−5.7% compared to 2019), followed by a rebound of 6.2% in 2021 and decreases in the subsequent two years. In 2023, consumption was 4.6% lower than in 2021 (Table 1).
The share of consumption in the industry sector fell from 51.7% in 1990 to 38.3% in 2023, while the tertiary and residential sectors increased from 43.2% to 56.3%. The agriculture and fishery sector remained almost constant at around 2%, and the transport sector remained near an average of 3.4% (Figure 1).
| Data |
|---|
Headline
Table 1: Final Electricity Consumption by Sector* Data source
TERNA S.p.A., EUROSTAT Note
*Since 2019, TERNA has reclassified sectoral activities by introducing the ATECO2007 classification, which may result in discrepancies between 2019 and previous years. |
Thumbnail
Headline
Figure 1: Share of Final Electricity Consumption by Sector Data source
TERNA Note
*As of 2019, TERNA reclassified economic activities using the ATECO2007 classification system, which may lead to inconsistencies between 2019 data and those of previous years. |
In 2023, national final electricity consumption amounted to 23,969 ktoe (Table 1). Total consumption increased compared to 1990 in all sectors, with the sole exception of industry. In the civil sector, the 69.1% increase in consumption between 1990 and 2023 is attributable both to higher household welfare, which has promoted the spread of durable goods within homes, and to greater electricity use in the tertiary sector. The consistently upward trend in consumption across the civil sector showed only a slight decline in 2013 and 2014 due to the economic crisis, and a contraction in 2020 in the services sector as a result of the SARS-CoV-2 pandemic.
Between 1990 and 2023, residential consumption increased by 20.3%, while the services sector grew by 133.4%. In 1990, the respective shares of electricity consumption in the residential and services sectors were 24.6% and 18.6%. Starting in 2003, the share of electricity consumption in services exceeded that of the residential sector, reaching 33.5% in 2023 compared to 22.7% in residential. Industry is the only sector where consumption in 2023 was lower than in 1990, with a decline of −3.8% (Table 1).