Giovanni Finocchiaro, Silvia Iaccarino
The indicator measures the pressure exerted by tourist flows on Italy’s waste management system and is used as a proxy for monitoring Goal 12 of the 2030 Agenda, specifically SDG indicator 12.b.1.
The expanded methodology provides a more comprehensive and realistic estimate of the equivalent tourist population. In addition to officially recorded nights spent in tourist accommodation establishments, it includes nights spent in free accommodation—such as second homes and the homes of relatives or friends—as well as same-day visits.
In 2024, the indicator reached 16.2 kg per equivalent inhabitant, an increase of approximately 0.5 kg compared with 2023 and more than 5 kg above the value calculated using the “conventional” equivalent population, which amounted to 10.8 kg per equivalent inhabitant.
Second homes remained the main component accounting for this difference, adding 4.3 kg, followed by same-day visits, which added 1.2 kg. The result confirms the increasing pressure of tourism on municipal cleansing and waste management services, particularly in highly seasonal destinations, and strengthens the need for waste prevention and collection policies tailored to emerging patterns of tourism use.
The indicator measures one of the most significant impacts of tourism, namely the increase in municipal waste generation. It estimates the per capita quantity of waste attributable to tourism by comparing the resident population with an equivalent tourist population.
The indicator makes it possible to assess the pressure exerted by tourist flows on local waste management systems and represents a useful proxy for monitoring Goal 12 of the 2030 Agenda, specifically SDG indicator 12.b.1.
The indicator is calculated as the difference between:
- per capita municipal waste generation calculated using the resident population; and
- per capita municipal waste generation calculated using the “equivalent tourist population”.
The equivalent tourist population is calculated by adding to the resident population the tourist nights recorded during the year, converted into an average daily population by dividing them by 365.
Since 2019, in addition to nights spent by Italian and foreign tourists in accommodation establishments in Italy, the calculation has included:
a) nights spent in free accommodation, including second homes and the homes of relatives or friends, by both Italian and foreign tourists; and
b) same-day visits made within Italy by foreign visitors and Italian residents.
The additional components are estimated using the Bank of Italy’s International Tourism Survey for foreign visitors—inbound tourism—and Istat’s Trips and Holidays survey for Italian residents—domestic tourism.
Same-day visits, or excursions, are defined as tourism trips not involving an overnight stay, undertaken by same-day visitors for any purpose. Trips made by cross-border commuters and travellers merely transiting through border crossings are excluded.
Free accommodation includes dwellings owned by tourists, such as second homes, and the homes of relatives or friends where tourists stay without payment.
To estimate the contribution of the tourism sector to municipal waste generation.
There are no specific regulatory references for this indicator, nor does it have defined targets.
EUROSTAT (2006) - Working Papers and Studies "Methodological work on measuring the sustainable development of tourism -Part 2 Holden, A., 2008. Environment and tourism, 2nd ed. Ed., Routledge introductions to environment series. Routledge, London; New York.
Despite the methodological expansion, some limitations remain:
- tourists and residents are assumed to generate the same average quantity of waste;
- specific estimates of waste generated at tourism access points, such as airports and ports, are not available;
- waste generated by tourism-related commercial activities is not directly included in the indicator;
- estimates of nights spent in second homes and same-day visits are indirect and based on sample surveys.
Nevertheless, the indicator currently represents the most advanced estimate available. It is consistent with the SDGs and is useful for regional and local policies concerning waste management and sustainable tourism.
ISPRA (Italian Institute for Environmental Protection and Research)
ISTAT (National Institute of Statistics)
Bank of Italy
http://www. catasto-rifiuti. isprambiente. it/
https://www. bancaditalia. it/statistiche/tematiche/rapporti-estero/turismo-internazionale/distribuzione-microdati/tabelle-pivot/index. html
For Istat data ( https://www. istat. it/dati/banche-dati/), ( https://www. istat. it/dati/microdati/ad-uso-pubblico/).
National, Regional
2006-2024
Until 2018, the indicator was calculated using the basic methodology:
Per capita waste generation attributable to recorded tourist flows =
(Total waste / Resident population) − (Total waste / Equivalent population)
where the equivalent population was calculated as the resident population plus the number of officially recorded tourist nights during the year, divided by 365.
The basic methodology therefore considered the resident population and officially recorded overnight stays in tourist accommodation establishments, converted into an annual average daily population.
Since 2019, an expanded methodology has been adopted. It also includes:
- nights spent in free accommodation, including second homes and the homes of relatives or friends;
- same-day visits without an overnight stay, made by both Italian residents and foreign visitors.
The information is estimated using official sources: Istat’s Trips and Holidays survey for Italian residents and the Bank of Italy’s International Tourism Survey for foreign visitors.
In 2024, the indicator reached 16.2 kg per equivalent inhabitant at national level, an increase of approximately 0.5 kg compared with the 2023 value of 15.7 kg per equivalent inhabitant.
The increase reflects the full recovery of tourist flows and the continuing intensive use of second homes, which added 4.3 kg to the indicator, and same-day visits, which added 1.2 kg.
From an environmental perspective, the situation remains unfavourable. Tourism continues to make a significant contribution to municipal waste generation, moving further away from the waste prevention and reduction objectives established by circular economy policies.
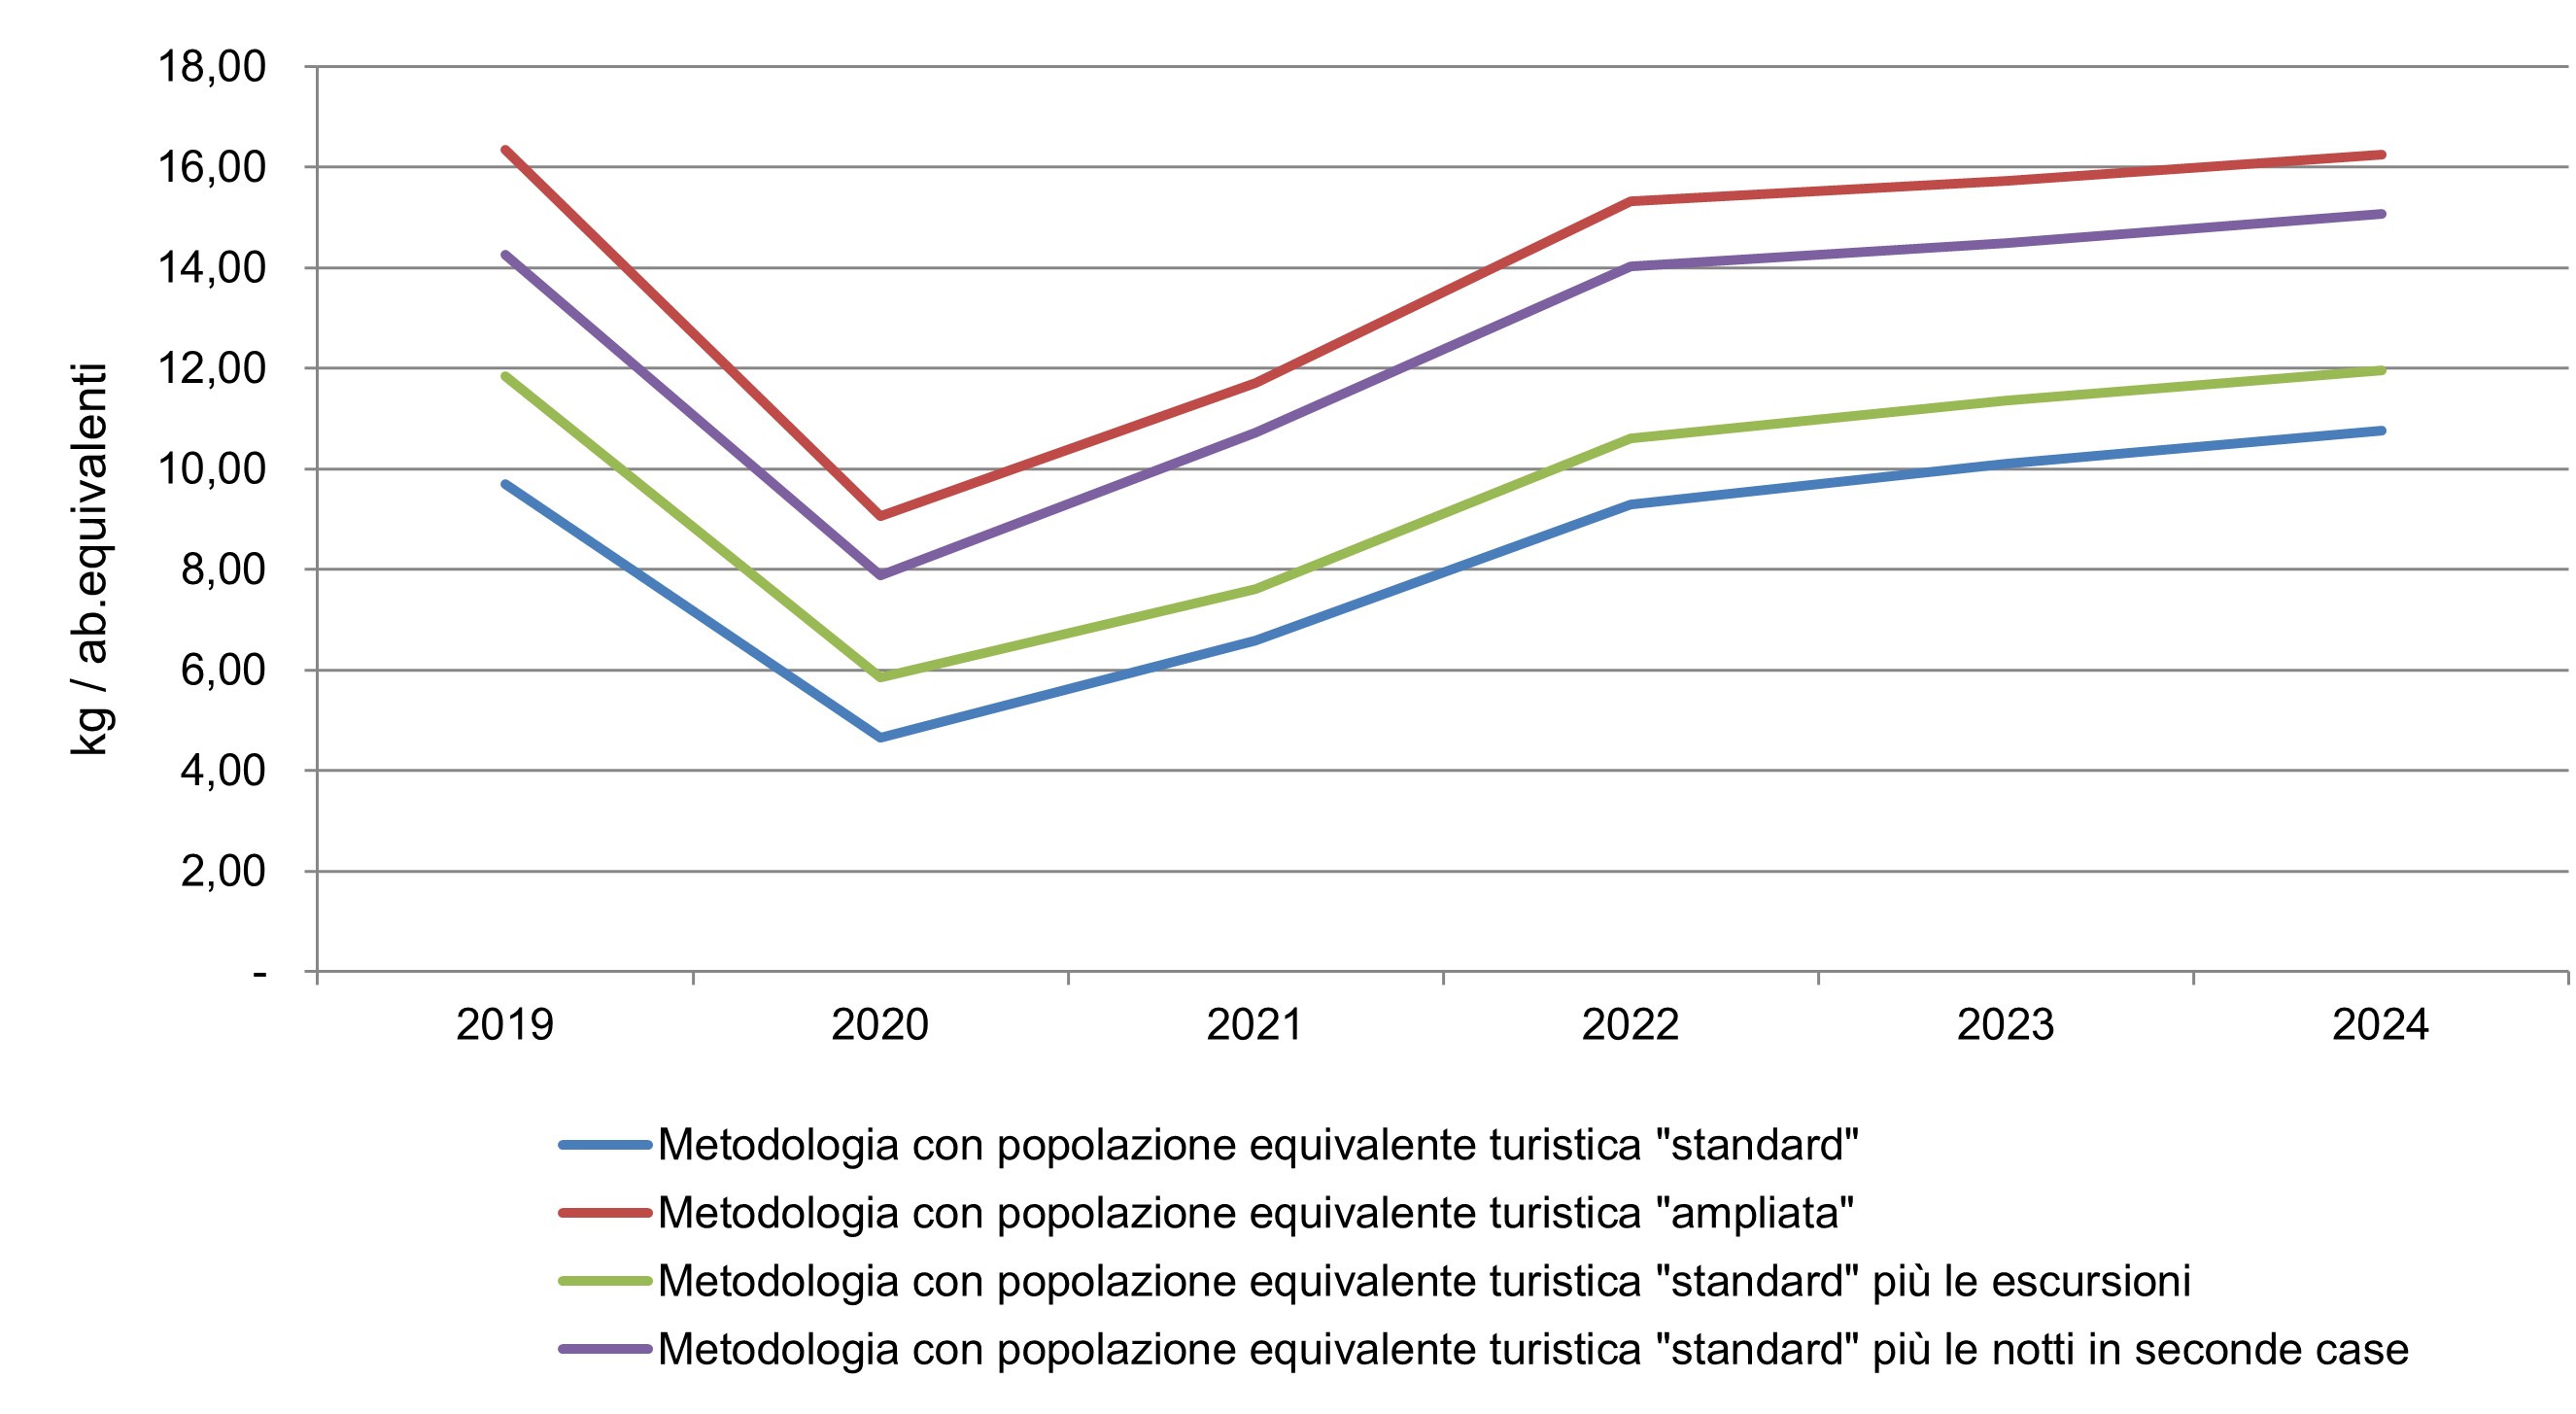
Over the 2019–2024 period, analysed using the expanded methodology, the indicator remained at a high but broadly stable level. It decreased only marginally, from 16.3 kg per equivalent inhabitant in 2019 to 16.2 kg per equivalent inhabitant in 2024.
The decline recorded during the 2020–2021 pandemic period was reversed in 2023, and the indicator increased further in 2024, rising by 0.5 kg compared with 2023. This indicates that tourism-related pressure, although not increasing beyond the pre-COVID peak, shows no clear sign of declining.
The persistence of a plateau above 16 kg per equivalent inhabitant confirms the need for more effective mitigation and waste prevention measures (Figure 2).
| Allegati |
|---|
Headline
Tabella 1: Distribuzione regionale della quota pro capite dei rifiuti urbani attribuibili al turismo Data source
Elaborazione ISPRA su dati ISPRA, ISTAT e Banca d'Italia |
Thumbnail
Headline
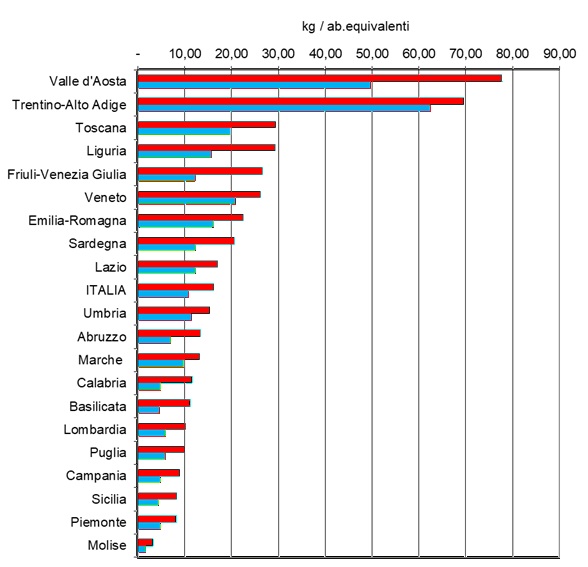
Figura 1: Distribuzione regionale della quota pro capite dei rifiuti solidi urbani attribuibili al turismo: differenze tra metodologia precedente e "ampliata"(2024) Data source
Elaborazione ISPRA su dati ISPRA, ISTAT e Banca d'Italia |
Thumbnail
Headline
Figura 2: Distribuzione nazionale della quota pro capite dei rifiuti urbani attribuibili al turismo, secondo le diverse metodologie Data source
Elaborazione ISPRA su dati ISPRA, Istat e Banca d'Italia |
Thumbnail
Headline
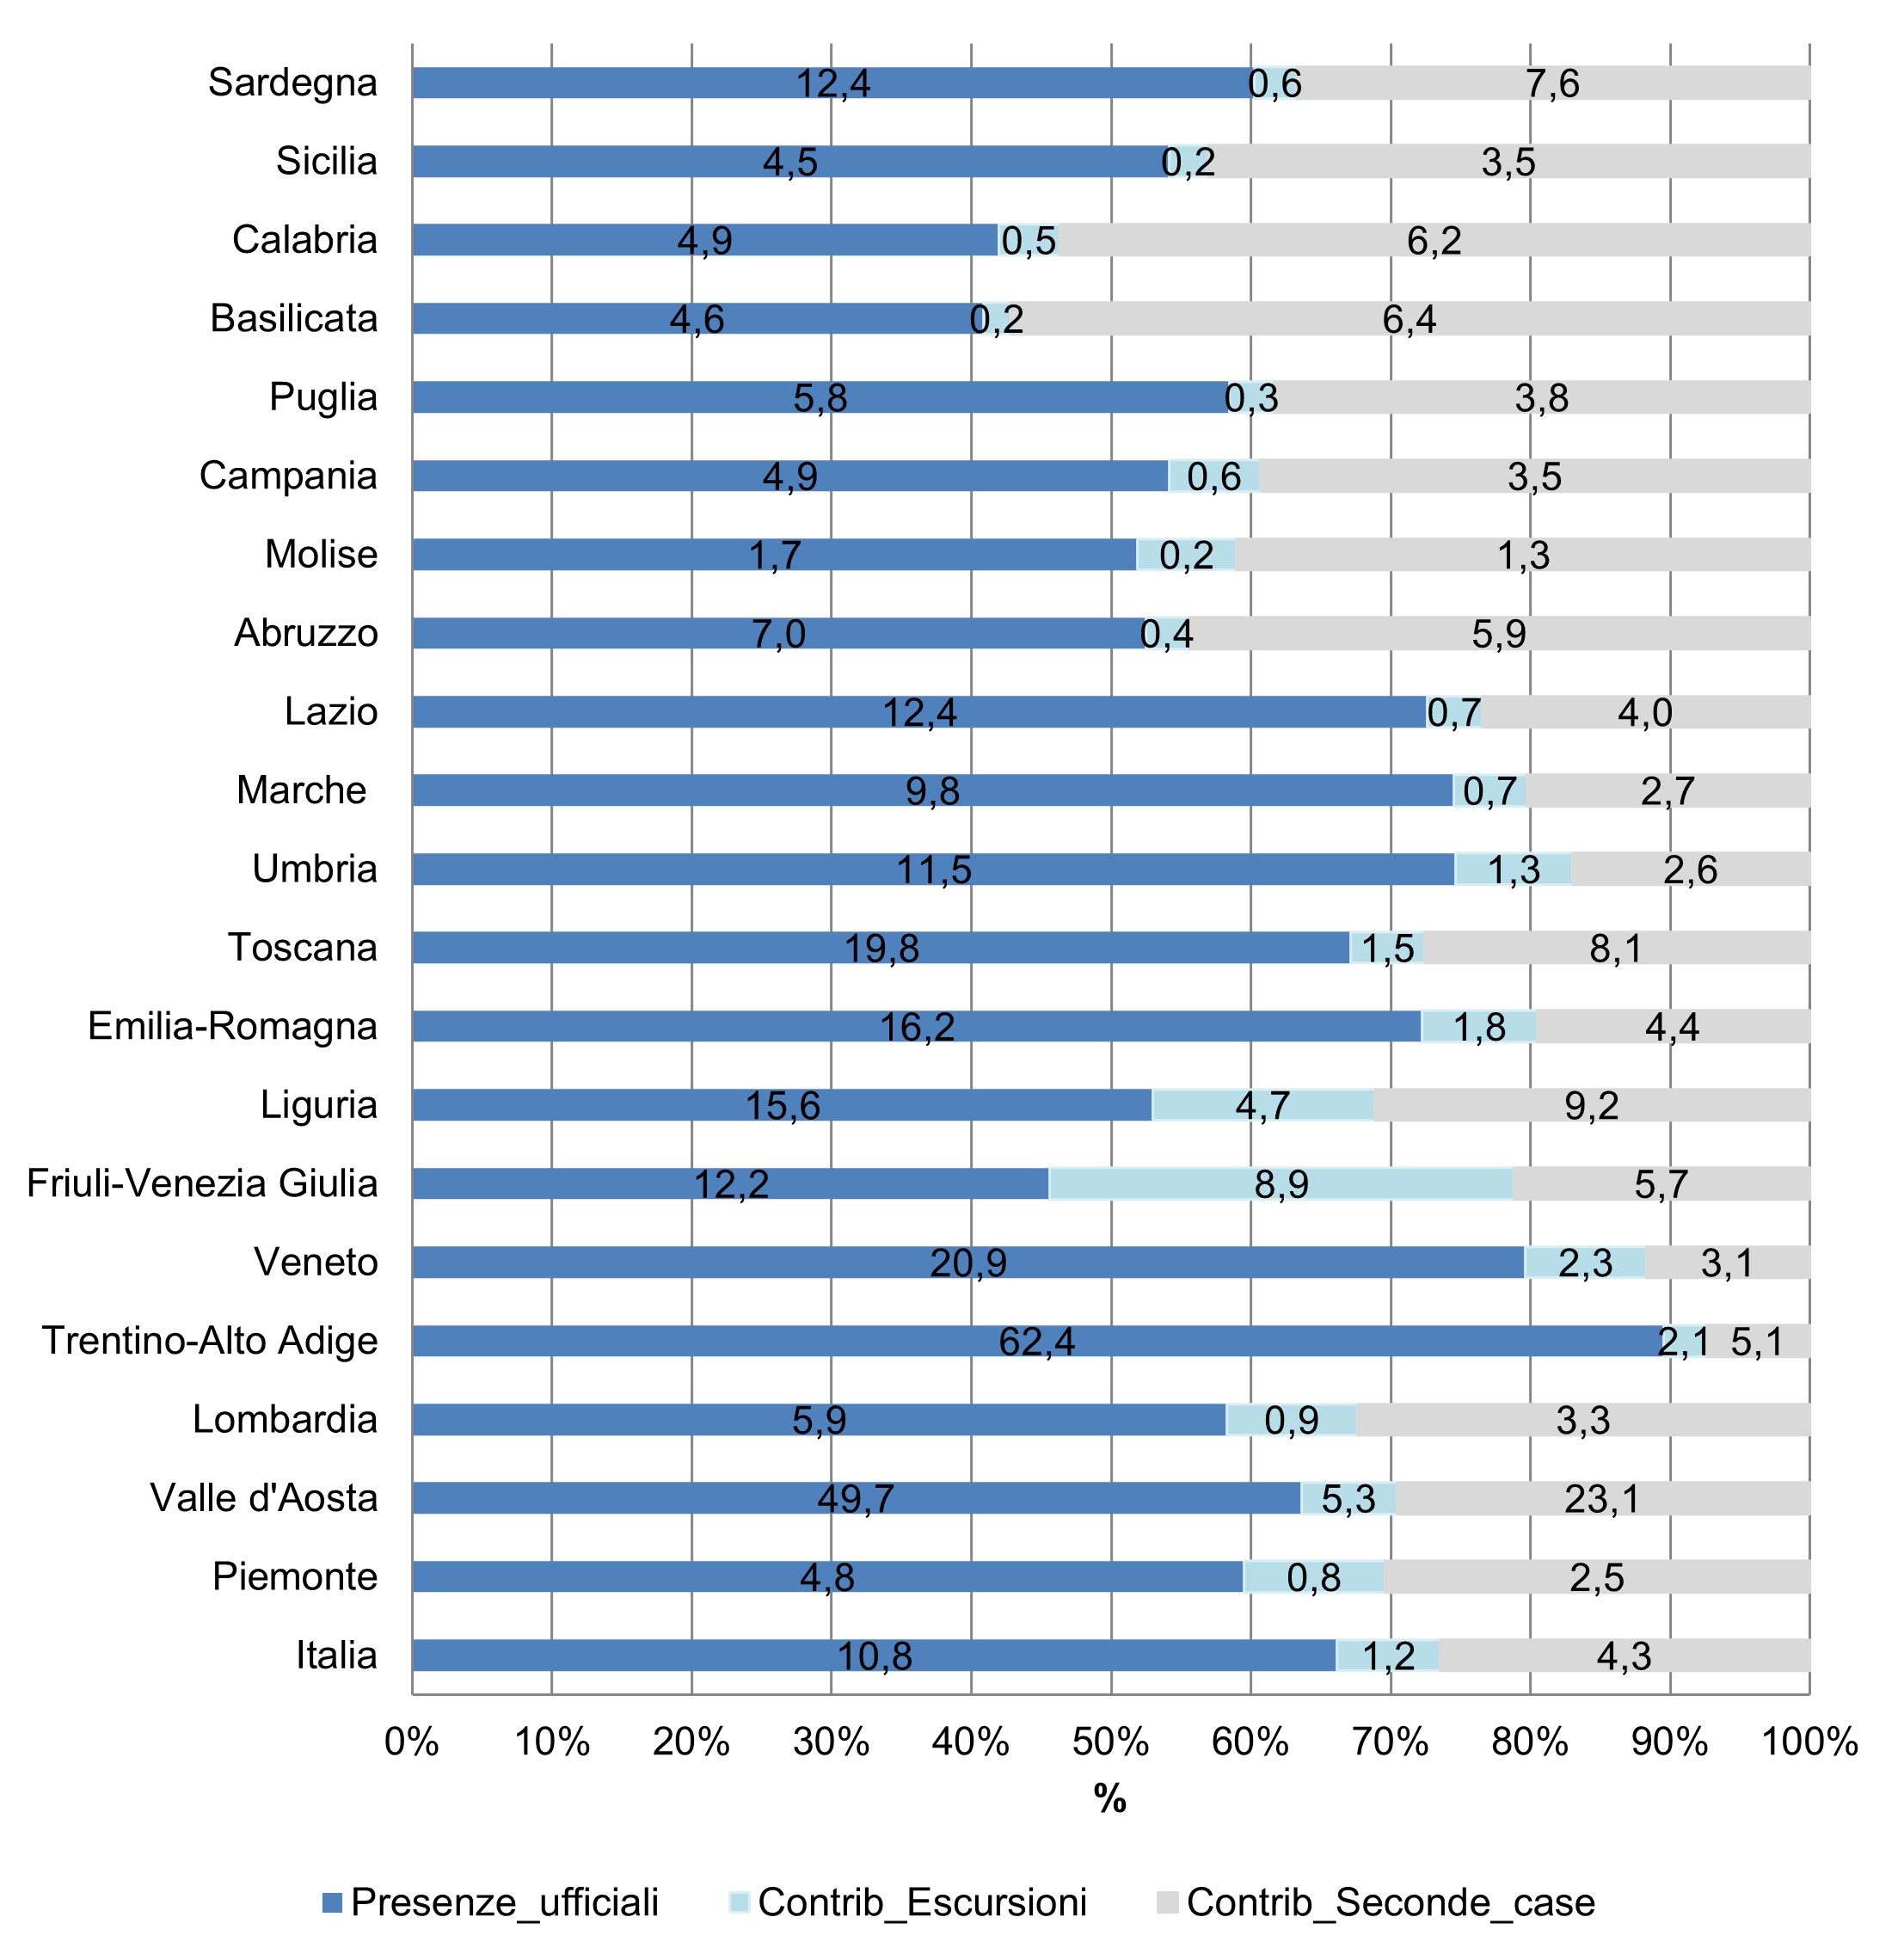
Figura 3: Contributo delle varie componenti aggiunte nella metodologia "ampliata" per regione (2024) Data source
Elaborazione ISPRA su dati ISPRA, Istat e Banca d'Italia |
In 2024, the national indicator stabilised at 16.2 kg per equivalent inhabitant, slightly below the pre-pandemic peak recorded in 2019. The recovery in tourist flows therefore did not trigger a new overall increase, but maintained pressure at a level that was already critical for municipal waste collection systems.
However, the national average conceals substantial regional differences. In the Aosta Valley, the indicator reached 77.7 kg per equivalent inhabitant, driven mainly by second homes, which alone contributed approximately 23 kg per equivalent inhabitant. In Trentino-Alto Adige, the value approached 70 kg per equivalent inhabitant.
Further south, a second group of coastal regions and highly tourism-oriented areas—Tuscany, Liguria, Friuli-Venezia Giulia and Veneto—recorded values ranging from 26 to 30 kg per equivalent inhabitant.
In these regions, same-day visits make a substantial contribution to the indicator. In Friuli-Venezia Giulia, for example, excursions added almost 9 kg to the value calculated using the basic methodology (Figure 3).
An examination of the individual components shows that nights spent in second homes account for the predominant share of the additional waste pressure in many Alpine and island regions. Same-day visits, by contrast, have a particularly strong impact along the northern Adriatic coast and in the main seaside destinations.
This distribution confirms that “invisible” tourist flows—second-home users and same-day visitors—now play a decisive role in municipal waste generation.
For municipal cleansing and waste management service providers, this means managing highly concentrated seasonal loads. Without strengthening collection services during peak periods, increased waste volumes may result in additional disposal in landfills or greater pressure on treatment facilities that are already operating at or near capacity.
At the same time, the absence of a downward trend indicates that existing waste prevention measures are not producing the expected effects.
More targeted policies are therefore required. These could include charging systems that reflect the actual use of services by second-home users and same-day visitors, awareness campaigns specifically targeting tourists, and agreements with tourism operators to reduce waste generation at source.
Such measures are necessary to place the indicator on a downward trajectory consistent with circular economy objectives.