TOURIST FLOWS BY MODE OF TRANSPORT
Data aggiornamento scheda:
In 2024, inbound tourist flows at national borders continued to grow, reaching 88.6 million foreign visitors, compared with 85.7 million in 2023, an increase of 3.4%.
Air travel overtook road transport as the main mode of entry in 2024, accounting for 50.6% of inbound flows, while the share entering through road border crossings continued to decline, falling to 45.9%. Rail and sea arrivals remained marginal, accounting for 1.5% and 1.9%, respectively.
For trips made by residents in Italy within the country—the domestic component—passenger cars remained by far the dominant mode and increased their share further. In 2024, cars accounted for 72.6% of domestic trips, compared with 69.5% in 2023, while the share of rail travel declined to 12.4%, from 13.5% in 2023.
Overall, the modal structure confirms that the shift towards lower-impact modes of transport remains limited.
IMPACT OF TOURISM ON WASTE GENERATION
Data aggiornamento scheda:
The indicator measures the pressure exerted by tourist flows on Italy’s waste management system and is used as a proxy for monitoring Goal 12 of the 2030 Agenda, specifically SDG indicator 12.b.1.
The expanded methodology provides a more comprehensive and realistic estimate of the equivalent tourist population. In addition to officially recorded nights spent in tourist accommodation establishments, it includes nights spent in free accommodation—such as second homes and the homes of relatives or friends—as well as same-day visits.
In 2024, the indicator reached 16.2 kg per equivalent inhabitant, an increase of approximately 0.5 kg compared with 2023 and more than 5 kg above the value calculated using the “conventional” equivalent population, which amounted to 10.8 kg per equivalent inhabitant.
Second homes remained the main component accounting for this difference, adding 4.3 kg, followed by same-day visits, which added 1.2 kg. The result confirms the increasing pressure of tourism on municipal cleansing and waste management services, particularly in highly seasonal destinations, and strengthens the need for waste prevention and collection policies tailored to emerging patterns of tourism use.
TOURISM GHG INTENSITY
Data aggiornamento scheda:
During the pandemic, particularly in 2020, the Italian tourism sector experienced a sharp contraction in economic activity, measured in terms of value added, as a result of travel restrictions and reduced demand. In this context, greenhouse gas emissions attributable to the tourism ecosystem did not decrease in the same proportion as economic output. Some emission sources, such as the maintenance of tourism infrastructure and indirect emissions associated with the sector, remained relatively stable, resulting in an increase in emission intensity, expressed as tonnes of CO₂ equivalent per million euros. The indicator rose from 60.51 in 2019 to 84.02 in 2020.
From 2021 onwards, and particularly during 2022–2023, the recovery in tourism activity and an improvement in overall efficiency led to a marked and progressive decline in emission intensity, which fell to 45.48 in 2022 and 38.35 in 2023.
This improvement brought Italy not only below its pre-pandemic level but also below the EU27 average of 50.36 in 2023, indicating significant progress in the relative climate sustainability of the sector, although further improvement remains possible compared with the best-performing countries.
FARMHOUSES
Data aggiornamento scheda:
The indicator monitors the spread of agritourism farms, a form of tourism integrated into the local area that helps reduce the impact of infrastructure on biodiversity and the landscape.
Between 2003 and 2024, the sector grew by 102%, increasing from approximately 13,000 to more than 26,000 agritourism farms. The number of establishments offering accommodation increased by 99%. Agritourism farms offering “green activities”, particularly nature observation activities, also recorded significant growth.
ROAD TRANSPORT EMISSIONS FOR TOURIST PURPOSES
Data aggiornamento scheda:
Tourism continues to be strategic for the Italian economy, but its attractiveness depends on a healthy environment. The indicator quantifies the air emissions generated by tourist trips made by road.
In 2024, passenger cars remained the dominant source, accounting for 95.6% of CO emissions, 97.3% of VOC emissions, 88.8% of NOx emissions, 85.4% of PM2.5 emissions and 93.4% of CO₂ emissions. Recreational vehicles—motorhomes, caravans and vans—made a particularly significant contribution to PM2.5 emissions (12.7%) and NOx emissions (9.4%).
Following the sharp decline recorded in 2023, national emissions decreased further in 2024, although at a slower rate, with reductions ranging from 3.6% to 6.7% depending on the pollutant. Emission levels therefore remained below those recorded in 2019.
AIR TRAVEL EMISSION INTENSITY
Data aggiornamento scheda:
The indicator analyzes the average CO₂ emissions per passenger in air travel, as proxy of the climate impact of air transport associated with tourism. It is calculated as the ratio between the total CO₂ emissions of passenger flights and the number of passengers transported. After the increase recorded in the two-year pandemic period, due to the strong reduction in passengers compared to operational flights, the indicator shows a progressive improvement: in Italy it goes from 87.67 kg CO₂/passenger in 2019 to 77 in 2023, reaching 81.12 kg CO₂/passenger in 2024, rising in the last available year. In the European comparison, Italy is placed at values lower than the EU27 average (94.80 in 2024), but still distant from the best performances observed in some countries (values around 57 kg CO₂/passenger), signaling margins for further decarbonisation actions in the sector.
BLUE FLAG FOR BEACHES AND TOURIST LANDINGS
Data aggiornamento scheda:
The Blue Flag is confirmed as one of the most prestigious international environmental awards for beaches and tourist marinas. In 2025, Italy further consolidates its position among the leading nations in terms of the number of certified locations, reaching 487 Blue Flags for beaches and 84 for tourist marinas. The overall increase compared to 2024 reflects a continuous commitment to the sustainability of coastal and lakeside destinations, as well as a steady improvement in water quality and environmental management of tourist areas.
ELECTRICITY CONSUMPTION IN THE TOURIST SECTOR
Data aggiornamento scheda:
The indicator illustrates electricity consumption in the tourism sector, identified by the ATECO branch “Accommodation and Food Service Activities”. In 2024, electricity consumption in the sector amounts to 89,987 GWh, an increase compared to 2023 (87,565 GWh). The trend confirms the recovery in consumption following the pandemic phase. Considering only accommodation activities, consumption shows differentiated dynamics over time and across space, while within the “accommodation” subcategory the contribution of hotels and similar establishments continues to prevail, albeit within a context of gradual diversification of accommodation types.
ENVIRONMENTAL PRESSURE OF MAJOR TOURISM INFRASTRUCTURES: MARINAS
Data aggiornamento scheda:
Coastal tourism infrastructures, and in particular marinas, exert significant pressures on marine and coastal ecosystems. The indicator assesses the potential environmental pressure associated with marinas through the total number of berths and their density per kilometre of coastline at the regional level. Based on 2023 data, the total number of berths in Italy amounts to 161,778, with a national average density of 19.6 berths per km of coastline, showing an increase compared to 2022 and a strongly uneven territorial distribution.
DEPENDENCE ON THE ORIGINS OF THE DISTANCE
Data aggiornamento scheda:
The indicator measures the dependence of Italian tourism on international markets, particularly those farther away, by assessing the environmental impact associated with long-distance transportation. In 2024, total stays reach 466.2 million, with 14.8% coming from countries located more than 2,000 km away. This share, which has grown compared to 2023, confirms the recovery of international flows and a return to pre-pandemic levels. However, it also represents a critical issue for the environmental sustainability of the sector, as long-haul air travel significantly contributes to CO2 emissions.
TOURISM INFRASTRUCTURES
Data aggiornamento scheda:
The indicator allows for quantifying the accommodation capacity of hotels, complementary facilities, and bed and breakfasts in the area, as well as estimating the utilization rate of hotel establishments. In 2024, the net hotel utilization index reaches 52.8%, confirming its growth and setting a new record high in the historical series considered.
TOURISM INTENSITY
Data aggiornamento scheda:
The indicator monitors the impact of tourism on the territory in terms of both volume (arrivals) and the burden placed on the area (overnight stays). It highlights how some regions and autonomous provinces experience high "arrivals per inhabitant" and "overnight stays per inhabitant" ratios, such as Valle d'Aosta (10.9 and 30.0) and the Autonomous Province of Bolzano (15.7 and 67.2), compared to the national average of 2.3 and 7.6, respectively. In 2023, all values increased and surpassed those recorded in 2019.
IMPACT OF TOURISM ON POTABLE WATER CONSUMPTION
Data aggiornamento scheda:
The indicator aims to provide a quantitative estimate of the contribution of tourists to daily potable water consumption.
In 2022, at the national level, the recorded tourist movement consumed 4 liters of potable water per capita equivalent per day.
Between 2015 and 2018-2020, a growth in consumption was recorded, increasing from 3.7 to 4 liters per capita equivalent, followed by a sharp drop in 2020, an anomaly attributed to the COVID-19 pandemic, which halted global travel.
TOURISM IN PARKS
Data aggiornamento scheda:
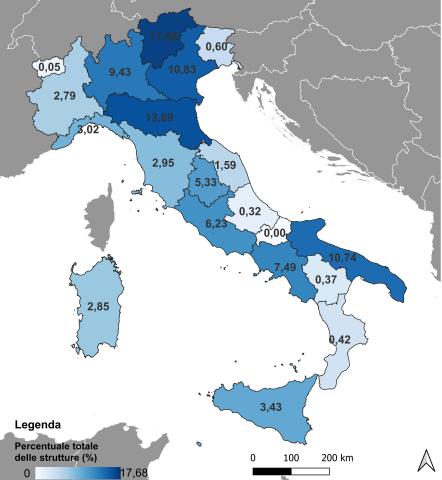
Italian parks host approximately 20.2% of all accommodation establishments and 24.5% of total bed capacity within their territories.
This indicator analyzes accommodation supply (number of establishments and beds) and tourism flows (arrivals and overnight stays) in national and regional parks, also highlighting the pressure exerted on these areas.
The European Charter for Sustainable Tourism in Protected Areas (ECST) has been awarded to 80% of national parks and around 11.2% of regional parks.
ENVIRONMENTAL PRESSURE OF MAJOR TOURISM INFRASTRUCTURES: GOLF COURSES
Data aggiornamento scheda:
Among the infrastructures for tourism activities, golf courses have a strong impact on the surrounding environment. The consumption of resources (e.g., water extraction, land occupation, etc.) and the pollution produced, for example, by the use of pesticides, are the main concerns. In response, the Italian golf movement is increasingly directing its development toward an environmentally friendly approach through certifications (GEO) or environmental recognitions. In 2022, the total number of golf courses was 367.