Giovanni Finocchiaro, Silvia Iaccarino, Francesca Palomba
Tourism continues to be strategic for the Italian economy, but its attractiveness depends on a healthy environment. The indicator quantifies the air emissions generated by tourist trips made by road.
In 2024, passenger cars remained the dominant source, accounting for 95.6% of CO emissions, 97.3% of VOC emissions, 88.8% of NOx emissions, 85.4% of PM2.5 emissions and 93.4% of CO₂ emissions. Recreational vehicles—motorhomes, caravans and vans—made a particularly significant contribution to PM2.5 emissions (12.7%) and NOx emissions (9.4%).
Following the sharp decline recorded in 2023, national emissions decreased further in 2024, although at a slower rate, with reductions ranging from 3.6% to 6.7% depending on the pollutant. Emission levels therefore remained below those recorded in 2019.
The indicator provides an estimate of emissions produced by tourist travel in Italy using road transport, in terms of major atmospheric pollutants. Although the phenomenon is underestimated, as the mileage considered is based only on the distance between the departure and destination cities, excluding local movements during the stay or stopovers in itinerant trips, this analysis aims to fill a significant knowledge gap in the tourism-environment relationship. The indicator integrates environmental monitoring data (National Air Emissions Inventory) with statistical data on tourism demand (ISTAT’s "Trips and Holidays" survey). Thus, it represents a new analytical approach that combines official sources to enhance information on tourism-related emissions.
To estimate emissions generated by tourist travel in Italy using road transport, focusing on major atmospheric pollutants.
The indicator has no specific regulatory references, but it helps address knowledge gaps in the tourism-environment relationship. It aligns with the Glasgow Declaration on Climate Action in Tourism, presented at COP26 in November 2021.
- European Parliament. Research for Tran Committee – From responsible best practices to sustainable tourism development. 2016 edition; ISBN: 978-92-823-8800-6. Available online: https://www. europarl. europa. eu/RegData/etudes/STUD/2015/573421/IPOL_STU(2015)573421_EN. pdf
- ETC/ULS. Tourism and the environment Towards a reporting mechanism in Europe. Report 01/2018. Available online: https://www. eionet. europa. eu/etcs/etc-uls/products/etc-uls-report-01-2018-tourism-and-the-environment-towards-a-reporting-mechanism-in-europe
- Di Torrice, M.; Sabato, M.; Dattilo, B.; et al. The new survey on tourism demand. Istat, Rome, Italy, 2018; ISBN 978-88-458-1964-3. Available online: https://www. istat. it/it/archivio/222043
- Regulation (EU) No 692/2011 of the European Parliament and of the Council of 6 July 2011 concerning European statistics on tourism and repealing Council Directive 95/57/EC. Available online: https://eur-lex. europa. eu/LexUriServ/LexUriServ. do? uri=OJ: L:2011:192:0017:0032: EN: PDF
- UNWTO, 2010. International Recommendations on tourism statistics 2008 (IRTS 2008), ST/ESA/STAT/SER. M/83/Rev.1, Madrid and New York. Available online: https://unstats. un. org/unsd/publication/Seriesm/SeriesM_83rev1e. pdf
- Eurostat, Methodological manual for tourism statistics – Version 3.1., 2014 edition. ISBN: 978-92-79-44558-3, (DOI): 10.2785/892233 2015. Available online: http://ec. europa. eu/eurostat/web/products-manuals-and-guidelines/-/KS-GQ-14-013.
- Di Torrice, M.; et al. Travel and Holiday Survey, Methodological aspects of the survey. Available online: https://www. istat. it/it/archivio/178695
- Deville, J. C.; Sarndal, C. E. Calibration Estimators in Survey Sampling. J. Am. Stat. Assoc. 1992, 87, 376-382, doi:10.2307/2290268.
- Saturday, M.; Dattilo, B.; Di Torrice, M. Destination Italy: tourism and territorial competitiveness. A regional analysis of residents' tourism demand. XL Annual Scientific Conference of A. I. S. Re. (Italian Association of Regional Sciences), L'Aquila, Italy, 16-18 September 2019. Available online: https://www. aisre. it/images/aisre/2019_papers/Sabato-16-16-Sabato-Mariangela. pdf
- United Nations. Transforming our world: the 2030 Agenda for Sustainable Development. Available online: https://epale. ec. europa. eu/sites/default/files/21252030_agenda_for_sustainable_development_web. pdf - Istat. The SDGs Report. Available online: https://www. istat. it/en/well-being-and-sustainability/sustainable-development-goals/sdgs-report.
- Istat. Methodological Note" Travel and Holiday Survey, Istat, 2015 and following; Available online: https://www. istat. it/it/archivio/178695
- Betta, L.; Dattilo, B.; di Bella, E.; Finocchiaro, G.; Iaccarino, S. Tourism and Road Transport Emissions in Italy. Sustainability 2021, 13, 12712. Https://doi. org/10.3390/su132212712 - World Tourism Organization (2022), Measuring the Sustainability of Tourism – Learning from Pilots, UNWTO, Madrid, DOI: https://doi. org/10.18111/9789284424061.
- Scott, D., Hall, C. M., & Gössling, S. (2020). Pandemics, tourism and global change: A rapid assessment of COVID-19. Journal of Sustainable Tourism, 29(1), 1-20. DOI: 10.1080/09669582.2020.1758708
The indicator underestimates emissions because it does not account for either local travel undertaken after reaching the destination or detours made during multi-stop trips.
Despite the introduction in 2023 of variables relating to engine displacement and propulsion type, the retrospective recalibration of the 2017–2022 data continues to be based on models allocating tourist mileage according to the composition of the vehicle fleet. This introduces additional uncertainty and a slight discontinuity in the time series.
To refine and therefore make the territorial attributions of pollutants more precise, a more laborious breakdown of the journey into regional sections to which the polluting emissions of the route between the origin and destination of the journey is hypothesized as a future development.
ISPRA (Italian Institute for Environmental Protection and Research)
Istat (National Statistical Institute )
Istat - "Travel and Holidays" survey, various years
ISPRA - "Average road emission factors" https://fetransp. isprambiente. it/#/
ISPRA. Emissions Historical Series – Road transport data 1990-2020. Available online: http://www. http://emissioni. sina. isprambiente. it/serie-storiche-emissioni/
National, Regional
2017-2024
The indicator uses the mileage travelled on tourist journeys by road transport modes, as recorded by Istat’s Trips and Holidays survey, together with ISPRA’s average road transport emission factors. Both types of information require extensive data processing.
For methodological details, see:
Betta, L.; Dattilo, B.; di Bella, E.; Finocchiaro, G.; Iaccarino, S. Tourism and Road Transport Emissions in Italy. Sustainability 2021, 13, 12712. https://doi.org/10.3390/su132212712
Since 2023, the Istat survey has included two new questions concerning the engine displacement and propulsion type—petrol, diesel, hybrid, electric, etc.—of the car actually used for the journey.
In the previous survey years, from 2017 to 2022, this information was not available. Tourist mileage was therefore assumed to be distributed across vehicle categories in proportion to the composition of the vehicle fleet, based on data from the Italian Automobile Club (ACI).
The inclusion of the new variables removes this proportionality assumption and aligns vehicle classification with actual tourist travel behaviour, substantially improving the accuracy of the allocation of emissions.
The use of Istat data improves the analysis because, in the absence of journey-specific information, it was evident that vehicle choices for holidays did not accurately reflect the composition of the vehicle fleet. The analysis is now more accurate and more specifically representative of tourism-related mobility.
Overall, the adoption of the engine displacement and propulsion-type variables introduces a slight structural break in the time series but significantly improves the indicator.
As shown by the total emission volumes in Table 1 and their distribution by transport mode in Table 2, the emissions profile of tourist road travel continued to improve in 2024, although the reduction was not uniform across pollutants.
Carbon monoxide emissions decreased from 6,625 to 6,249 tonnes, a reduction of 6%. VOC emissions declined from 2,168 to 2,079 tonnes, down 4%; nitrogen oxide emissions fell from 2,250 to 2,100 tonnes, down 7%; fine particulate matter, PM2.5, decreased from 125 to 118 tonnes, down 6%; and CO₂ emissions declined from 822,214 to 792,238 tonnes, down 4%.
In terms of transport modes, passenger cars remained clearly predominant. In 2024, they generated 95.6% of CO emissions, 97.3% of VOC emissions, 88.8% of NOx emissions, 85.4% of PM2.5 emissions and 93.4% of CO₂ emissions.
Compared with 2023, the share of NOx emissions generated by passenger cars decreased by slightly more than one percentage point, while their shares of the other pollutants remained broadly stable. Recreational vehicles—motorhomes, caravans and vans—slightly increased their contribution to PM2.5 emissions, reaching 12.7%, and to NOx emissions, reaching 9.4%. This confirms the environmental impact of touring and multi-stop holidays. Motorcycles, scooters and other vehicle categories continued to make only a marginal contribution.
Overall, the environmental status can be assessed as moderate. The improving trend is evident for all pollutants, but the reductions remain limited, the share generated by passenger cars still exceeds 85%, and territorial disparities persist.
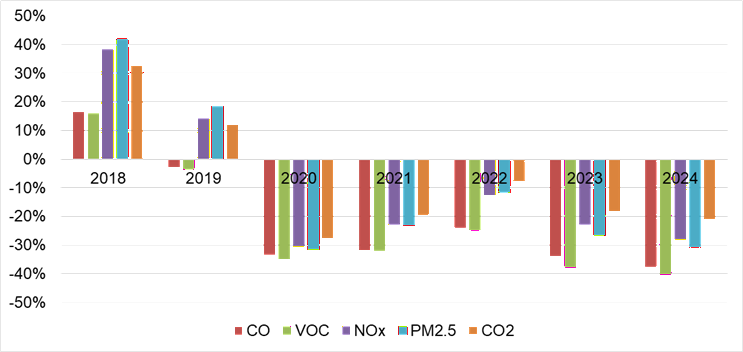
Between 2017 and 2024, the indicator followed a four-stage cycle: pre-pandemic growth from 2017 to 2019; the sharp decline caused by the 2020 lockdowns; the rebound in 2021–2022, recorded both in national totals in Table 1 and in the modal shares shown in Table 2; and, finally, two consecutive decreases in 2023 and 2024.
The most recent phase brought emission loads below their 2017 levels, with reductions of 38% for CO, 40% for VOCs, 28% for NOx, 31% for PM2.5 and 21% for CO₂, as shown in Table 1.
In terms of transport modes, the share of total NOx emissions generated by passenger cars decreased from 90.2% to 88.8% between 2023 and 2024. This reduction of approximately 1.4 percentage points corresponds to a slight increase in the contribution of recreational vehicles, as shown in Table 2. Although limited, this shift indicates the beginning of a diversification in transport patterns, supported by the renewal of the vehicle fleet.
In light of this evidence—the structural reduction in the main environmental pressures, pollutant levels below the 2017 baseline and initial signs of a modal rebalancing—the trend is assessed as positive, as it is moving in the desired direction from an environmental perspective.
Nevertheless, two issues require continued attention: the still moderate pace of improvement in 2024 and the persistent predominance of private cars. Targeted policies are therefore needed to consolidate and accelerate the improvement trajectory.
| Allegati |
|---|
Headline
Table 1: Estimated national emissions Data source
ISPRA |
Headline
Table 2: Emissions from travel in Italy by type of vehicle used (tons and percentage) Data source
ISPRA |
Headline
Table 3: Emissions generated by region of destination (2024) Data source
ISPRA |
Thumbnail
Headline
Figure 1: Percentage growth of each emission (CO, VOC, NOx, PM2,5, CO2) , taking 2017 as the base year Data source
ISPRA |
Thumbnail
Headline
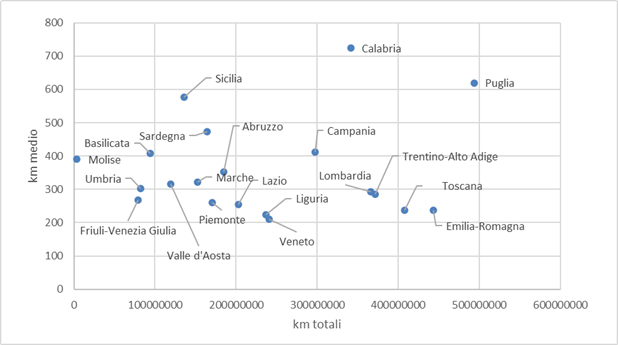
Figure 2: Kilometres travelled and average distance to reach the trip destination regions (2024) Data source
ISPRA processing of Istat data |
The geographical analysis reveals substantial territorial disparities. In 2024, Apulia, Emilia-Romagna, Tuscany, Trentino-Alto Adige and Lombardy remained the main regions in terms of CO₂ emissions, as shown in Table 3. This reflects a combination of strong tourist attractiveness and the longer distances travelled to reach these destinations.
At the opposite end of the distribution, Molise, Umbria, Friuli-Venezia Giulia, Basilicata and the Aosta Valley continued to record the lowest emission levels.
The 2023–2024 winter season mitigated the decline in the Alpine regions, while seaside destinations recorded marked reductions at the end of the summer season.
Figure 3 shows that CO₂ emission levels remained above their 2017 values in nine regions, indicating that the transition towards low-emission mobility is progressing at different rates across the country.