Panel 1
Giovanni Finocchiaro, Silvia Iaccarino
The indicator analyses the average CO₂ emissions per air passenger, providing a measure of the environmental impact of air transport within the tourism sector. It is based on the division of total CO₂ emissions from passenger flights by the number of passengers transported. In 2023, the emission value decreases to 77 kg CO₂ per passenger, confirming an improvement in the energy efficiency of the Italian aviation sector. However, despite this progress, Italy remains above the levels of some more virtuous European countries, indicating the need for additional strategies for the decarbonisation of the sector.
This indicator is part of the "green" pillar, which addresses environmental impacts in the European Union Tourism Dashboard. It measures the average CO₂ emissions per passenger for air travel and its relevance in assessing tourism’s impact on climate change. The calculation is based on the total amount of CO₂ emitted by all passenger flights divided by the number of passengers in a given year.
Emission amounts and passenger numbers are associated with the departure airport. Therefore, the indicator takes into account both residents departing for tourist destinations and tourists returning home. Lower values indicate lower emissions per air passenger. Higher national values are usually linked to long-haul flights.
To contribute to monitoring the impact of tourism on climate change.
The indicator has no reference regulations or related targets.
Panel 2
Batista, Filipe; Ricardo Barranco (2022): UDP - Air travel emission intensity. European Commission, Joint Research Centre (JRC) [Dataset] PID: http://data.europa.eu/89h/a9878ba6-6826-47af-9ef4-6664587f1250
Air travel emission intensity - Green pillar - National | Indicator Map view (europa.eu)
https://tourism-dashboard.ec.europa.eu/map-view?lng=en&ctx=tourism&ts=TOURISM&is=TOURISM&tl=0&clc=environmental-impact&i=270&db=739&it=metadata&date=2022&cl=tourism&cwt=bar-chart&pil=indicator-level
Data quality assessment
EUROSTAT (Statistical Office of the European Communities)
National
2019-2023
Indicator assessment
The indicator is obtained by dividing the amount of CO₂ emissions from departing aircraft by the number of departing passengers in a given year. CO₂ emissions from cargo-only flights are excluded. Therefore, the indicator considers, for each airport, both residents traveling to a tourist destination and tourists returning home. Lower values indicate lower emissions per air passenger. Higher national values are typically associated with long-haul flights.
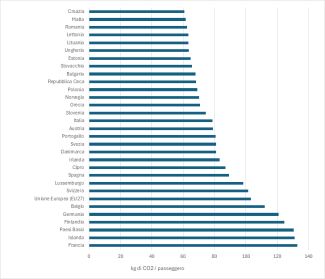
In 2023, Italy continued to improve the emissions intensity of air travel, with the value reaching 77 kg CO₂ per passenger. This result represents a step in the right direction from an environmental perspective, although it is necessary to accelerate decarbonisation policies in order to approach lower values, such as those recorded in Latvia (43.39 kg CO₂/passenger) and Croatia (56.67 kg CO₂/passenger).
From 2019 to 2023, the trend in air emissions intensity has undergone significant variations. After the sharp increase observed during the pandemic in 2020–2021, due to a reduction in passengers relative to the number of operating flights, a progressive decrease was recorded in the following two years. The environmental assessment of the trend is partially positive, highlighting the need for further measures to accelerate emission reductions.
Data
Table 1: Distribution of air travel emission intensities of European countries
ISPRA elaboration based on Eurocontrol and Eurostat data

In comparison with other European countries, Italy ranks in the intermediate range for emission intensity per passenger in air travel. With 77 kg CO₂/passenger in 2023, the Italian value is below the EU average (91.28 kg CO₂/passenger), but still far from the best performances recorded in countries such as Latvia and Croatia (Table 1 – Figure 1). This suggests the need for more decisive policies to promote sustainable fuels, improve fleet efficiency, and optimise flight routes. Italy has already embarked on a path to reduce emissions but will need to accelerate the adoption of innovative solutions to ensure a more effective decarbonisation of air transport.