Giovanni Finocchiaro, Silvia Iaccarino
The indicator allows for quantifying the accommodation capacity of hotels, complementary facilities, and bed and breakfasts in the area, as well as estimating the utilization rate of hotel establishments. In 2024, the net hotel utilization index reaches 52.8%, confirming its growth and setting a new record high in the historical series considered.
The indicator provides key information regarding tourism infrastructure, examining accommodation capacity in terms of number of establishments and beds, as well as density per km².
Accommodation facilities are classified into:
- Hotels, including hotels of all categories and tourist residences.
- Complementary facilities, including campsites and tourist villages, rental accommodations managed as businesses (holiday homes and apartments, guesthouses, accommodations in restaurants, furnished units for tourist use, residences, inns), agritourism lodgings (rural buildings offering accommodations to tourists by individual or associated agricultural entrepreneurs), and other facilities (youth hostels, holiday homes, mountain refuges, fixed bivouacs, hiking lodges, alpine shelters, high-altitude social refuges, and tourist guesthouses).
- Bed and breakfasts, which offer lodging and breakfast services for a limited number of rooms and/or beds.
The utilization rate of a facility during a given period, compared to its maximum potential, is estimated using the net utilization index, defined as the ratio between the number of overnight stays (P) recorded in hotels and the number of bed-days of actual operation (Ge), excluding closures due to seasonality, renovations, or temporary shutdowns.
The formula used is: I=GeP×100=ge×LP×100
where:
- Ge represents the number of bed-days of actual operation.
- ge represents the number of days the facility was open.
- L represents the number of available beds.
To quantify the accommodation capacity of hotels, complementary facilities, and bed and breakfasts, as well as their spatial distribution.
The indicator has no direct references with specific regulatory elements.
Istat, several years, tourism statistics
Census of the second houses
Istat (National Statistics Institute)
http: // data . istat. it/ (Services/ Tourism)
http: // demo . istat. it/
National, regional
1990-2024
The indicator is calculated using ratios, percentages, and variations. The net utilization index is given by the ratio between the number of overnight stays (P) recorded in hotels and the number of bed-days of actual operation (Ge). I=GeP×100=ge×LP×100
In 2024, tourist infrastructures continue to grow in terms of the total number of accommodation facilities (+15.6%). The increase is particularly evident in "rental accommodations" (+20.6%) and "other facilities" (+41.1%). Bed and breakfasts show a recovery compared to the previous year (+6.2%). The number of hotels registers an increase of 2.3%. In terms of bed capacity, the overall supply rises by 5.6%, with differentiated dynamics depending on the type of facility (Table 1).
The net hotel utilization rate reaches 52.8% (Table 5), marking further growth compared to 2023. This figure demonstrates an improvement in the efficiency of the accommodation system, with more intensive use of the facilities. This may bring advantages in terms of resource optimization and waste reduction but simultaneously requires careful management to avoid excessive pressure on local ecosystems. Overall, compared to the previous year, the state can be considered good from an environmental perspective, though constant monitoring is necessary in more sensitive areas.
From 2002 to 2024, Italy has experienced an overall growth in the number of beds per km², reaching 18.2 beds/km² at the national level. Regarding the number of establishments, the density remains stable for hotels (0.11 establishments/km²), while complementary accommodations continue to strengthen (0.65 establishments/km²), confirming recovery and consolidation after the pandemic (Table 3).
The receptivity index (Table 6), which measures the ability to host tourists relative to the resident population—essentially a metric to quantify the theoretical multiplication of the population during peak tourist periods—shows no significant variations at the national level between 2019 and 2024. However, evident territorial differences persist: some regions display values well above the average, indicating a strong potential for tourist pressure during specific times of the year. This emphasizes the need for local policies focused on sustainability and balanced management of tourist flows.
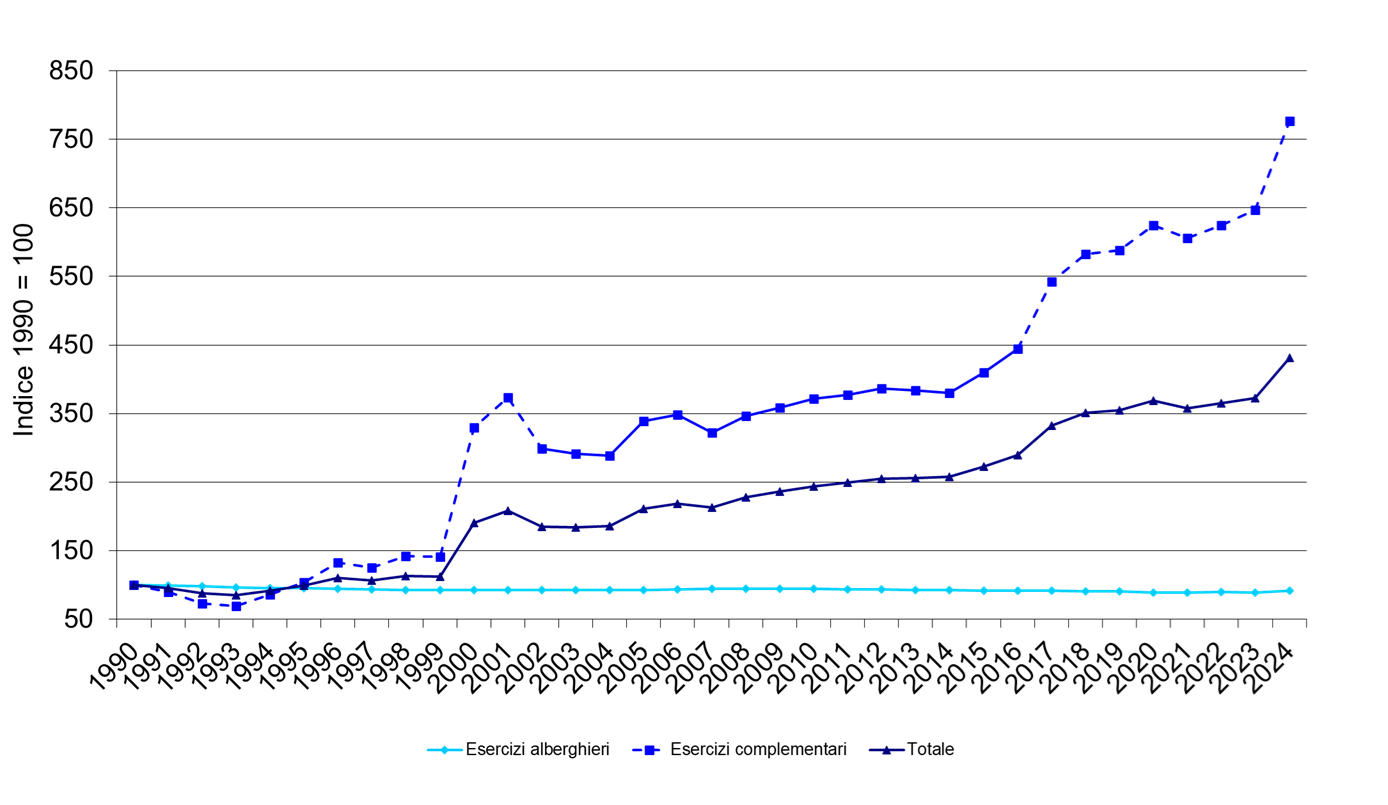
Overall, in the long term, the trend can be considered positive for hotel establishments, as the growth in beds outpaces the growth in the number of establishments. However, when considering total accommodation establishments, the trend remains negative.
| Allegati |
|---|
Headline
Table 1: Capacity of hotels, complementary establishments, and Bed and Breakfasts in Italy Data source
ISPRA elaboration on ISTAT data
Data legend
a. The entry “Rented accommodations registered in the REC” has been referred to as “Rented accommodations” since 2000, and includes all types of rented accommodations managed as businesses; |
Headline
Table 2: Capacity of accommodation establishments, by type of establishment and by region (2024) Data source
ISPRA elaboration on ISTAT data Data legend
a. The entry “Rented accommodations registered in the REC” has been referred to as “Rented accommodations” since 2000, and includes all types of rented accommodations managed as businesses; |
Headline
Table 3: Density of accommodation establishments Data source
ISPRA elaboration on ISTAT data
|
Headline
Table 4: Density of accommodation establishments by region and autonomous province (2024) Data source
ISPRA elaboration on ISTAT data |
Headline
Table 5: Net occupancy rate of hotels by region and autonomous province Data source
ISPRA elaboration on ISTAT data Data legend
a. LAZIO: Data for the municipality of Rome are replicated using the latest available year, January–December; |
Headline
Table 6: Regional accommodation index Data source
ISPRA elaboration on ISTAT data Data legend
*2024 provisional population data. |
Thumbnail

Headline
Figure 1: Change in the number of hotels and complementary establishments Data source
ISPRA elaboration on ISTAT data
Note
The dashed line for complementary establishments indicates the inclusion of Bed and Breakfasts in this category until 2001. |
Thumbnail
Headline
Figure 2: Change in the number of bed places in hotels and complementary establishments Data source
ISPRA elaboration on ISTAT data Data legend
The dashed line for complementary establishments indicates the exclusion of Bed and Breakfasts, which were included in this category until 2001. |
The totals reported in the tables may show slight differences due to rounding.
National accommodation capacity increases in 2024 compared to the previous year, both in terms of the number of establishments (15.6%) and bed spaces (5.6%) (Table 1).
The average density reaches 18.2 bed spaces/km² in 2024: hotel establishments stand at 0.11 per km² (equivalent to 7.56 beds per km²), while complementary establishments reach 0.65 per km² (10 beds per km²) (Table 3).
At the regional level, a situation similar to the previous year persists, with the Autonomous Province of Bolzano and Veneto continuing to hold the highest density values, respectively 35 bed spaces/km² and 43.2 bed spaces/km² (Table 4).
The net utilization index, after the sharp decline in 2020, continues its growth and reaches 52.8% in 2024. Some regions, such as Lazio, Abruzzo, and Sardinia, have recorded significant increases (compared to 2019), while others, including Molise, Veneto, and the Autonomous Province of Bolzano, show declining values (Table 5). Overall, the trend confirms the structural strengthening of tourism in Italy. However, it highlights the need to balance development and sustainability, especially in areas subject to higher tourism pressure, to ensure a balanced and sustainable management of the accommodation system.