DAYS WITH FREEZE
Data aggiornamento scheda:
The indicator describes the trend of intense cold weather in Italy, more precisely, it expresses the number of days with an absolute minimum air temperature less than or equal to 0°C. In 2025, a decrease of 15.4 days with frost was observed compared to the average value calculated in the thirty-year reference period (1991-2020).
ELECTRICITY PRODUCTION BY SOURCE
Data aggiornamento scheda:
This indicator considers gross electricity production in Italy broken down by source from 1990 to 2024. Total generation went from 216.6 TWh in 1990 to a peak of 314.1 TWh in 2007, before settling at 271 TWh in 2024. The energy mix has undergone a profound structural transformation: traditional thermoelectric power, while remaining the leading source with 152.1 TWh in 2024 (56.1% of the total), has reduced its weight compared to the past. At the same time, the combination of wind and photovoltaic rose from just 6 GWh in 1990 to 58.3 TWh in 2024 (21.5% of the total), joining hydroelectric production (54.8 TWh), geothermal production (5.7 TWh) and bioenergy (17.2 TWh). The contribution of all renewable sources (hydroelectric, geothermal, wind, photovoltaic and bioenergy), net of production from pumped storage and storage, was approximately 50%.
SUMMER DAYS
Data aggiornamento scheda:
The indicator describes the trend of intense heat events in Italy, more precisely, it expresses the number of days with maximum air temperatures above 25°C. In 2025, an increase of 8.4 summer days was observed compared to the average value calculated in the thirty-year reference period (1991-2020).
HYDROELECTRIC POWER PRODUCTION
Data aggiornamento scheda:
The indicator provides information on normalized gross hydroelectric energy production (in TWh) and gross efficient power (in GW) in Italy from 1931 to 2024, with the aim of analyzing their temporal trends and assessing any significant trends, including those related to climate change. Hydroelectric production, in fact, is an energy source strictly dependent on meteorological and climate variables, which has led, and will lead over time, to a reduction in water availability and greater difficulty in its management. Adding the effects of climate change to the impact of human use, future scenarios generally estimate a decline in potential hydroelectric production. Installed capacity has grown steadily from 3.7 GW in 1931 to 23.6 GW in 2024. Normalized hydroelectric production went from 11.8 TWh in 1935 to a peak of 52.7 TWh in 2014, before settling at between 43 and 47 TWh over the last decade, reaching 45.5 TWh in 2024.
TROPICAL NIGHTS
Data aggiornamento scheda:
The indicator describes the trend of intense heat events in Italy, specifically expressing the number of days with minimum air temperatures above 20°C. In 2025, an increase of 10.1 tropical nights was observed compared to the average value calculated in the thirty-year reference period (1991-2020).
GROSS ELECTRICITY PRODUCTION OF PLANTS FROM RENEWABLE SOURCES
Data aggiornamento scheda:
This indicator analyzes the evolution of electricity production from renewable sources in Italy from 1990 to 2024 (expressed in TWh), showing data by type of energy source. Total renewable production grew from 34.9 TWh in 1990 to 134.4 TWh in 2024, a nearly fourfold increase. The structure of renewable generation has radically transformed: while in 1990 the hydroelectric (31.6 TWh) and geothermal (3.2 TWh) components accounted for all green energy, in 2024 the contribution is highly diversified thanks to the contribution of photovoltaic (36 TWh), wind (22.3 TWh), bioenergy (17.2 TWh), and hydroelectric (53.1 TWh). In percentage terms, photovoltaic covers 27%, wind 17%, hydroelectric 40%, bioenergy 13%, and geothermal 4%.
ATMOSPHERIC EMISSION INTENSITY IN THE PAPER INDUSTRY
Data aggiornamento scheda:
In 2024, every million euros of added value in the Italian paper industry (€9.02 billion, 2020 prices) generated ≈ 420 t of CO₂, 3.20 kg of SOx, 0.41 t of NOx, 4.4 g of NMVOCs, and 0.04 t of PM10. Compared to 2023, only the intensity of CO2 (-2.1%) and SOx (-7.6%) decreased, while NOx, NMVOCs, and PM10 increased (all +8.3%). In the long-term comparison (1990-2024), two opposing stories emerge: SOx –99% (strong push towards the use of natural gas in the sector) and NMVOCs –99% (cessation of some production processes characterised by this type of emission), against CO₂ +20.4%, NOx +23.7% and PM10 +16.3%, which reflect the increase in the sector's energy needs.
HEAT WAVES
Data aggiornamento scheda:
The indicator describes the trend of intense heat events in Italy. A heat wave is an event lasting at least six consecutive days in which the maximum temperature is above the 90th percentile of the distribution of daily maximum temperatures in the same period of the year over a thirty-year climatological period. The indicator counts the number of days characterized by a heat wave, as defined, in a year. In 2025, an increase of 16.2 days of heat waves was observed compared to the average value calculated for the thirty-year reference period (1991-2020).
HOURLY PEAK ENERGY REQUIREMENT IN THE SUMMER MONTHS
Data aggiornamento scheda:
The indicator provides information on the variation in hourly peak electricity demand during the summer period (May-September) for cooling compared to peak demand for all other uses. The values show an increasing trend over the period analyzed, with different rates for the different months and particularly significant in June and July. In 2000, peak values ranged from 43.30 GW in May to 47.38 GW in July, while in 2024, maximum power absorbed reached 57.81 GW in July, confirming a structural growth in peak load driven by summer air conditioning. With the increase in average global temperatures, future scenarios predict a reduction in energy consumption for space heating and an increase for cooling: the overall effect on energy demand will depend on the trend of local and seasonal meteorological parameters as well as the structure of energy supply.
ATMOSPHERIC EMISSION INTENSITY IN THE CHEMICAL INDUSTRY
Data aggiornamento scheda:
In 2024, for every million euros of added value, the Italian chemical industry emitted 2,139 t of CO₂, compared to 0.6 t of SOx, 0.8 t of NOx, 0.3 t of NMVOCs, and 1.8 t of CO. Compared to 1990, SOx and NOx emission intensities have almost disappeared (-97.6% and -92.7%), while CO₂ emissions have decreased by 38%, highlighting how energy decarbonization continues to represent one of the main challenges for the sector. Over the past year, the indicator has decreased for almost all pollutants (CO₂ -16.8%, NOx -1.6%, NMVOC -7.2%, CO -28.4%) with the exception of SOx, whose intensity increased by 20% compared to 2023. Overall, the trend highlights a progressive reduction in emissions per unit of value added, in line with the economic growth of the sector. Calculated for the period 1990-2024 and updated annually with ISPRA and Istat data, the indicator offers an immediate view of the trend in the intensity of atmospheric emissions for the entire chemical sector, in line with the information communicated annually to the European Commission under the Community's greenhouse gas emissions monitoring mechanism.
CUMULATIVE PRECIPITATION
Data aggiornamento scheda:
The indicator describes the amount and distribution of precipitation in Italy. In 2025, cumulative annual precipitation in Italy was overall close to the 1991-2020 climatic average (+1%). The precipitation anomaly was negative in the South and Islands (-5%), positive in the North (+7%), and close to average in Central Italy.
SHARE OF ENERGY FROM RENEWABLE SOURCES IN FINAL CONSUMPTION
Data aggiornamento scheda:
The share of energy from renewable sources in gross final consumption in European Union countries over the twenty-year period considered grew in Italy, reaching 19.4% in 2024. This figure is still far from the 38.7% target to be reached by 2030. The country currently ranks below the EU27 average (which reached 25.2% in 2024) and significantly behind leading countries such as Sweden (62.8%), Finland (52.1%), and Denmark (46.5%). The target that the EU27 should reach is around 42.5%.
ATMOSPHERIC EMISSION INTENSITY IN THE NON-METALLIC MINERAL INDUSTRY
Data aggiornamento scheda:
In 2024, for every million euros of added value, the Italian non-metallic mineral products industry emitted 1,909 t of CO₂, compared to 1.8 t of SOx, 2.6 t of NOx, 1.08 t of NMVOCs, and 3.4 t of PM10. Compared to 1990, the emission intensity of all pollutants has decreased, albeit with significant differences. The most marked reduction concerns NOx, which decreased by 69%, while the reduction for other pollutants is more limited: SOx -59%, NMVOCs -23%, CO2 -33%, PM10 -25%. Over the past year, the indicator has improved only for SOx (-2.2%) and NOx (-2%), while for all other substances the emission intensity has increased slightly (CO₂ +2%, NMVOC +3%, PM10 +3.5%).
OVATE OSTREOPSIS CONCENTRATION
Data aggiornamento scheda:
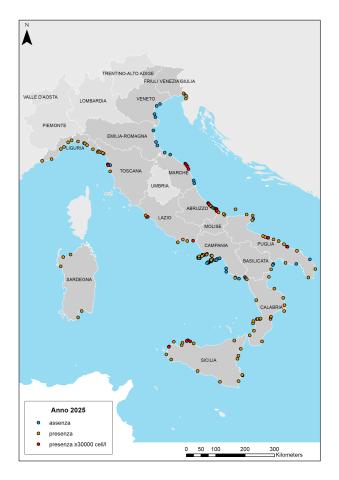
Ostreopsis cf. ovata is a potentially toxic benthic microalgae, present today in most of the Italian coastal regions with blooms that can give rise to phenomena of human intoxication and toxic effects on benthic marine organisms (states of suffering or mortality). The continuous expansion along the Italian coasts of Ostreopsis cf. ovata, its blooms and the health, environmental and economic problems associated with it, has led to the establishment of a monitoring program for the surveillance of microalgae since 2007. This activity is carried out annually in the summer season by the Regional Environment Agencies (ARPA). The data so far provided by ARPA, collected and processed by ISPRA, have clarified the distribution and trend of flowering at national and regional level. To date, microalgae has been found at least once in the monitoring campaigns so far carried out in 13 out of 15 coastal regions. In 2025, the Ostreopsis cf. ovata is present in 13 coastal regions or in 152/202 stations (75%), while it is absent in all samples taken along the coasts of Emilia-Romagna and Veneto.
QUANTITY OF WASTE FROM ECONOMIC ACTIVITIES INCINERATED AND ENERGY RECOVERED, AND NUMBER OF INCINERATION PLANTS
Data aggiornamento scheda:
In 2024, approximately 1.1 million tonnes of Waste from Economic Activities were sent for incineration, of which almost 640 thousand tonnes (59.1% of the total) were non-hazardous and over 443 thousand tonnes (40.9%) were hazardous. Overall, 78 operational incineration plants treated this waste, of which 43 were located in Northern Italy, 8 in Central Italy and 27 in Southern Italy. Consistent with the geographical distribution of incineration capacity, the largest share was treated in plants located in Northern Italy (82.4% of the total, corresponding to 892 thousand tonnes), followed by Southern Italy with 14.4% (156 thousand tonnes) and Central Italy with 3.2% (almost 35 thousand tonnes).
AVERAGE TEMPERATURE
Data aggiornamento scheda:
The indicator describes the trend of average temperatures in Italy. The increase in average temperatures recorded in Italy over the last thirty years is often greater than the global average on land. In 2025, the anomaly, compared to the 1991-2020 climatological average, in the average temperature in Italy (+1.03 °C) was greater than the global average on land (+0.85 °C). In Italy, 2025 was the fourth warmest year in the entire annual series since 1961. Since 2000, anomalies compared to the 1991-2020 climatological baseline have always been positive, with the exception of four years (2004, 2005, 2010, and 2013).
RATIO BETWEEN FINAL ENERGY CONSUMPTION AND TOTAL ENERGY CONSUMPTION
Data aggiornamento scheda:
The ratio of final energy consumption to gross domestic energy consumption measures the overall efficiency of energy conversion from primary sources. The difference between these two measures corresponds to losses in conversion processes (such as electricity generation and oil refining), internal consumption by electricity generation plants, and losses in distribution. The percentage rate highlights the share of energy reaching the end user compared to the total energy fed into the system. This ratio for Italy stands at 81.3% in 2024, with a total energy volume of 113.7 Mtoe. This percentage value is consistently above the European Union (EU27) average, which in 2024 recorded a ratio of 74.0% out of a total of 939.3 Mtoe.
ATMOSPHERIC EMISSION INTENSITY IN THE METALLURGICAL INDUSTRY
Data aggiornamento scheda:
In 2024, for every million euros of added value, the Italian metallurgical industry, which includes the steel and non-ferrous metals sectors, emitted 653.4 t of CO₂, compared to 0.8 t of SOx, 1.5 t of NOx, 1.2 t of NMVOCs, and 13.5 t of CO. Compared to 1990, emission intensities show a marked reduction for all pollutants: SOx emissions have almost disappeared (-93.2%), CO emissions have decreased by 80.5%, NOx by 72.3%, CO2 by 73.6%, while the reduction in NMVOCs is more limited (-41.3%). In 2024, compared to 2023, the indicator improves, confirming the decrease for all pollutants (CO₂ - 14.6%, SOx -10.6%, NOx -8.6%, NMVOC -3.7%, CO -16.1%).
HOT DAYS
Data aggiornamento scheda:
The indicator describes the trend of intense heat events in Italy, more precisely, it expresses the number of days with maximum air temperatures above 35°C. In 2025, an increase of 7.0 torrid days was observed compared to the average value calculated in the thirty-year reference period (1991-2020).
FLOW
Data aggiornamento scheda:
The indicator provides an assessment of the trend of water volumes measured in bed sections of some of the main Italian waterways compared to the previous year and decade. For 2025 it was possible to represent the flow data for 6 closing sections of as many waterways of national importance (Po, Arno, Adige, Bacchiglione, Serchio and Tiber). In 2025, the annual volumes that have flown into the measurement sections, have significant increases compared to the previous decade, with increases of between 12% and 40%, with the exception of the sections on Adige for which it was not possible to evaluate the annual volumes due to the unavailability of the flow data in the months from June to September 2025 and the Tiber for which there was a decrease of just under 20%.
QUANTITY OF WASTE FROM ECONOMIC ACTIVITIES USED AS AN ENERGY SOURCE IN PRODUCTION PLANTS
Data aggiornamento scheda:
The indicator measures the quantity of Waste from Economic Activities co-incinerated in production plants across the country, totally or partially replacing traditional fuels. In 2024, approximately 1.8 million tons of Waste from Economic Activities were recovered in co-incineration plants. Compared to 2023, the quantities recovered showed a decrease of almost 68,000 tons (-3.7%). With reference to the macro-geographical areas, the data show that the majority of special waste is recovered in the North (77.1% of the total), followed by Central Italy, with 11.6%, and the South with 11.3%.
ELECTRICITY PRODUCTION FROM COGENERATION PLANTS
Data aggiornamento scheda:
In 1997, gross electricity production was clearly dominated by conventional power-only plants (158.2 TWh out of a total of 200.2 TWh), with cogeneration accounting for 42 TWh (21%). In 2024, conventional electricity production was 60.2 TWh, while cogeneration accounted for 91.2 GWh (60.2%) out of a total of 151.4 TWh.
AIR TEMPERATURE
Data aggiornamento scheda:
The indicator provides a representation of the trend of the average monthly temperatures recorded in the provincial capital city/region during 2025, compared with that of the average monthly temperatures calculated for the same locations on the thirty-year period 1961-1990. During 2025 there was a general increase in average monthly temperatures compared to the reference period, with exceedances of the reference values on average for 11 months and in particular in the winter months. It is mainly the cities of the North where temperature increases take on significant values in particular in January, February and December. It should be noted that in the summer months the increases in temperature values, in most of the capitals, were on average lower than in the remaining months of the year.
GREENHOUSE GAS EMISSIONS IN THE ETS and ESR SECTORS
Data aggiornamento scheda:
The indicator consists of the emission quotas generated by plants subject to the quota trading system (EU emissions trading, EU ETS), established with Directive 2003/87/EC, and the emissions of all sectors not covered by the ETS system, i. e. Small-medium industry, transport, civil, agriculture and waste, according to Decision 406/2009/EC (Effort Sharing Decision, ESD) until 2020 and according to the Effort Regulation Sharing (ESR 2018/842) from 2021. Emissions from non-ETS sectors in 2020 were below the required target of 37 MtCO2eq. In 2021 and 2022 ESR emissions are in line with what is required by the annual target, while from 2023 they are above the target, by 0.6 MtCO 2 eq in 2023 and 9.6 MtCO 2 eq in 2024.
FINAL AND TOTAL ENERGY CONSUMPTION BY ECONOMIC SECTOR
Data aggiornamento scheda:
The indicator measures the energy consumed by end users and the total energy consumed by the country. Since 1990, there has been an increasing trend in energy available for final consumption, with a peak reached in 2005 of 139 Mtoe. Subsequently, a reversal of the trend was noted, reaching a minimum reached in 2014 (114 Mtoe). Until 2018, a recovery in final consumption was observed, followed by a decline in 2019 and a sudden reduction in 2020 due to the lockdown of economic activities to contain the spread of the SARS-CoV-2 pandemic, followed by a recovery in consumption in 2021, and then a decline in the following two years. In 2024, the energy available for final consumption, accounted for according to the methodology adopted by Eurostat, is equal to 109.3 Mtoe, +0.4% compared to 2023.
RUNOFF INDEX
Data aggiornamento scheda:
The indicator provides on an annual basis the evaluation, expressed as a percentage, of the relationship between the annual volume of runoff (surface runoff) and the annual volume of precipitation. This indicator aims to provide an evaluation of the quantity of water that is directly transformed into surface runoff compared to the total rainfall and to evaluate the long-term trend, also in relation to the possible impact due to climate change. The annual values of the indicator are also compared with the corresponding average value calculated over the entire period 1951–2025.
The analysis of the data for 2025 highlights an indicator value of 24.4%, remaining below the long-term historical average (25.2%). This finding marks a change in trend compared to 2024, the year in which an above-average value was recorded (26.2%). Despite this decline, the data still remains above the critical level of 2022, when the historical series had reached its second absolute minimum (18.5%).
AVERAGE SPECIFIC FUEL CONSUMPTION IN THE PRODUCTION OF ELECTRICITY FROM FOSSIL SOURCES
Data aggiornamento scheda:
The indicator measures how many MJ of fossil fuel are needed to produce one kWh of electricity, thus monitoring the efficiency of our energy system. From 1996 to 2024, specific consumption decreased by 21.6% (gross production) and 23.3% (net production). This is a clearly positive trend, which certifies how thermoelectric power plants have over time become capable of producing more energy while wasting fewer resources with a consequent increase in the efficiency of the electricity production of the thermoelectric park.
GREENHOUSE GAS EMISSIONS FROM TRANSPORT
Data aggiornamento scheda:
The indicator evaluates greenhouse gas emissions produced by the transport sector to verify the achievement of national and international objectives. In 2024 in Italy, transport is responsible for 31.2% of total greenhouse gas emissions. In the period 1990 - 2019, emissions from the transport sector (excluding international transport/bunkers) grew by 4.0%; in 2020 there was a marked reduction (-18.6% compared to 2019) fundamentally attributable to the mobility restriction measures due to the pandemic crisis, subsequently, from 2020 to 2021, there was an increase in emissions equal to 18.9%. From 2022 there will be a return to pre-pandemic levels. Overall, sector emissions from 1990 to 2024 increase by 10.9%. Various critical issues characterize the national transport system, which is far from the ambitious 2030 and 2050 objectives for reducing greenhouse gas emissions at a European level.
TOTAL ENERGY CONSUMPTION BY PRIMARY SOURCES
Data aggiornamento scheda:
The analysis of the composition of gross domestic energy consumption highlights a progressive reduction in the historical role of petroleum products. This decline corresponds to the growth of natural gas and renewable sources, which in 2024 reached shares of 36% and 21% respectively. Such diversification of the energy basket, driven by renewables, generates a positive impact on the security of supplies and on Italy's rate of energy self-sufficiency, historically among the lowest within the panorama of industrialized countries. Over the last 35 years, renewables have grown almost five times, going from 6.47Mtoe to 29.76Mtoe.
OVERALL GREENHOUSE GAS EMISSIONS AND FROM ENERGY PROCESSES
Data aggiornamento scheda:
The indicator concerns the emissions of greenhouse gases into the atmosphere that influence climate balances. In 2024, energy processes were at the origin of 95.4% of carbon dioxide emissions, 12.4% of methane emissions and 25.1% of nitrous oxide emissions, while they did not contribute to the emissions of fluorinated substances; overall, 81% of greenhouse gas emissions were of energy origin. Between 1995 and 2024, the trend in greenhouse gas emissions from energy processes initially paralleled that of energy consumption. However, from 2004 onwards there has been a progressive decoupling, which has become more pronounced in recent years. This turning point is not due to economic decline - given that GDP shows a general upward trend - but rather to a clear reduction in energy intensity, the replacement of fuels with a high carbon content with natural gas and the growing share of renewable sources in the electricity sector and industry. In 2024 there will be a reduction in emissions from energy processes of 3.5% compared to 2023.