GREENHOUSE GAS EMISSIONS (CO2, CH4, N2O, HFCs, PFCs, SF6): SECTORAL BREAKDOWN
Data aggiornamento scheda:The indicator represents the historical series of national greenhouse gas emissions from 1990 to 2022, broken down by sector. The data analysis shows a significant reduction in emissions in 2022 compared to 1990 (-21%), which can be explained by the economic recession that has slowed consumption in recent years, as well as by an increased use of renewable energy, leading to a reduction in CO2 emissions from the energy sector (-20% compared to 1990).
GREENHOUSE GAS EMISSIONS FROM AGRICULTURE
Data aggiornamento scheda:The indicator describes greenhouse gas (GHG) emissions (CH₄, N₂O, CO₂) released into the atmosphere by the agricultural sector, mainly due to livestock management and fertilizer use. It allows for the assessment of the sector’s contribution to total national emissions and the achievement of emission reduction targets.
Since 1990, greenhouse gas emissions from the agricultural sector have shown a decreasing trend; however, further mitigation measures will be necessary to meet the targets established under the United Nations Framework Convention on Climate Change (UNFCCC), the Kyoto Protocol, and relevant European directives.
Specifically, Italy’s target for 2030 under the Effort Sharing Regulation (Regulation (EU) 2023/857) is a -43.7% reduction in total GHG emissions from agriculture, buildings, transport, waste, and industrial installations not covered by the EU Emissions Trading System (EU-ETS), compared to 2005 levels.
In 2022, GHG emissions from agriculture accounted for a relatively small share (11.2%) of total emissions from sectors covered by the Effort Sharing Regulation, while emissions from agriculture decreased by 12.2% compared to 2005.
GREENHOUSE GAS EMISSIONS FROM ENERGY PROCESSES BY ECONOMIC SECTOR
Data aggiornamento scheda:The indicator evaluates the trend of greenhouse gas emissions from energy processes across different sectors, with the aim of reducing the impact of energy use on climate change. Greenhouse gas emissions from energy processes between 1990 and 2022 decreased by 20.7%, with varying trends across sectors. Emissions from the residential sector decreased by 7.5% compared to 1990, while emissions from transport increased by 6.7%. Over the same period, emissions from the energy industries sector decreased by 34.2%, and emissions from manufacturing industries showed a reduction of 40.6%. In 2021 and 2022, the end of the pandemic and the economic recovery led to an increase in greenhouse gas emissions from energy processes compared to 2020.
GREENHOUSE GAS EMISSIONS FROM TRANSPORT
Data aggiornamento scheda:The indicator assesses greenhouse gas emissions from the transport sector to monitor progress towards national and international targets. In 2022, transport accounted for 26.6% of total greenhouse gas emissions in Italy. Between 1990 and 2019, transport emissions (excluding international transport/bunkers) increased by 4.1%. In 2020, a sharp decline (-18.6% compared to 2019) was observed, mainly due to mobility restrictions linked to the COVID-19 pandemic. Subsequently, emissions increased by 18.9% from 2020 to 2021. In 2022, a further estimated increase of 6.7% brought emissions back to pre-pandemic levels. Overall, emissions from the transport sector rose by 7.4% from 1990 to 2022. The national transport system faces multiple critical issues and remains far from achieving the ambitious 2030 and 2050 EU climate targets.
GREENHOUSE GAS EMISSIONS IN ETS AND ESD SECTORS
Data aggiornamento scheda:The indicator includes the emission allowances generated by installations covered by the EU Emissions Trading System (EU ETS), established under Directive 2003/87/EC, and the greenhouse gas emissions from all sectors not included in the ETS scope—namely small- and medium-scale industry, transport, residential and commercial buildings, agriculture, and waste. These are regulated under Decision No. 406/2009/EC (Effort Sharing Decision, ESD) up to 2020, and by the Effort Sharing Regulation (EU) 2018/842 (ESR) from 2021 onward. While non-ETS sector emissions in 2020 remained below the target threshold of 37 MtCO₂eq, in 2022 they exceeded the allowable limit by 5.5 MtCO₂eq, indicating a deviation from the reduction trajectory required to meet ESR targets.
HEATWAVES AND MORTALITY
Data aggiornamento scheda:This indicator measures the health impact of heatwaves on the elderly population (aged 65 and over) across 27 Italian cities included in the National Heatwave Health Prevention and Warning Plan. The plan is implemented by the National Centre for Disease Prevention and Control (CCM) of the Ministry of Health and coordinated by the Epidemiology Department of the Lazio Regional Health Service (DEP Lazio). The cities are equipped with Heat Health Watch Warning (HHWW) systems to provide forecasts and alerts.
The summer of 2023 (15 May – 15 September) was characterized by temperatures above the seasonal reference average. Despite these elevated temperatures, observed mortality in the elderly population remained generally within expected levels. Monthly impact assessments highlighted increases in mortality rates associated with heatwave episodes during July and August in several monitored urban areas.
This indicator provides critical information for monitoring climate-related health risks and supports adaptation strategies aimed at reducing adverse health effects of heatwaves on vulnerable population groups.
Total Greenhouse Gas Emissions and Emissions from Energy-Related Processes
Data aggiornamento scheda:This indicator concerns atmospheric emissions of greenhouse gases (GHGs) that influence climate balance. In 2022, energy processes accounted for: 95.8% of carbon dioxide (CO₂) emissions, 14.1% of methane (CH₄) emissions, 25.6% of nitrous oxide (N₂O) emissions. Energy processes did not contribute to fluorinated gas emissions. Overall, energy-related activities contributed to 81.8% of total GHG emissions. From 1995 to 2022, GHG emissions from energy processes closely mirrored energy consumption trends until 2004. Afterward, a decoupling emerged, becoming more pronounced in recent years due to: GDP contraction, replacement of high-carbon fuels with natural gas, increased renewable energy share in electricity generation and industry. In 2022, energy-related emissions rose by 1.7% compared with 2021.
AIR TEMPERATURE
Data aggiornamento scheda: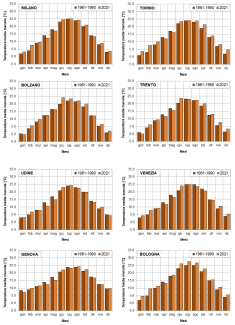
The indicator provides a representation of the trend of the average monthly temperatures recorded in the provincial capital city / region during 2021, compared with that of the average monthly temperatures calculated for the same locations over the thirty-year period 1961-1990. During 2021 there was a general increase in average monthly temperatures compared to the reference period, with exceedances of the reference values on average for 8 months and in particular in the summer and winter months. It is mainly the cities of the North where the temperature increases assume significant values in species in the months of February and December. It should be noted that in the months of April and October the temperature values, in most of the capitals, were on average lower than in the reference period.
AVERAGE SPECIFIC FUEL CONSUMPTION IN ELECTRICITY GENERATION FROM FOSSIL SOURCES
Data aggiornamento scheda:The indicator measures the primary energy, expressed in MJ, required to produce one kWh of electricity, or more precisely, it reflects the efficiency of converting primary energy from fossil fuel sources into electricity for final consumption. Available data highlight a reduction in specific energy consumption related to electricity production of 18.4% for gross production and 20% for net production between 1996 and 2022. The long-term trend of the indicator therefore shows an improvement in the electricity generation efficiency of the thermoelectric power plants.
CARBON DIOXIDE EMISSION INTENSITY IN INDUSTRY RELATIVE TO VALUE ADDED
Data aggiornamento scheda:The efficiency indicator, calculated for the years from 1990 to 2020, represents carbon dioxide emissions per unit of value added in the manufacturing and construction sectors in Italy. The substantial reduction in emission intensity over the years (-48% between 1990 and 2020) indicates an improvement in the level of efficiency achieved by the Italian manufacturing and construction industry.
CARBON DIOXIDE EMISSION INTENSITY IN THE CHEMICAL INDUSTRY
Data aggiornamento scheda: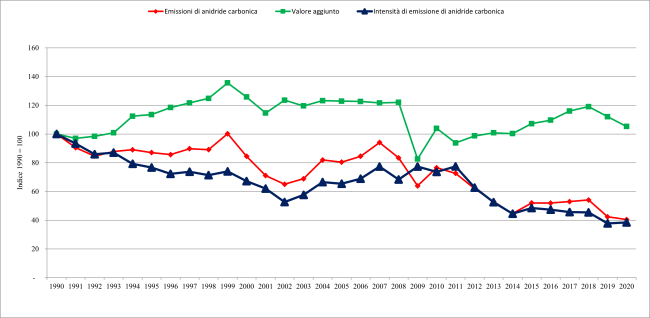
The carbon dioxide (CO₂) emission intensity related to energy use in the Italian chemical industry is analysed in relation to the sector's value added. In 2020, the indicator increased by 1.7% compared to 2019, although it decreased by 61.5% relative to 1990. The data, covering the period 1990–2020, are reported annually to the European Commission as part of the greenhouse gas emission monitoring mechanism and in implementation of the Kyoto Protocol.
CARBON DIOXIDE EMISSION INTENSITY IN THE NON-METALLIC MINERAL PROCESSING INDUSTRY
Data aggiornamento scheda: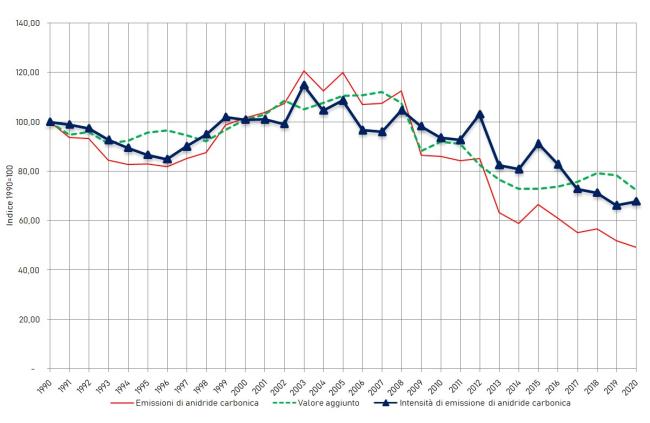
The carbon dioxide (CO₂) emission intensity related to energy use in the non-metallic mineral processing industry in Italy is presented here, analyzed with reference both to the sector’s value added and to cement production. CO₂ emissions from energy processes in this industry decreased in absolute terms by 50.8% from 1990 to 2020. Over the same period, emission intensity per million euros of value added fell by 27.5%. These indicators, developed for the 1990–2020 period, are reported annually to the European Commission as part of the EU’s greenhouse gas emissions monitoring mechanism and for the implementation of the Kyoto Protocol during commitment periods.
CARBON DIOXIDE EMISSION INTENSITY IN THE PAPER INDUSTRY
Data aggiornamento scheda: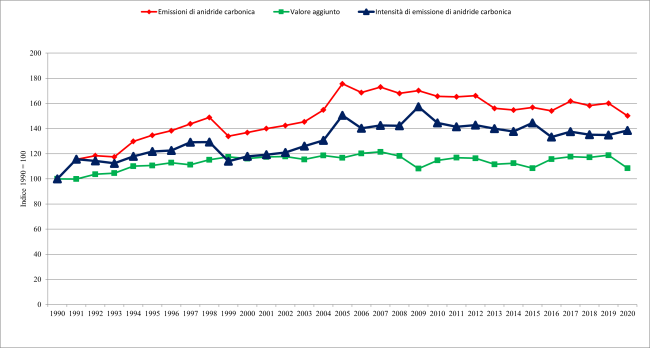
This section presents the carbon dioxide (CO₂) emission intensity related to energy use in the paper and printing industry in Italy, analyzed both in relation to value added and to production volume. In 2020, compared to the previous year, emission intensity per unit of production decreased by 2.2%, while intensity per unit of value added increased by 2.7%. In terms of long-term trends since 1990, the indicator—calculated both by value added and production—shows a general increase. This indicator, covering the period 1990–2020, is reported annually to the European Commission as part of the EU greenhouse gas emissions monitoring mechanism and the implementation of the Kyoto Protocol.
CARBON DIOXIDE EMISSION INTENSITY IN THE STEEL INDUSTRY
Data aggiornamento scheda: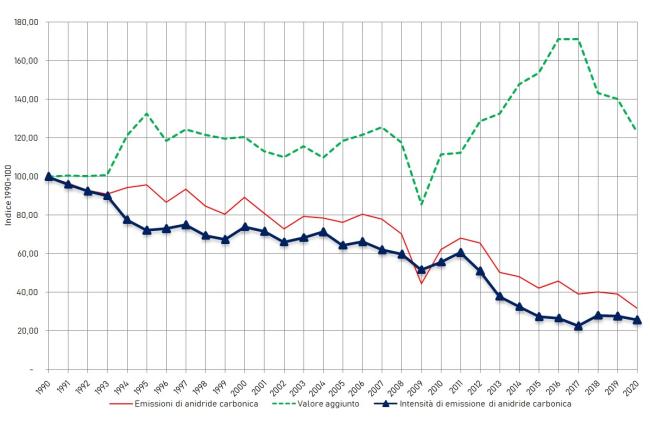
This section presents the carbon dioxide emission intensity in the steel industry in Italy, analyzed with respect to both the sector's value added and steel production. Over the period from 1990 to 2020, a decrease of 74.3% in value added and 60.4% in steel production is recorded. These indicators, developed for the period 1990-2020, are communicated annually to the European Commission as part of the Community's greenhouse gas monitoring mechanism and for the implementation of the Kyoto Protocol during the commitment periods. CO2 emissions from the steel industry decreased by 68.3% from 1990 to 2020. In 2020, emissions decreased by 18.55% compared to the previous year.
ELECTRICITY PRODUCTION FROM COGENERATION PLANTS
Data aggiornamento scheda:In 2022, the contribution of cogeneration plants to total electricity production amounted to 37.1%, while the share of cogeneration in gross thermoelectric generation reached 53.1%.
ENERGY FLOWS AND DOMESTIC ENERGY FOOTPRINT
Data aggiornamento scheda:An economic system operates through energy inputs. The total energy consumption of resident units indicates the amount of energy used by economic activities and households for production and consumption activities, distinguishing energy uses from non-energy uses.
In 2021, the total energy consumption in Italy amounted to 7.05 exajoules, a 17.1% reduction compared to 2008. The total consumption is almost entirely for energy uses. In 2021, over two-thirds of the total energy use is attributable to productive activities. Among these, the top six activities for energy use (slightly more than half of total use) contribute to nearly 7% of Italy's Gross Domestic Product. 31% of the total energy use is due to household consumption (mainly heating/cooling and transport).
ISPRA also estimates the internal energy footprint, which allows the analysis of energy uses from the perspective of final domestic demand, highlighting the direct and indirect energy amounts embedded in the goods and services offered on the domestic market by Italian production chains.
FLOWS
Data aggiornamento scheda:The indicator provides an assessment of the trend of water volumes measured in bedside sections of some of the main Italian watercourses compared to the year and the previous decade. For 2021 it was possible to represent the data of scope for 6 sections of closure of as many waterways of national importance (Po, Arno, Adige, Bacchiglione, Serchio and Tiber). In 2021, the annual volumes drained in the measurement sections showed significant increases compared to 2020, with increases of between 6% and 25%, with the exception of the sections on the Adige and the Po.
NITROGEN AND PHOSPHORUS BALANCE FROM AQUACULTURE FACILITIES IN MARINE ENVIRONMENT
Data aggiornamento scheda:The indicator provides an estimate of the input and removal of nitrogen and phosphorus in coastal environments where aquaculture activities take place. Specifically, fish farming contributes to the release of these nutrients, while mussel farming facilitates their removal.
The balance between the nutrient input from farmed fish and the nutrient removal by bivalve shellfish allows for a regional-level assessment of the net quantitative contribution of aquaculture to trophic processes along the Italian coastline.
At the national level, in 2020, estimates of the nitrogen and phosphorus balance from intensive fish farming and mussel farming showed a reduction compared to 2019. This decrease was due to:
- A decline in nutrient input resulting from lower fish production
-
A decrease in nutrient removal due to the reduction in mussel production
At the regional level, in Veneto, Emilia-Romagna, Abruzzo, Molise, and Marche, the removal of nitrogen and phosphorus by mussels exceeded the input from farmed fish.
CLIMATE CHANGE ADAPTATION STRATEGIES AND PLANS
Data aggiornamento scheda: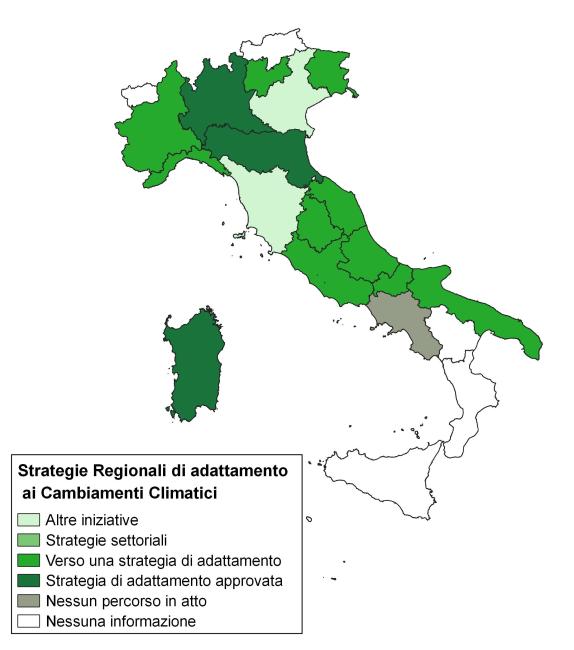
Regional Climate Change Adaptation Strategies and Plans are the primary tools available to regional authorities to address the impacts of climate change and implement actions aimed at reducing territorial vulnerabilities. In Italy, the number of adopted regional strategies and plans remains very limited. Despite the absence of a binding regulatory framework and a national programmatic reference context, there are ongoing initiatives, projects, and climate vulnerability studies that are expected to lead toward the formal adoption of first Adaptation Strategies and subsequently Climate Change Adaptation Plans. The challenge posed by climate change urgently requires the definition and implementation of concrete actions to enhance territorial resilience.