Barbara Lastoria
The indicator provides a representation of the trend of the average monthly temperatures recorded in the provincial capital city / region during 2021, compared with that of the average monthly temperatures calculated for the same locations over the thirty-year period 1961-1990. During 2021 there was a general increase in average monthly temperatures compared to the reference period, with exceedances of the reference values on average for 8 months and in particular in the summer and winter months. It is mainly the cities of the North where the temperature increases assume significant values in species in the months of February and December. It should be noted that in the months of April and October the temperature values, in most of the capitals, were on average lower than in the reference period.
The indicator provides a representation of the trend of the average monthly temperatures recorded in the provincial capital city / region during 2021, compared with that of the average monthly temperatures calculated for the same locations over the thirty-year period 1961-1990. During 2021 there was a general increase in average monthly temperatures compared to the reference period, with exceedances of the reference values on average for 8 months and in particular in the summer and winter months. It is mainly the cities of the North where the temperature increases assume significant values in species in the months of February and December. It should be noted that in the months of April and October the temperature values, in most of the capitals, were on average lower than in the reference period.
The determination of the trend of air temperatures is a first step for the evaluation of the volume of water returned by evapotranspiration, a fundamental component in the hydrological balance equation. Knowledge of air temperatures is necessary to assess climate change and induced phenomena (sea level, drought, desertification).
Existing legislation does not set specific environmental targets.
- WMO (2008) No. 168: Guide to Hydrological Practices Volume I: Hydrology, From Measurement to Hydrological Information.
- Servizio Idrografico e Mareografico Nazionale, Roma 1997 - Norme tecniche per la raccolta e l’elaborazione dei dati idrometeorologici.
- Servizio Idrografico e Mareografico Nazionale - Pubblicazione n. 17, Roma 1970 Servizio Idrografico e Mareografico Nazionale - Annali Idrologici.
-
-
ARPA/APPA
The temperature data are included in the meteo-hydrological data and are therefore published by the regional and provincial structures to which, according to Article 92 of Legislative Decree no. 112 of 31 March 1998, functions and tasks of the peripheral offices of the National Hydrographic and Tire Service (SIMN, now merged into ISPRA) of the Department for National Technical Services have been transferred. In most cases, the average monthly temperature data comes from ARPA/APPA or from the Functional Civil Protection Centers that publish them on the relevant sites within thematic pages for weather-hydrological monitoring. Part of these data are also published by the SCIA platform (National System for the Collection, Processing and Dissemination of Climatic Data of Environmental Interest - http://www.scia.isprambiente.it/) of ISPRA.
Capital of the province
1961-1990, 2021
The indicator results from the surveys that are performed according to the standards and procedures standard and regulated by the World Meteorological Organization (WMO).
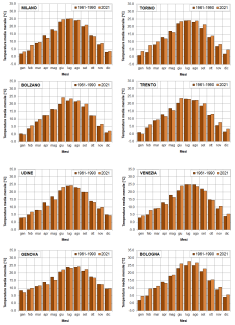
During 2021 there was a general increase in monthly average temperatures compared to the reference period, with exceedances of the reference values on average for 8 months and in particular in the summer and winter months (Figure 1a, 1b and 1c). The months of February and June stood out for the fact that all the cities considered have marked exceedances of the average reference temperatures. In particular, in February the temperature increases were on average 50%, with more marked increases in the cities of the North and lower in the South and Islands in which the increases were kept below 10% throughout the year (Figure 1c). In contrast to this condition, it should be noted that in the months of April and October the temperature values, in most capitals, were on average lower than in the reference period.
The indicator confirms the persistence of a general increase in temperatures, with a trend on average comparable to that of the previous year.
| Data |
|---|
Thumbnail
Headline
Figure 1a: Comparison between the trend of the monthly average temperatures of 2021 and those for the thirty-year period 1961-1990 for the measuring stations represented in Figure 2 Data source
ISPRA, ARPA/APPA, Regional Civil Protection Centres |
Thumbnail
Headline
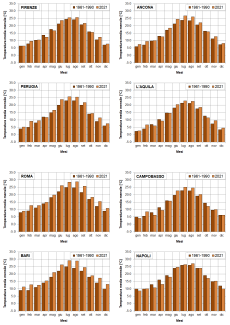
Figure 1b: Comparison between the trend of the monthly average temperatures of 2021 and those for the thirty-year period 1961-1990 for the measuring stations represented in Figure 2 Data source
ISPRA, ARPA/APPA, Regional Civil Protection Centres |
Thumbnail
Headline
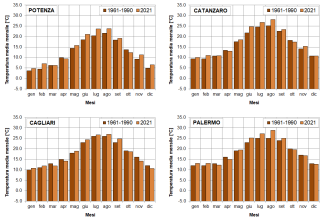
Figure 1c: Comparison between the trend of the average monthly temperatures of 2021 and those for the thirty-year period 1961-1990 for the measuring stations represented in Figure 2 Data source
ISPRA, ARPA/APPA, Regional Civil Protection Centres |
Thumbnail
Headline
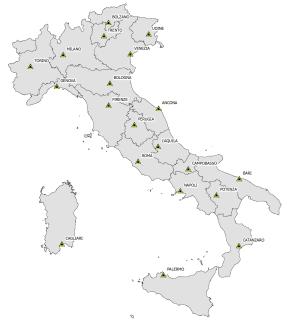
Figure 2: Map of the thermometric stations considered Data source
ISPRA, ARPA/APPA, Regional Functional Centres of Civil Protection |
The increase in monthly average temperatures compared to the reference thirty years in 2021 is in line with what was found in the previous year. It is above all the cities of the North in which the temperature increases, which in any case concern in an almost generalized way a large part of the national territory, assume significant values. This occurs in particular in the months of February and December (Figure 1a) in which the northern capitals show on average increases of the order of 70% and 60% respectively. In terms of persistence, it should be noted that there are 7 capitals, distributed throughout the territory with the exception of the islands, in which for no less than 10 months the average monthly temperatures are above the reference values. Unlike 2020, when the months of June and October were characterized by those in which the temperatures of most of the capital cities presented lower temperatures than the thirty years of reference, with average percentages of 5% and 6% respectively, in October 2021 it remains between the months in which the temperatures of most of the capitals are lower than the average reference values, while June is the month in which all the capitals recorded on average temperatures of 12%. However, the winter months are in which the greatest temperature increases occurred in 2021, especially for the capitals of the Centre-North.