Antonio Caputo, Daniela Romano
The indicator evaluates the trend of greenhouse gas emissions from energy processes for the different sectors, in order to reduce the impact of energy use on climate change. Greenhouse gas emissions from energy processes in the period 1990-2024 decreased by 31% with different trends for the various sectors, while in the civil sector they decreased by 16% compared to 1990, in the transport sector they increased by 10%. In the same period, emissions from the energy industry sector fell by 55% while those from manufacturing industries showed a reduction of 50%. In 2024, emissions from energy processes were 294.5 million tonnes of CO 2 equivalent (-3.5% compared to the previous year).
The indicator consists of a breakdown by sector of greenhouse gas emissions from energy processes. The sectors that contribute to greenhouse gas emissions from energy processes are: energy industries, manufacturing industries, the residential sector and services and transport. The greenhouse gases that contribute most to emissions from energy processes are: CO 2, CH 4 and N 2 OR.
Evaluate the trend of greenhouse gas emissions from energy processes for different sectors, in order to reduce the impact of energy use on climate change.
With the Kyoto Protocol (2008-2012) an emissions reduction objective of 6.5% was envisaged for Italy compared to 1990 levels. In the Climate Change Conference held in Doha in 2012, the Kyoto Protocol was extended until 2020, without, however, reaching a binding agreement on reductions. We arrive at the Paris Agreement (COP21) of 2015 where the objective is set to contain the increase in global temperature well below 2°C compared to pre-industrial levels, making every effort to limit it to 1.5°C.
At European and national levels, the objectives for 2020 (compared to 1990 levels for global and European targets) have been articulated through a clear separation of sectors. In the ETS (Emissions Trading System) sector, i. e. Industrial and energy plants, the overall reduction target was 21% compared to 2005. In the Non-ETS (Effort Sharing Decision - ESD) sectors, i. e.: Transport, construction, agriculture and waste, regulated by national targets, Italy is asked to set the objective of a 13% reduction compared to 2005. For renewable sources, while Europe was aiming for 20% green energy Italy was assigned a 17% share of gross final consumption. Finally, the European target for energy efficiency required a 20% improvement.
With the launch of the European Green Deal, the European Union has significantly raised its ambitions for 2030, translating them into binding rules through the Effort Sharing Regulation (ESR). The new European and national targets for 2030 are: for greenhouse gas emissions an overall reduction of 55% compared to 1990. A share of at least 42.5% of renewable energy (provisional agreement in 2023 with intention to aim for 45%) and an improvement of at least 36% in energy efficiency, in terms of reduction of final energy consumption and of at least 39% in terms of reduction of primary energy consumption compared to the trend scenario (PRIMES 2007 Model). To achieve the greenhouse gas emissions reduction target, the sectors covered by the EU Emissions Trading System (ETS) will have to reduce emissions by 62% (compared to 2005), while the non-ETS sectors will have to reduce emissions by 40% (compared to 2005). These objectives were translated into national binding objectives for Member States with the adoption of the Effort Sharing Regulation (ESR 2018/842). For Italy, a reduction in emissions from the ESR sectors is expected by 43.7% compared to 2005. To achieve the 2030 objectives, the European Union has adopted EU Regulation 2018/1999 which establishes an Energy Union Governance system with the main objective of planning the policies and measures implemented by the Member States. In the context of the procedure that established the 55% objective, the objective of emission neutrality by 2050 was given legal force, providing for the definition of a trajectory, at European level, for the period after 2030. The National Decarbonisation Strategies for 2050 that Member States must adopt pursuant to EU Regulation 2018/1999 are placed in this context. Italy adopted its long-term national strategy on the reduction of greenhouse gas emissions in January 2021, in continuity with the National Integrated Plan for Energy and Climate (PNIEC), sent to the Commission in 2020.
The measures necessary to achieve the European objectives linked to the European Green Deal and RePowerEU were considered in the National Recovery and Resilience Plan (PNRR) sent to the European Commission in 2021 and subsequently integrated into the draft PNIEC with a horizon of 2030 sent to the Commission in June 2023. The definitive updated version of the PNIEC was sent to the European Commission on 1 July 2024, containing the new decarbonisation trajectories for 2030 consistent with the Fit for 55. The Plan aims to create an energy policy that ensures full environmental, social and economic sustainability and accompanies the transition.
ISPRA, Italian Greenhouse Gas Inventory 1990-2024, National Inventory Report 2026, https://emissioni. sina. isprambiente. it/interno-nazionale/
European Environment Agency, Energy and Environment in the European Union, Environmental issue report, No. 31, 2002, https://www. eea. europa. eu/publications/environmental_issue_report_2002_31
The accuracy of the indicator decreases when moving from the national to the local level, due to the non-uniform distribution of energy production and consumption across the national territory.
ISPRA
ISPRA, Inventory of atmospheric emissions ( https://emissioni. sina. isprambiente. it/economia-nazionale/)
National
1990-2024
Estimate carried out as part of the preparation of the national emissions inventory. The carbon dioxide equivalent value is calculated by multiplying the emissions of each gas by the relative global warming potential with respect to carbon dioxide; for example, the conversion factors are 21 for methane and 310 for nitrous oxide. To ensure the consistency and comparability of the inventory, the annual update of emissions involves the review of the entire historical series based on available information and the most recent methodological developments. The sectoral breakdown used is the same used by the European Environment Agency (2002), "Energy and Environment in the European Union", Environmental Issue report, No. 31.
In 2024, emissions from energy processes were 294.5 million tonnes of CO 2 equivalent (-3.5% compared to the previous year). Transport represents 38.6% of emissions. Energy industries 23.2%. The civil sector represents 22.5% and manufacturing industries 15.7% (Table 1). In 2024, the energy industries sector recorded a decline of 14.3% compared to the previous year, due to the reduction in production from coal-fired power plants and the increase in production from renewable sources.
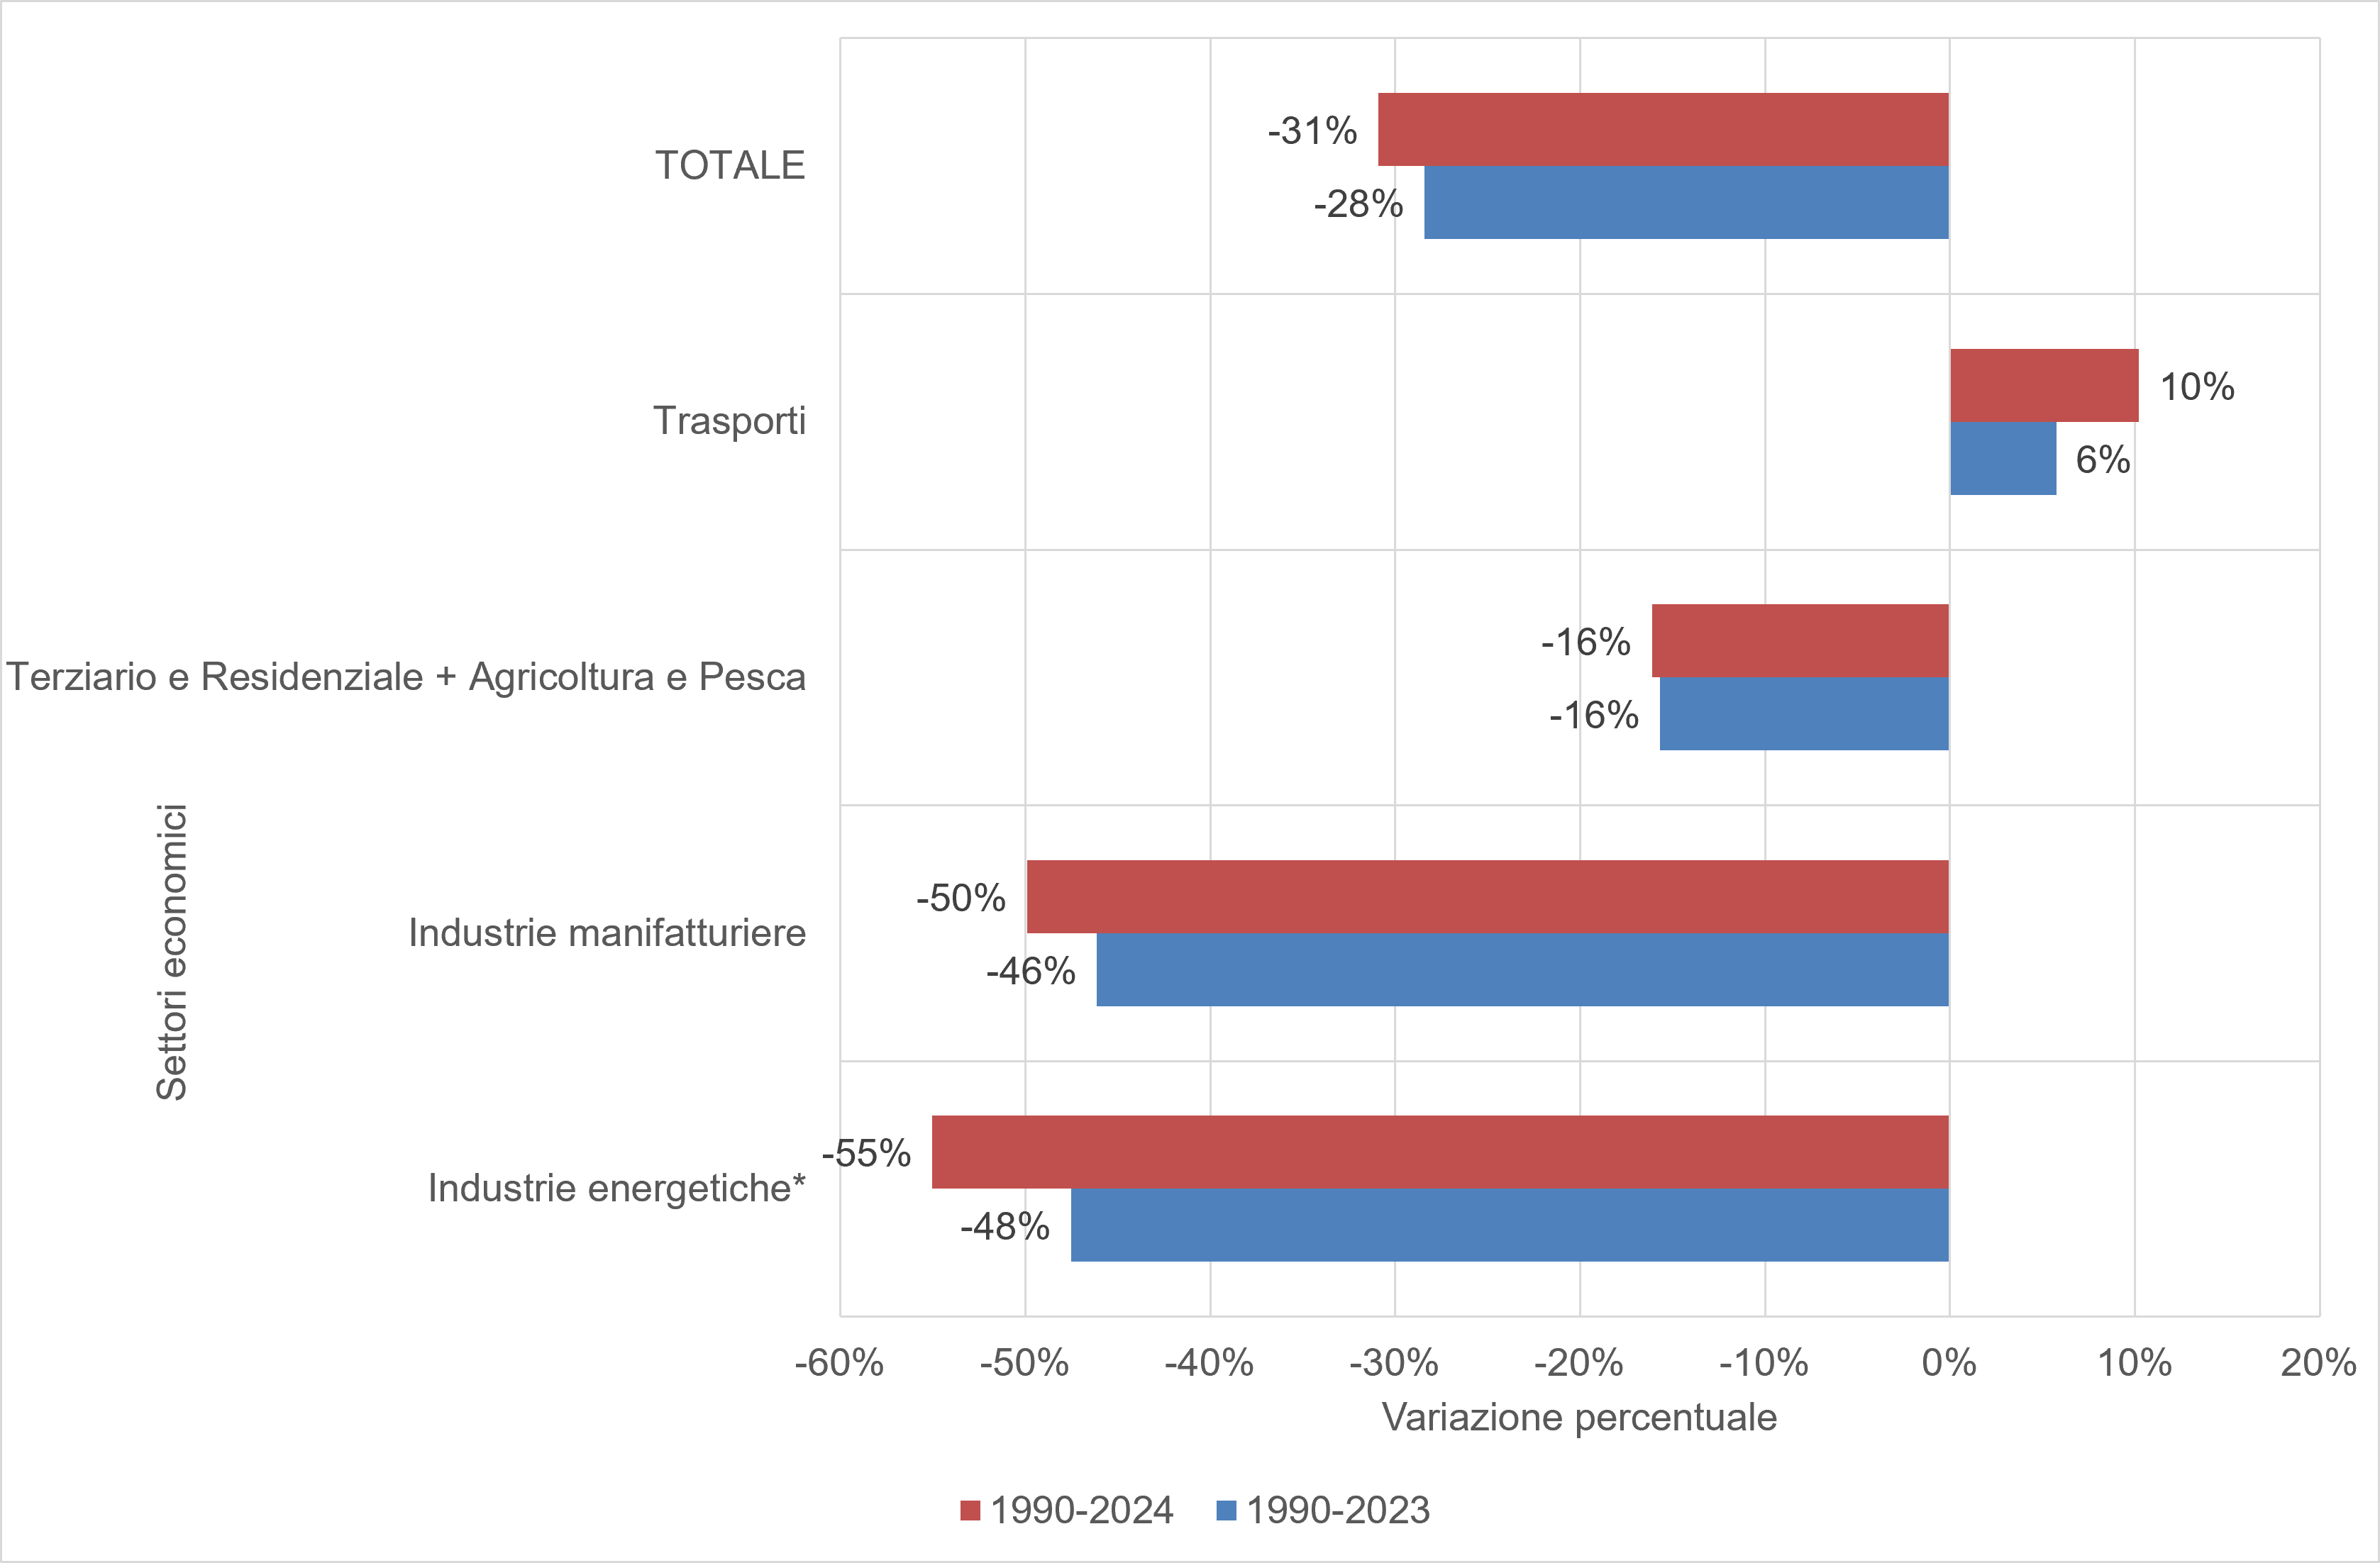
Greenhouse gas emissions from energy processes in the period 1990-2024 decreased by 31% from 426.2 Mt CO 2 eq. At 294.5Mt CO 2 eq. The sectors show different trends. Emissions due to transport present an initial phase of growth until 2007 (+26% compared to 1990) and a subsequent phase of decrease due fundamentally to the economic crisis and, in more recent years, also to the market penetration of more efficient vehicles (-18% in the period 2007-2019); the notable reduction recorded from 2019 to 2020 (-18%) is attributable to the contraction in travel and consumption as a result of the pandemic crisis, while in the following years there is a recovery (+31% in 2024). Emissions from the residential and services sector show a fluctuating trend, with a decrease in 2024 compared to 1990 of 16%. In the manufacturing industries sector, a reduction has been observed since 1990, accelerated by the economic crisis after 2007 and by the drastic reduction in 2020 (-50% in the period 1990-2024). Furthermore, an increase in efficiency, found especially in the chemical sector, contributed to this. In particular, in 2024, emissions in the category are less than half compared to the emission peak reached in 1999. Emissions in the energy industries sector, after reaching the maximum in 2006, subsequently recorded a strong contraction; in general, they will reduce by 55% in 2024 compared to 1990 (Figure 1).
| Allegati |
|---|
Headline
Tabella1: Emissioni gas serra da processi energetici Data source
ISPRA |
Thumbnail
Headline
Figura 1: Emissione gas serra da processi energetici Data source
ISPRA |
The manufacturing and energy industries contribute significantly to the reduction of greenhouse gas emissions from energy processes, with a contraction of 50% and 55% respectively. The weight of the different sectors also varies and, in particular, greenhouse gas emissions from manufacturing industries go from 21.6% in 1990 to 15.7% in 2024, while energy industries from 35.6% to 23.2%. Emissions from residential and services, however, went from 18.5% to 22.5%, those due to transport from 24.2% to 38.6% (Figure 1).