Eleonora Di Cristofaro, Francesca Palomba
The indicator describes greenhouse gas (GHG) emissions (CH₄, N₂O and CO₂) released into the atmosphere by the agricultural sector, mainly resulting from livestock management and fertilizer use. It also assesses the sector's contribution to total national greenhouse gas emissions and progress towards emission reduction targets.
Since 1990, greenhouse gas emissions from agriculture have shown an overall downward trend. However, further emission reduction measures will be required to achieve the targets established under the United Nations Framework Convention on Climate Change (UNFCCC), the Paris Agreement and relevant European legislation. In particular, under the Effort Sharing Regulation (EU) 2023/857, Italy is required to reduce greenhouse gas emissions from the sectors covered by the Regulation—including agriculture, buildings, transport, waste and industrial installations not covered by the EU Emissions Trading System (EU ETS)—by 43.7% by 2030, compared with 2005 levels.
In 2024, greenhouse gas emissions from agriculture accounted for 10.8% of total emissions from the sectors covered by the Effort Sharing Regulation, while emissions from the agricultural sector were 15.2% lower than in 2005.
Enteric fermentation due to the digestive process, in particular of ruminants, the management of manure produced by livestock, the physico-chemical and biological processes that occur in agricultural soils, the management of rice paddies and the combustion of agricultural residues release two important greenhouse gases into the atmosphere: methane (CH 4) and nitrous oxide (N 2 OR). Furthermore, carbon dioxide (CO) emissions are attributable to the agriculture sector 2) resulting from the application of urea and lime to the soil and the use of other carbon-containing fertilizers. The indicator represents the emissions of these greenhouse gases of agricultural origin, calculated starting from statistical indicators of activity and emission factors, according to the reference methodology developed by Intergovernmental Panel on Climate Change (IPCC, 2006 and IPCC, 2019). CH emissions 4 and N 2 Or they are converted into equivalent quantities of carbon dioxide (CO 2 eq.) by multiplying the emissions of the two gases by the relative global warming potential (GWP, Global Warming Potential ), equal to 265 per N 2 O and 28 for CH 4.
Estimate the national greenhouse gas emissions produced by the agricultural sector, in order to verify the trend and the achievement of the reduction objectives defined by current legislation. The indicator is also useful for evaluating the contribution of agriculture to the national total of greenhouse gas emissions.
- United Nations Framework Convention on Climate Change (1992) ratified with law no. 65 of 01/15/94;
- Kyoto Protocol (1997) ratified with law no. 120 of 01/06/02;
- CIPE Resolution of 12/19/2002; Doha Amendment to the Kyoto Protocol (2012);
- Paris Agreement (2016);
- European Regulation on Energy Governance and Climate Action (1999/2018);
- Decision Effort Sharing (406/2009/EC);
- Regulation Effort Sharing (842/2018/EC);
- Regulation Effort Sharing (2023/857/EC).
At European level, the objectives for reducing overall greenhouse gas emissions by 2020 are set by the European Regulation (525/2013), relating to the European Union Greenhouse Gas Emissions Monitoring Mechanism, repealed by European Regulation 1999/2018 relating to the Governance of the Energy Union and Climate Action, which provides for institutions and procedures to achieve the objectives and targets of the Energy Union, and in particular the Union's 2030 energy and climate targets. The European Union and its Member States, within the framework of the United Nations Framework Convention on Climate Change ( United Nations Framework Convention on Climate Change, UNFCCC), of the Kyoto Protocol and subsequently under the Doha Amendment to the Kyoto Protocol of 2012 and the Paris Agreement of 2016, have agreed to reduce their collective emissions by 20% by 2020 and 40% by 2030, compared to 1990 levels. Considering the overall emissions from non-EU-ETS sectors ( European Union Emissions Trading Scheme - EU ETS), which in addition to the agricultural sector include transport, civil, waste and industrial plants not included in the EU-ETS Directive, the reduction objective for Italy for 2020 established by Decision Effort Sharing (406/2009), equal to -13% compared to 2005 greenhouse gas emissions has been achieved. The reduction target for 2030 was changed upwards, from -33% to -43.7%, based on the Regulation Effort Sharing (2023/857/EC), which replaced the previous Regulation E ffort Sharing (842/2018/EC). The specific objectives of individual Member States have increased in line with the approval of the change in the European objective for reducing greenhouse gas emissions from 40% to 55% by 2030 compared to 1990 levels and in line with the new sector reduction objectives Effort Sharing, at European level from 30% to 40% by 2030, compared to 2005.
To contribute to achieving the European energy and climate objectives for 2030, the Ministry of the Environment and Energy Security (MASE) has developed the National Integrated Plan for Energy and Climate (PNIEC). The final and updated version of the plan, transmitted to the European Commission on 1 July 2024, defines the new decarbonisation trajectories to 2030, in line with the package Fit for 55.
- CE, 2020. Raccomandazioni della Commissione per il piano strategico della PAC dell’Italia SDW (2020) 396 final. https://www.reterurale.it/PAC_2023_27/PianoStrategicoNazionale
- IPCC, 2006. 2006 IPCC Guidelines for National Greenhouse Gas Inventories, Prepared by the National Greenhouse Gas Inventories Programme, Eggleston H.S., Buendia L., Miwa K., Ngara T. and Tanabe K. (eds). Published: IGES, Japan. URL: https://www.ipcc-nggip.iges.or.jp/public/2006gl/vol4.html
- IPCC, 2019. 2019 Refinement to the 2006 IPCC Guidelines for National Greenhouse Gas Inventories https://www.ipcc-nggip.iges.or.jp/public/2019rf/index.html.
- ISPRA, 2026 [a]. Italian Greenhouse Gas Inventory 1990-2024. National Inventory Document 2026. Rapporto ISPRA 428/2026. URL: https://www.isprambiente.gov.it/files2026/pubblicazioni/rapporti/rpporto-428_26_nid2026_italy_stampa.pdf.
- ISPRA, 2026 [b]. Serie storiche delle emissioni di gas serra 1990-2024. URL: https://emissioni.sina.isprambiente.it/inventario-nazionale/
- ISPRA, 2026 [c]. Le emissioni di gas serra in Italia: obiettivi di riduzione e scenari emissivi. URL: https://www.isprambiente.gov.it/it/pubblicazioni/rapporti/emissioni-di-gas-serra-in-italia-edizione-2026
- ISTAT, 2026. Dati annuali sulla consistenza del bestiame, sulla produzione di latte, sui mezzi di produzione, sulle coltivazioni. Istituto Nazionale di Statistica. URL: https://esploradati.istat.it/databrowser/#/it
ISPRA (Italian Institute for Environmental Protection and Research)
ISPRA, Inventory of atmospheric emissions ( http://emissioni. sina. isprambiente. it/interno-nazionale/)
National
1990-2024
The indicator represents the estimate of national greenhouse gas emissions produced by the agricultural sector, elaborated according to the methodology described in the IPCC guidelines (IPCC, 2006 and IPCC, 2019). Emissions from the agriculture sector refer to the following emission categories: enteric fermentation, management of animal waste, cultivation of rice paddies, agricultural soils, combustion of agricultural residues, application of urea and lime to the soil and use of other carbon-containing fertilizers. The estimate of emissions is carried out as part of the creation of the national inventory of atmospheric emissions through the use of appropriate emission factors and/or estimation models. Greenhouse gas emissions are then converted into CO terms 2 eq., multiplying the emissions of each greenhouse gas by the relative global warming potential. In the National Inventory Document - NID (ISPRA, 2026 [a]) describes the estimation methodology and the data used, reports the emission data, the analysis of the trend and the main emission categories, data control and quality activities, planning of estimate improvement activities. Every year the emission data (ISPRA, 2026 [b]), communicated via i Common Reporting Tables (CRT) and the NID, are sent to the UNFCCC Secretariat.
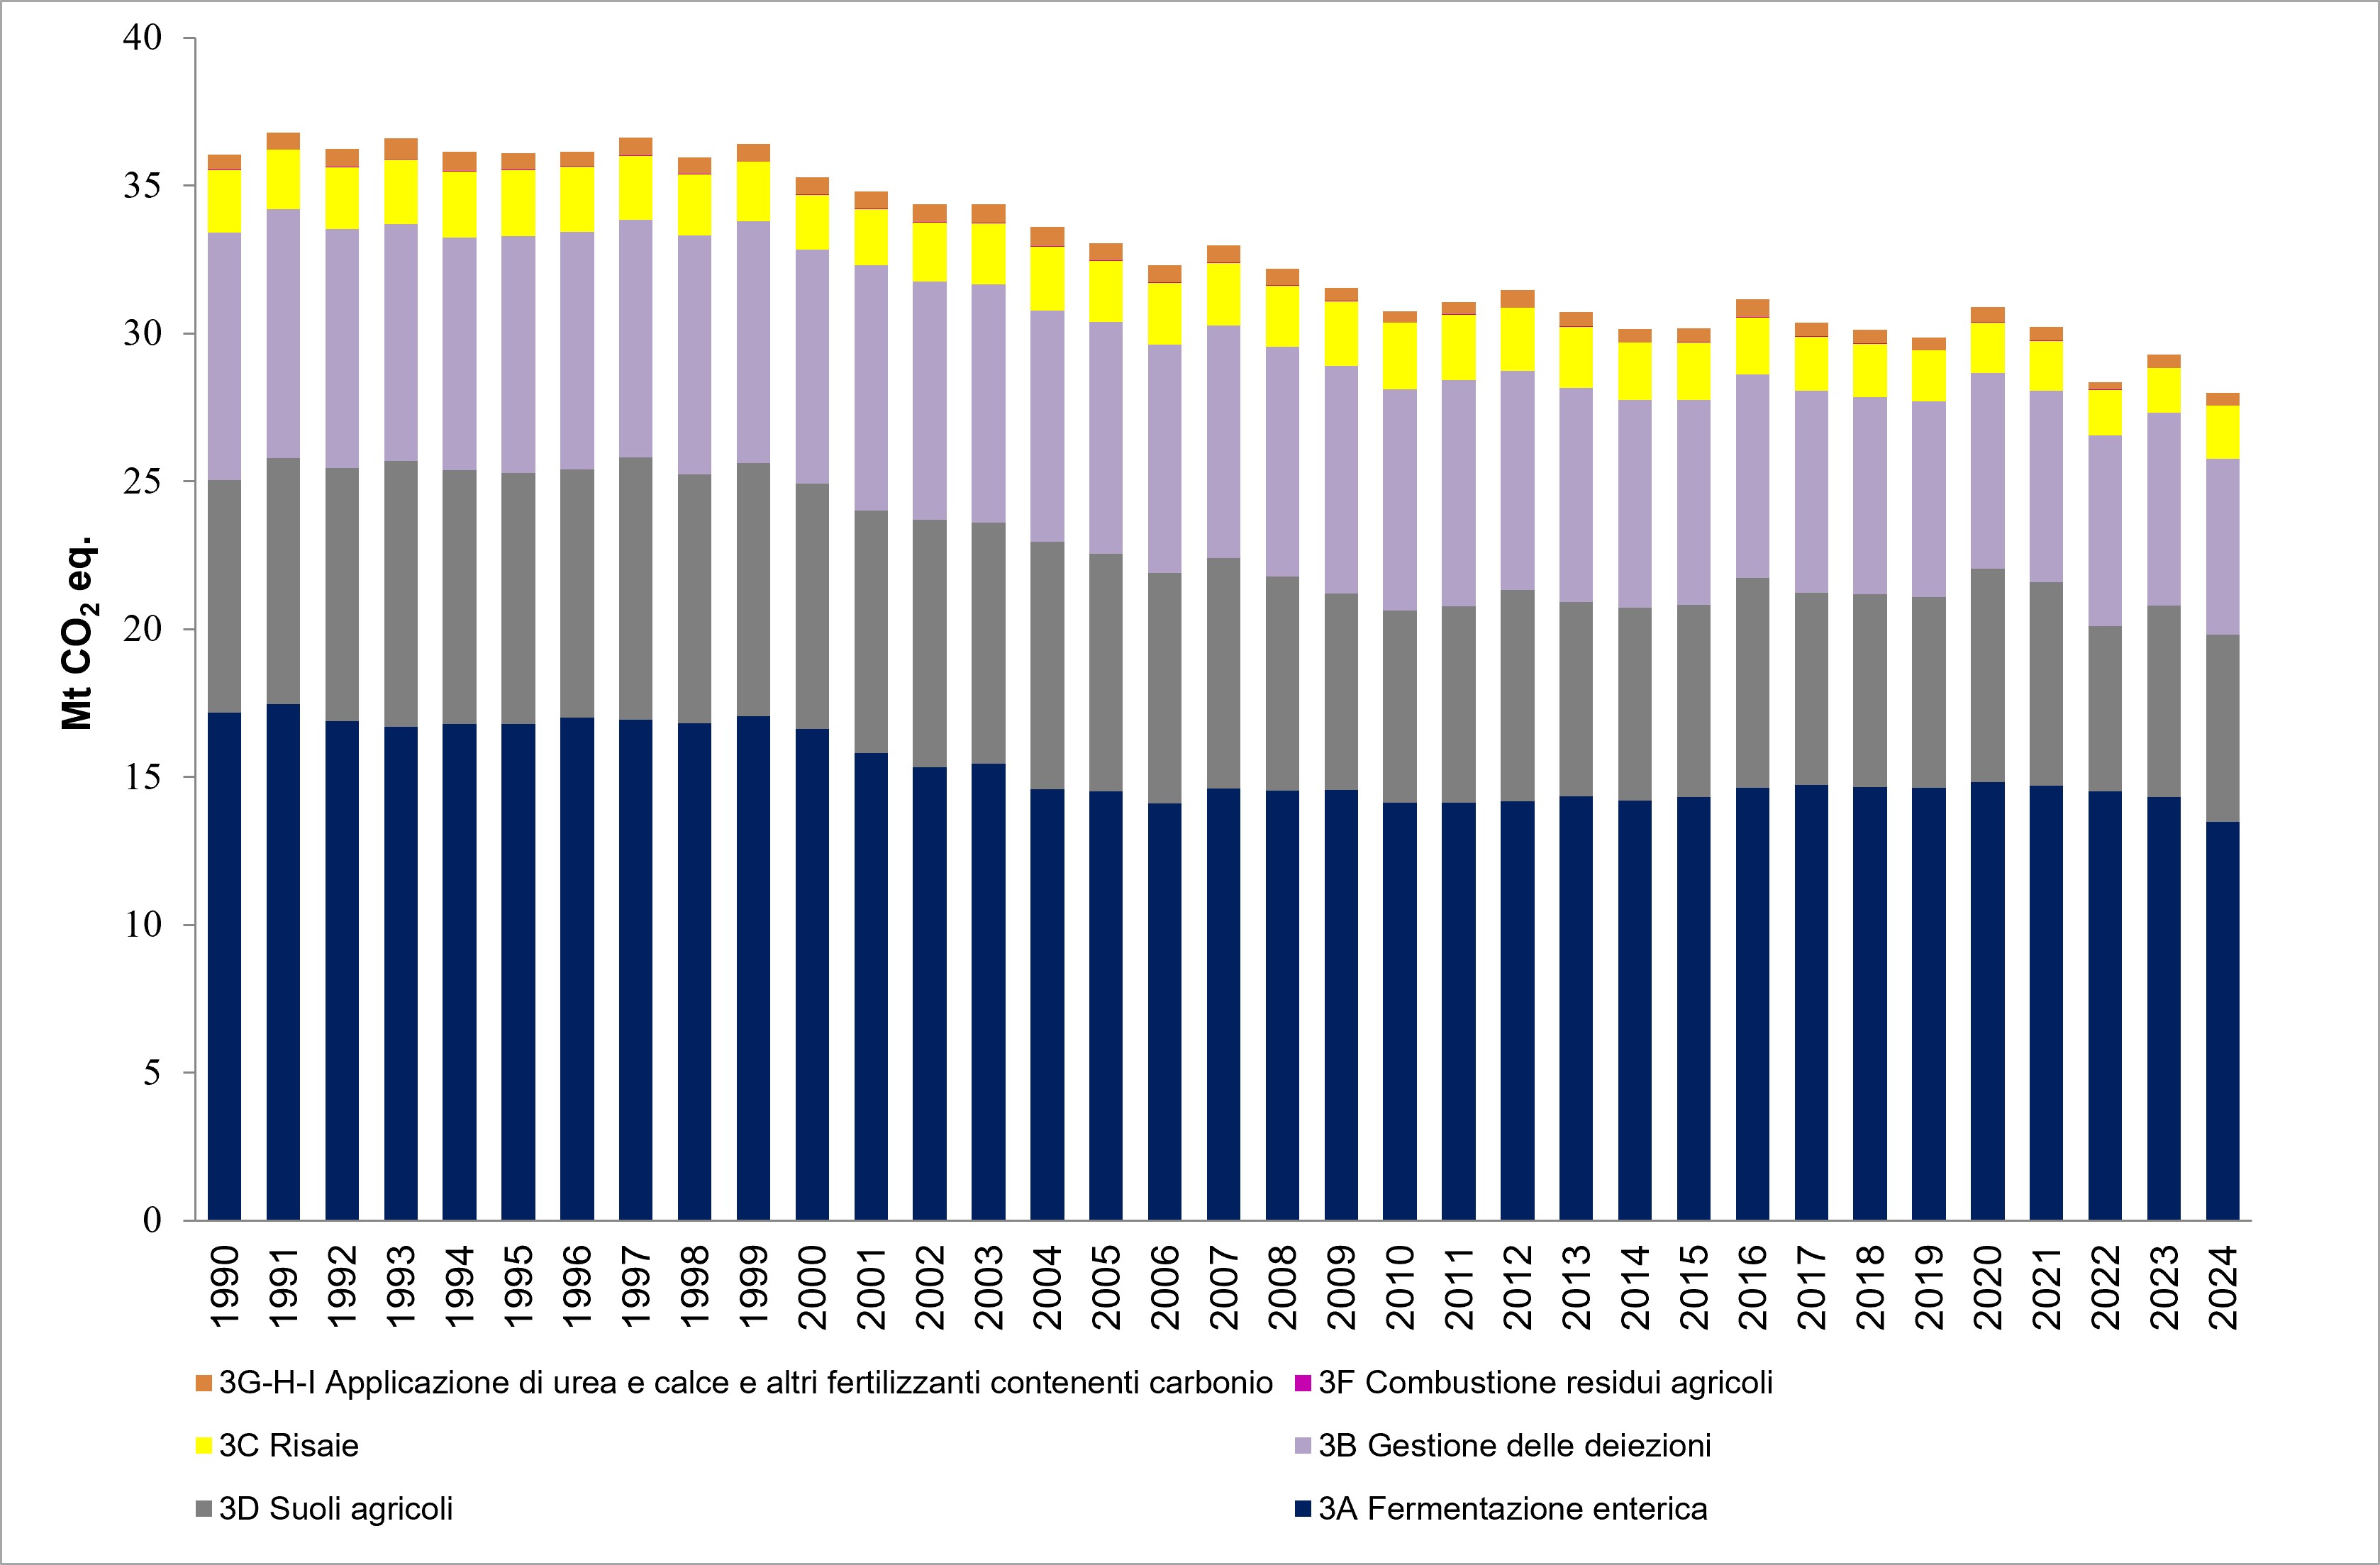
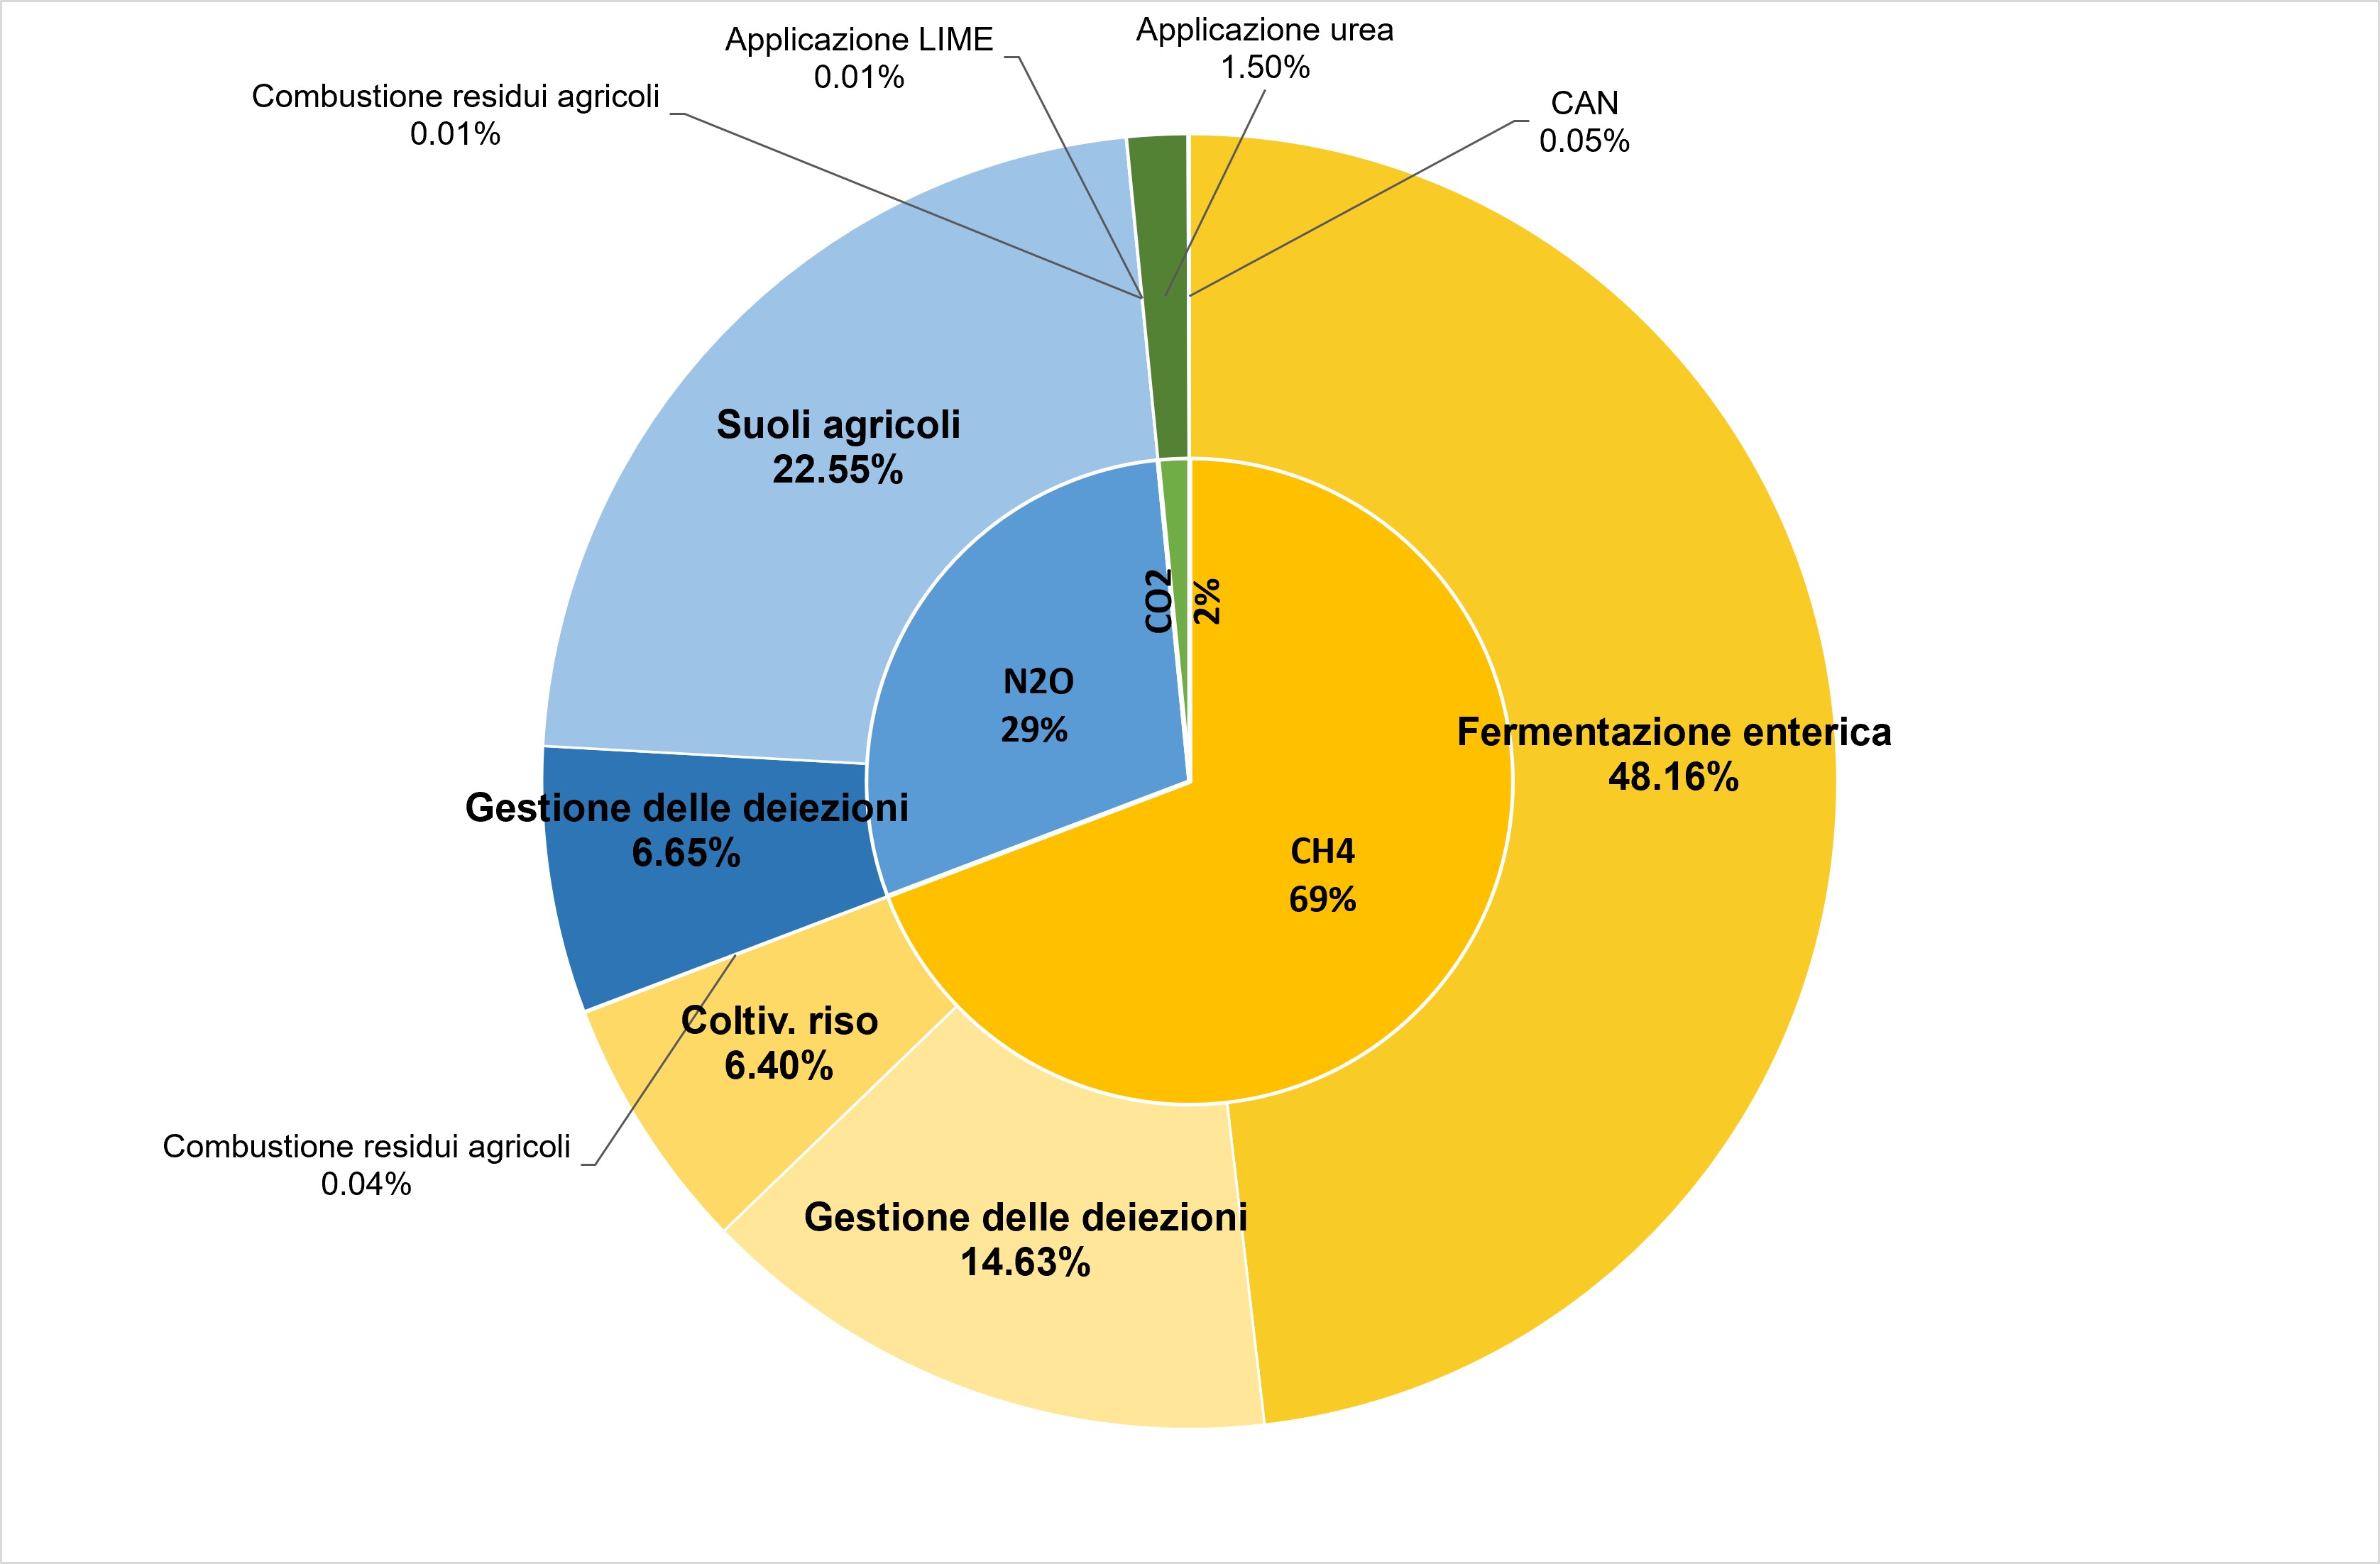
The 2030 reduction objective set by the Effort Sharing Regulation (2023/857/EC) for Italy is equal to -43.7% reduction in overall greenhouse gas emissions from the agriculture, civil, transport, waste and industrial plants sectors not included in the EU-ETS Directive, compared to 2005 levels. In 2024, greenhouse gas emissions from agriculture amounted to 28.0 Mt CO 2 eq., whose weight with respect to the sectors of the Effort Sharing Regulation it is equal to 10.8%; compared to 2005, the reduction relating to the agricultural sector alone is equal to 15.2%. In 2024, greenhouse gas emissions from agriculture represent 7.7% of total greenhouse gas emissions (Table 1). The analysis by gas highlights how 69.2% derives from methane emissions, 29.2% from nitrous oxide emissions and only 1.6% depends on carbon dioxide (Figure 2).
The reduction in greenhouse gas emissions from agriculture in 2024 compared to 1990 was equal to 22.3%, going from 36.0 Mt CO 2 eq. In 1990 at 28.0 Mt CO 2 eq. In 2024. Analyzing the variation by greenhouse gas, CH emissions 4, N 2 O and CO 2 decreased by 21.2%, 25.2%, 14.1% respectively (Table 1).
From the examination of the variation by emission category, the emissions produced by enteric fermentation (CH 4) and the management of animal waste (CH 4 and N 2 O) decreased by 21.5% and 28.9% respectively, while those deriving from rice cultivation (CH 4) and from agricultural soils (N 2 O) recorded a reduction of 14.7% and 19.6%, respectively (Figure 1).
This trend is mainly driven by a reduction in livestock numbers for certain livestock categories, lower use of synthetic nitrogen fertilisers, declines in agricultural area and production, and increased biogas recovery for energy generation
The Common Agricultural Policy (CAP), in particular, with the measures envisaged by direct support for farmers and market interventions, has had a significant role in reducing agricultural greenhouse gas emissions (the milk quota system, for example, has constrained milk production, leading to a reduction in the number of animals and an increase in productivity per animal). The general orientation of the post-2020 CAP reform is towards greater ambition in climate-environmental matters with the aim of contributing to the achievement of the objectives of reducing greenhouse gas emissions that the European Union has set itself. According to European Regulation 2021/2115, issued as part of the implementation of the 2023-2027 CAP, member states must draw up a National Strategic Plan, containing the interventions, and related estimated costs, to be carried out to contribute to the achievement of 9 specific objectives and a transversal objective of the future CAP (EC, 2020). In December 2022, the Commission approved Italy's CAP strategic plan 2023-2027, which underwent changes and was definitively approved in June 2025.
| Allegati |
|---|
Titolo
Table 1: Greenhouse gas emissions from agriculture, by greenhouse gas and share of total national greenhouse gas emissions Fonte
ISPRA Note
Effort Sharing Decision, ESD |
Thumbnail
Titolo
Figure 1: Greenhouse gas emissions from agriculture by source Fonte
ISPRA |
Thumbnail
Titolo
Figure 2: Breakdown of emissions from agriculture by type of greenhouse gas and by corresponding emission category (2024) Fonte
ISPRA |
In 2024, agriculture is responsible for 7.7% of total greenhouse gas emissions, expressed in CO 2 eq., and is therefore the second source of greenhouse gas emissions after the energy sector (81.0%).
In 2024, greenhouse gas emissions from agriculture will undergo a reduction of 4.3% compared to the previous year (Table 1); the analysis by type of greenhouse gas and for the corresponding emission category highlights how the emissions deriving from enteric fermentation (which involves emissions of CH 4) account for 48.2%, agricultural soils (N 2 O) for 22.6%, the management of excrement (CH 4 and N 2 O) for 21.3%, of which those deriving from CH 4 are 14.6% and those from N 2 Or 6.7%, the cultivation of rice fields (CH 4) for 6.4%, application of urea and lime and other fertilizers containing carbon (CO 2) for 1.6%, the combustion of agricultural residues (No 2 O and CH 4) for 0.05% (Figure 2).
Methane emissions depend on the digestive process of animals and in particular on enteric fermentation (69.6%), the treatment and storage of livestock waste (21.1%), the cultivation of rice (9.2%) and the combustion of agricultural residues (0.1%). Nitrous oxide emissions depend on the management of livestock waste (22.8%), agricultural soils (which include emissions caused by the application of synthetic and organic fertilizers to the soil, the incorporation of crop residues, organic soils), which overall represent 77.2% of nitrous oxide emissions, and the combustion of agricultural residues (0.03%). Overall, the livestock sector contributes approximately 76% of the total emissions from the agriculture sector.