Panel 1
Antonella Bernetti
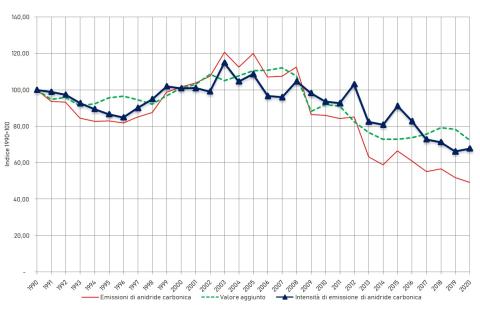
The carbon dioxide (CO₂) emission intensity related to energy use in the non-metallic mineral processing industry in Italy is presented here, analyzed with reference both to the sector’s value added and to cement production. CO₂ emissions from energy processes in this industry decreased in absolute terms by 50.8% from 1990 to 2020. Over the same period, emission intensity per million euros of value added fell by 27.5%. These indicators, developed for the 1990–2020 period, are reported annually to the European Commission as part of the EU’s greenhouse gas emissions monitoring mechanism and for the implementation of the Kyoto Protocol during commitment periods.
The CO₂ emission intensity in the non-metallic mineral processing industry is calculated by relating CO₂ emissions from fossil fuel combustion used in production processes—including combustion for electricity and heat generation—both to the sector’s value added (at basic prices, chain-linked values, reference year 2015) and to cement production. The indicator therefore provides information on the tonnes of carbon dioxide emitted per million euros of value added and per tonne of cement produced for the 1990–2020 period.
The purpose is to provide information on the main drivers and highlight progress made at the national level, regularly, in different sectors from a socio-economic and environmental perspective and to provide data on the tonnes of carbon dioxide emitted per million euros of value added and per unit of product (cement).
Regulation (EU) No. 525/2013, Implementing Regulation (EU) No. 749/2014, Commission Decision No. 2005/166/EC. Regulation (EU) No. 525/2013, which repeals Decision No. 280/2004/EC, establishes in Article 7(1)(f) that by 15 January each year (year X), Member States must report to the Commission information on CO₂ emission intensity indicators, as defined in Annex 3 of the Regulation, with reference to year X–2, including primary, additional primary, and supplementary indicators (as per Article 3(1)(j) of Decision No. 280/2004/EC). Implementing Regulation (EU) No. 749/2014 of 30 June 2014 concerns the structure, format, submission procedures, and review of information reported by Member States under Regulation (EU) No. 525/2013 of the European Parliament and Council. Commission Decision No. 2005/166/EC of 10 February 2005 establishes the implementation rules of Decision No. 280/2004/EC concerning the monitoring mechanism for greenhouse gas emissions and implementation of the Kyoto Protocol. The Decision requires the monitoring of all anthropogenic greenhouse gas emissions, assessment of progress toward commitments under the UNFCCC and Kyoto Protocol, and ensures timely, complete, accurate, consistent, comparable, and transparent reporting by the Community and its Member States.
Panel 2
APAT, 2008. Carbon Dioxide Intensity Indicators. http://www.isprambiente.gov.it/contentfiles/00004100/4151-co2intensityindicators08.pdf/
ISPRA, various years. Carbon dioxide emission intensity indicators: http://emissioni.sina.isprambiente.it/wp-content/uploads/2022/04/Annex-II-Reporting-template-indicators-2022.xlsx
ISTAT, various years. Italian Statistical Yearbook. http://www.istat.it/it/prodotti/produzione-editoriale
MISE, various years. Cement production data: http://www.sviluppoeconomico.gov.it/index.php/it/per-i-media/statistiche/2009708-statistiche-produzione-cementi.
Data quality assessment
ISPRA (Italian National Institute for Environmental Protection and Research), ISTAT (Italian National Institute of Statistics), MISE (Ministry of Economic Development)
ISPRA data were used, specifically the carbon dioxide emission intensity indicators officially submitted each year to the EU under Regulation (EU) No. 525/2013 on greenhouse gases. These indicators are available at the following link:
http://emissioni.sina.isprambiente.it/wp-content/uploads/2022/04/Annex-II-Reporting-template-indicators-2022.xlsx
ISTAT data from various years were also used. Value Added data are available at: http://dati.istat.it
National
1990 - 2020
Indicator assessment
Indicators are calculated as the ratio between CO₂ emissions (t) from the non-metallic mineral processing industry and the sector’s value added (million euros) or cement production (t), presented as fixed-base index numbers (1990 = 100).
In 2020, CO₂ emissions from energy processes in the non-metallic mineral processing industry amounted to 10.3 Mt, a 5.2% reduction from 2019. CO₂ emission intensity relative to the sector’s value added was 1,104.4 tCO₂ per million euros, a 2.4% increase from the previous year (Table 1). In the cement production segment, CO₂ emissions were 4.0 Mt (-11.4% vs. 2019), with a specific emission of 0.22 t CO₂ per tonne of cement produced, a 5.6% decrease from the previous year (Table 2).
CO₂ emissions from energy processes in the non-metallic mineral processing industry decreased by 50.8% from 1990 to 2020, with a peak in 2003 (25.4 Mt) and a low in 2020 (10.3 Mt). Over the same period, the sector’s value added declined by 27.5%, reaching its maximum in 2007 and minimum in 2020 (Table 1 and Figure 1). Consequently, CO₂ emission intensity decreased by 32.2% from 1,628 t/million euros in 1990 to 1,104.4 t/million euros in 2020, peaking in 2003 (1,871 t/million euros) and bottoming out in 2019 (1,078 t/million euros). CO₂ emissions from fossil fuel combustion for cement production alone fell by 62.7%, with a peak in 2007 (11.2 Mt) and a low in 2020 (4.0 Mt) (Table 2). Cement production also declined by 57.4%, from a maximum in 2006 (47.9 Mt) to a minimum in 2020 (18.0 Mt). As a result, specific CO₂ emissions per tonne of cement dropped from 0.25 tCO₂/t in 1990 to 0.22 tCO₂/t in 2020 (-12.4%), with a peak of 0.28 t/t in 1995.
Data
Table 1: Carbon dioxide emission intensity related to energy use in the non-metallic mineral processing industry in Italy, relative to value added.
ISPRA elaboration, based on ISPRA data (CO₂ emissions) and ISTAT data (Value Added).
Table 2: Specific carbon dioxide emissions from fossil fuel use in relation to cement production in Italy
ISPRA elaboration based on CO₂ emissions data from Ispra and production data from Istat and the Ministry of Economic Development (MSE)


Historical data analysis shows a faster decline in emissions than in production, leading to reduced carbon dioxide emissions per unit of output. From a peak of 0.28 tCO₂/t of cement in 1995, the value reached a minimum of 0.22 tCO₂/t in 2020 (see Table 2 and Figure 2).