Panel 1
Daniela Romano, Andrea Gagna
The efficiency indicator, calculated for the years from 1990 to 2020, represents carbon dioxide emissions per unit of value added in the manufacturing and construction sectors in Italy. The substantial reduction in emission intensity over the years (-48% between 1990 and 2020) indicates an improvement in the level of efficiency achieved by the Italian manufacturing and construction industry.
This indicator expresses the carbon dioxide emissions per unit of value added in the manufacturing and construction industry in Italy. It is a key environmental indicator: the indicator is annually reported to the European Commission as part of the Greenhouse gas emissions monitoring mechanism Community and for the implementation of the Kyoto Protocol.
Provide, regularly, information on the main causes and highlight the progress made at the national level in the industrial sector from a socio-economic and environmental perspective.
Regulation (EU) No. 525/2013, Article 7, paragraph 1(f), states that Member States must report to the Commission, by 15 January each year (year X), information on carbon dioxide emission intensity indicators, as defined in Annex 3 of the same Regulation, referring to year X-2. Commission Implementing Regulation (EU) No. 749/2014 of 30 June 2014 outlines the structure, format, transmission procedures, and review of the information submitted by Member States under Regulation (EU) No. 525/2013. Commission Decision 2005/166/EC of 10 February 2005 lays down the implementation rules of Decision No. 280/2004/EC of the European Parliament and of the Council concerning a mechanism for monitoring Community greenhouse gas emissions and implementing the Kyoto Protocol. It mandates monitoring all anthropogenic greenhouse gas emissions, evaluating progress in fulfilling commitments under the UNFCCC and the Kyoto Protocol, and ensuring timely, complete, accurate, consistent, comparable, and transparent reporting by the Community and its Member States. For carbon dioxide emission intensity indicators, the Decision requires Member States to submit data annually starting from 15 January 2005, regarding priority, supplementary priority, and supplementary indicators (as per Article 3(1)(j) of Decision No. 280/2004/EC).
Panel 2
APAT, 2008. Carbon Dioxide Intensity Indicators. (http://www.isprambiente.gov.it/contentfiles/00004100/4151-co2intensityindicators08.pdf/)
ISPRA, various years. CO2 emissions data available at: http://www.sinanet.isprambiente.it/it/sia-ispra/serie-storiche-emissioni
no limitation
no actions
Data quality assessment
ISPRA (Istituto Superiore per la Protezione e la Ricerca Ambientale) ISTAT (Istituto Nazionale di Statistica)
Data are from ISPRA, specifically the carbon dioxide emission intensity indicators, officially reported each year to the EU within the framework of the MMR (Monitoring Mechanism Regulation) for greenhouse gases, available at the following link: http://www.sinanet.isprambiente.it/it/sia-ispra/serie-storiche-emissioni/indicatori-di-intensita-di-emissione-di-anidride-carbonica-italia/view
ISPRA, various years. Carbon dioxide emission intensity indicators available at: http://www.sinanet.isprambiente.it/it/sia-ispra/serie-storiche-emissioni/indicatori-di-intensita-di-emissione-di-anidride-carbonica-italia/view
Istat, various years. Data on Added Value available at: http://dati.istat.it/
National
1990 - 2020
Indicator assessment
Indicators are calculated as the ratio of CO₂ emissions (t) from energy use in the manufacturing and construction industries in Italy to the sector’s value added (in million euros), presented as fixed base index numbers (1990=100).
In 2020, CO₂ emissions from energy processes in the manufacturing and construction sectors amounted to 44.9 million tons, and the related value added was €291.1 billion, resulting in an emission intensity of 154.2 t/M€, which is half of the 1990 level.
CO₂ emissions from energy processes in the manufacturing and construction sectors decreased by nearly 51% from 1990 (peak value in the time series) to 2020. Sector value added varied overall by +3.9% between 1990 and 2020, with a minimum in 1993 and a maximum in 2007. Emission intensity fell from 300 t/M€ in 1990 to 154.2 t/M€ in 2020, a decrease of about -49%.
Data
Table 1: CO₂ emission intensity from energy use in Italy’s manufacturing and construction sectors, per unit of value added
ISPRA elaboration based on ISPRA data (carbon dioxide emissions) and ISTAT data (value added)
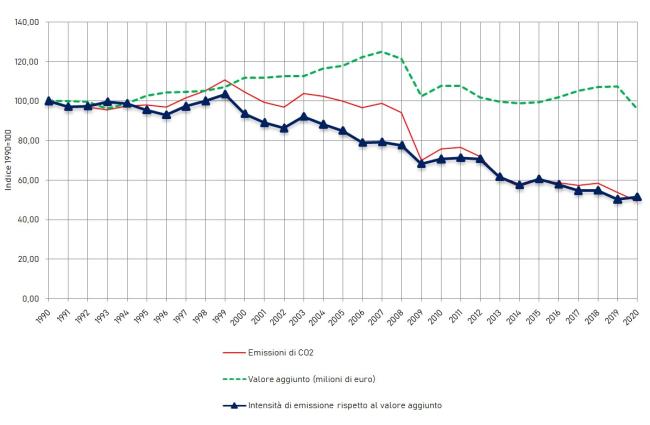
Figure 1: CO₂ emission intensity relative to the value added of the manufacturing and construction industry
ISPRA elaboration based on CO₂ emissions data from ISPRA and value added data from ISTAT
The substantial reduction in emission intensity over time indicates an improvement in efficiency in the manufacturing and construction industries in Italy. While emissions decreased significantly, value added increased slightly, indicating a decoupling between pressure and driving force, resulting in lower emission intensity (see Figure 1).