Antonio Caputo
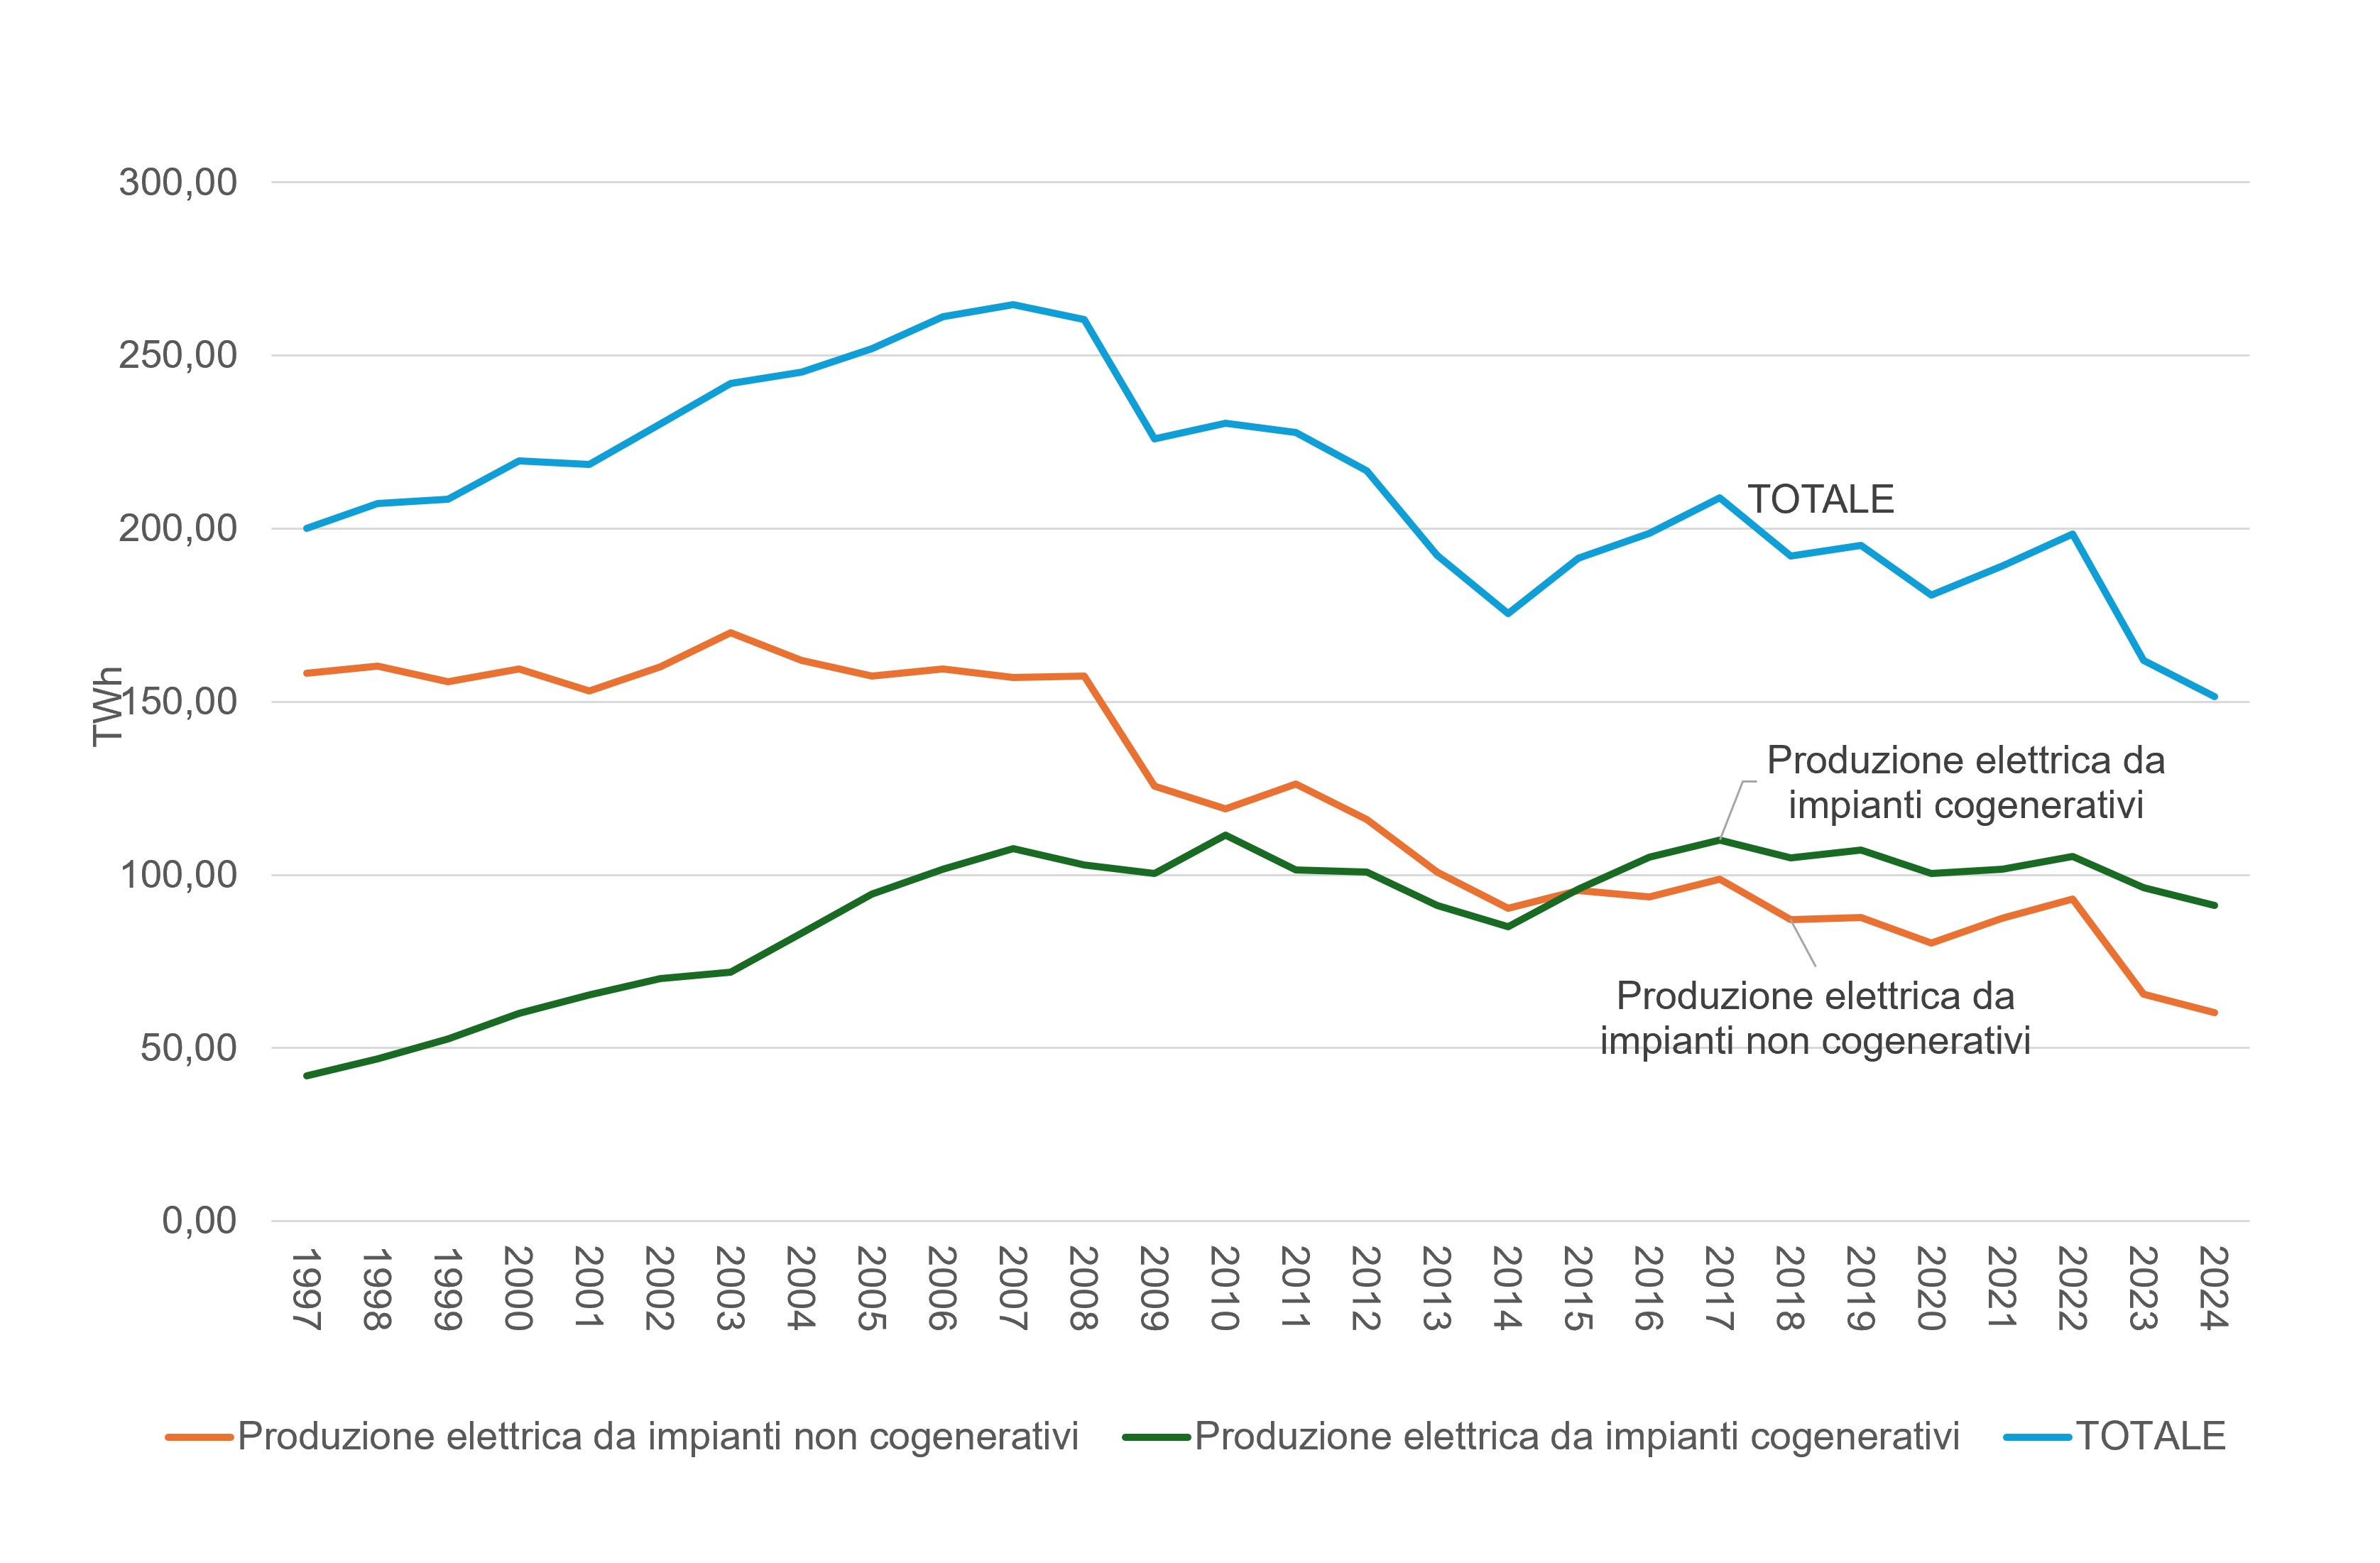
In 1997, gross electricity production was clearly dominated by conventional power-only plants (158.2 TWh out of a total of 200.2 TWh), with cogeneration accounting for 42 TWh (21%). In 2024, conventional electricity production was 60.2 TWh, while cogeneration accounted for 91.2 GWh (60.2%) out of a total of 151.4 TWh.
The indicator measures the electricity production of combined heat and power plants.
Evaluate the contribution of cogeneration plants to total electricity production, in order to increase the efficiency of energy supply.
The current regulatory framework originates from Legislative Decree 79/1999 (Bersani Decree), which reformed the electricity system, initiating market liberalization and introducing the first forms of protection and incentives for energy produced through combined and similar processes. Subsequently, Legislative Decree 20/2007 implemented European Directive 2004/8/EC, with the aim of promoting and structuring cogeneration based on the demand for useful heat. This is the context for the Ministerial Decree of 4 August 2011, which defined the support regime for High-Efficiency Cogeneration (HEC) by introducing the Energy Efficiency Certificates (TEE/White Certificates) mechanism. Finally, Legislative Decree 28/2011 and Legislative Decree 199/2021 (RED II) outlined the framework for the promotion of energy from renewable sources, encouraging the integration of biomass and biogas-fueled cogeneration and the development of efficient district heating networks.
TERNA S.p.A., Statistical data on electricity in Italy, various years
Terna - National Electricity Network S.p.A.
TERNA S.p.A., Production and use of heat from cogeneration plants Statistical Publications - Terna spa
National
1997-2024
Gross and net electricity production from cogeneration plants (GWh)
The data is collected and processed by TERNA S.p.A.
In 2024, total thermoelectric production (gross and net) reached an all-time low for the series considered, at 151.4 TWh and 145.8 TWh, respectively. Production from cogeneration plants stood at 91.2 TWh, covering 60.2% of the gross total, while electricity-only plants dropped to 60.2 TWh. Cogeneration guaranteed 87.9 TWh, equal to 60.3% of total net thermal production, while non-cogeneration production stopped at 57.9 TWh (Tables 1 and 2).
The period between 1997 and 2007, characterized by expansion and restructuring, was marked by the strong development of combined cycle and industrial cogeneration, culminating in 2007 when total gross production reached an all-time high of 264.7 TWh, with cogeneration reaching 107.7 TWh. In the following decade, from 2008 to 2017, the sector entered a phase of maturity in which gross cogeneration reached its all-time high in 2010 at 111.5 TWh, equal to 108.3 TWh net. In the years immediately following, however, the contraction in consumption and the massive introduction of renewable sources, such as solar and wind, significantly reduced the scope for conventional non-cogeneration generation. Finally, in the period between 2018 and 2024, which was characterized by efficiency improvements and the downsizing of thermal generation, despite the progressive decline in overall thermal electricity volumes, the percentage share of cogeneration continued to grow steadily, consolidating above 60% in 2024 (Figure 1). Among cogeneration technologies, internal combustion (IC) emerged in particular, rising to 20,345 GWh gross, and combined cycle cogeneration (CCC), which, despite showing a decreasing trend, continue to represent the sector's largest share with 58.6 TWh gross.
| Data |
|---|
Headline
Table 1: Gross electricity production from cogeneration plants. Data source
Terna |
Headline
Table 2: Net electricity production from cogeneration plants. Data source
Terna |
Thumbnail
Headline
Figure 1: Electricity production from non-cogenerative and generative plants. Data source
Terna |
While the decline in non-cogeneration volumes reflects the positive entry of renewable sources into the national electricity mix, the resilience of cogeneration demonstrates the irreplaceable value of integrating electricity and heat in industrial and residential districts. The future challenge for cogeneration lies in the progressive conversion of power supplies to decarbonized energy sources, thus preserving grid flexibility and industrial heat supply as part of the path to climate neutrality.