Giovanni Finocchiaro, Andrea Gagna, Mariangela Soraci
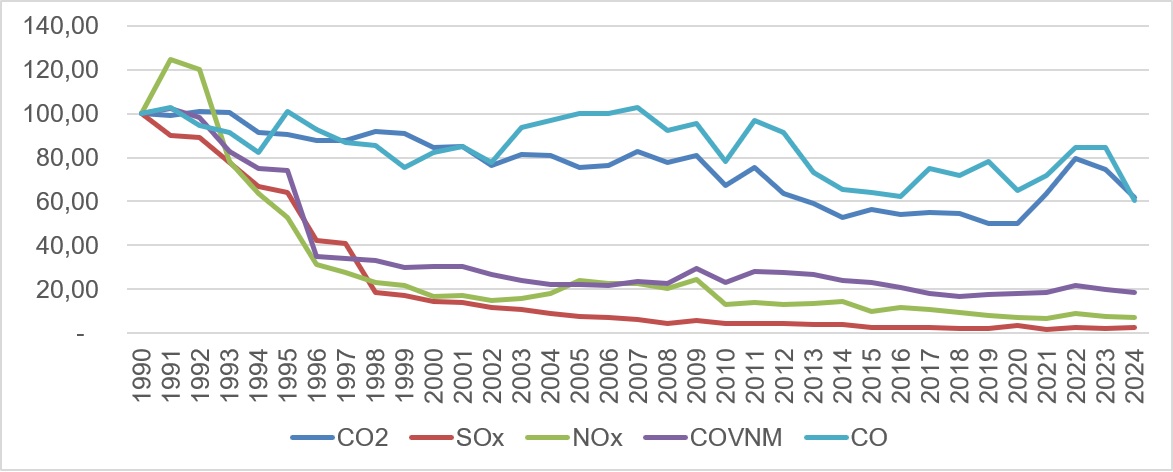
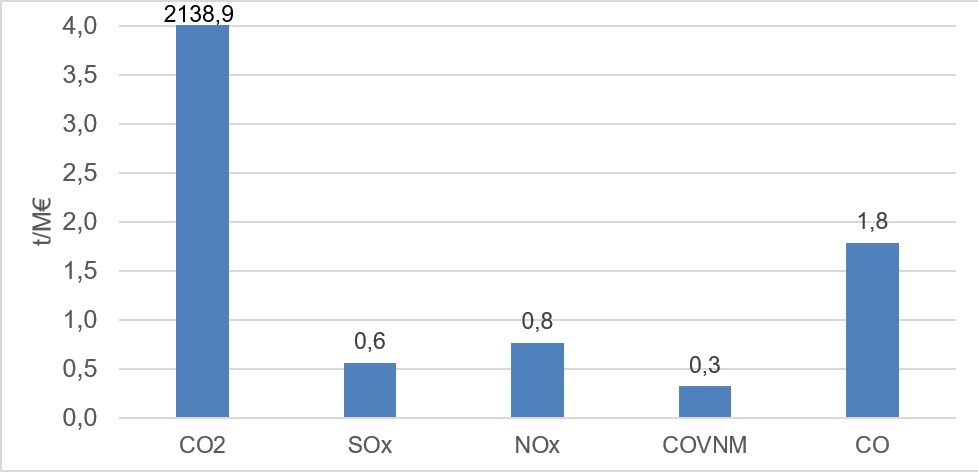
In 2024, for every million euros of added value, the Italian chemical industry emitted 2,139 t of CO₂, compared to 0.6 t of SOx, 0.8 t of NOx, 0.3 t of NMVOCs, and 1.8 t of CO. Compared to 1990, SOx and NOx emission intensities have almost disappeared (-97.6% and -92.7%), while CO₂ emissions have decreased by 38%, highlighting how energy decarbonization continues to represent one of the main challenges for the sector. Over the past year, the indicator has decreased for almost all pollutants (CO₂ -16.8%, NOx -1.6%, NMVOC -7.2%, CO -28.4%) with the exception of SOx, whose intensity increased by 20% compared to 2023. Overall, the trend highlights a progressive reduction in emissions per unit of value added, in line with the economic growth of the sector. Calculated for the period 1990-2024 and updated annually with ISPRA and Istat data, the indicator offers an immediate view of the trend in the intensity of atmospheric emissions for the entire chemical sector, in line with the information communicated annually to the European Commission under the Community's greenhouse gas emissions monitoring mechanism.
The indicator compares the total annual emissions of five macro-air pollutants produced by the chemical and petrochemical industries—CO₂ (from combustion), SOx (sulfur oxides); NOx (nitrogen oxides); NMVOCs (non-methane volatile organic compounds), and CO (carbon monoxide)—to the sector's value added (millions of euros at basic prices, 2020 chain-linked values). Emissions are estimated according to EMEP/EEA methodologies and revised annually for the entire historical series (1990-2024) to incorporate new data and methodological improvements. Since the economic denominator represents the added value generated by the sector, the indicator measures the quantity of pollutant emitted per unit of economic value produced, providing a summary of the sector's emissions over time, rather than the characteristics of individual production processes.
Continuously monitor the chemical industry's ability to decouple economic growth from emissions of CO₂ and other major air pollutants, providing a reliable benchmark for assessing the effectiveness of sector policies.
The regulatory framework of the indicator combines monitoring requirements for climate-altering emissions and emissions of other air pollutants: Regulation (EU) 2018/1999 on the Governance of the Energy Union requires Member States, in Article 26, to transmit every 15 March the national greenhouse gas inventory and the emission intensity indicators relating to the year X-2, according to the structure dictated by Implementing Regulation (EU) 2020/1208; These obligations are part of the “European Climate Law”, Regulation (EU) 2021/1119, which makes climate neutrality by 2050 and a reduction of at least 55% of net emissions by 2030 legally binding. For conventional pollutants, the indicator is aligned with the national reductions set by Directive (EU) 2016/2284 on emission limits for SOx, NOx, NMVOCs and CO, while on the industrial side, Directive 2010/75/EU on industrial emissions remains central, implemented in Italy with Legislative Decree 46/2014, which requires the adoption of best available techniques and the systematic exchange of emission data from activities subject to AIA. Taken together, these regulations set reduction targets, reporting deadlines, operating requirements for industrial plants, and requirements for accuracy, transparency, and annual review that emissions data must comply with.
ISPRA Report 428/2026 – National Inventory Document 2026 – Italian Greenhouse Gas Inventory 1990-2024.
ISPRA Report 426/2026 – Italian Emission Inventory 1990-2024. Information Inventory Report 2026
ISPRA (Italian Institute for Environmental Protection and Research)
ISTAT (National Institute of Statistics)
The emission series come from the National Inventory of Atmospheric Emissions maintained by ISPRA: the datasets in NFR and SNAP formats can be freely downloaded from the portal emissioni.sina.isprambiente.it, accompanied by the most recent detailed reports – Italian Emission Inventory 1990-2024. Informative Inventory Report 2026 isprambiente.gov.it and National Inventory Document 2026 – Italian Greenhouse Gas Inventory 1990-2024 (also available in the “Publications” section of the ISPRA portal https://www.isprambiente.gov.it). The CO₂ intensity indicators required each year by the EU energy and climate governance are transmitted by ISPRA using the Annex II template of Regulation (EU) 2018/1999 and published on the same portal together with the official historical series of pollutants (emissioni.sina.isprambiente.it).
The economic data come from the ISTAT National Accounts: the table "Value added at basic prices - Chemical products manufacturing sector (ATECO 20) - chained prices 2020" is accessible in open data on the I.Stat data-warehouse with export in CSV/SDMX formats.dati.istat.it.
National
1990 - 2024
Emission intensity of various pollutants (t/M€)
Every year, starting in 1990, emissions of CO₂, SOx, NOx, NMVOCs, and CO from the chemical sector are extracted from the National Inventory of Atmospheric Emissions (ISPRA) and the corresponding added value (at 2020 prices) is extracted from the ISTAT national accounts. After harmonizing the classifications, the emissions of each pollutant are compared to the added value to obtain the tons emitted per million euros. The resulting series is then normalized on a 1990 = 100 basis to more easily interpret the evolution. With each revision of the inventory (following the IPCC and EMEP/EEA guidelines and based on the international revision processes required by EU reporting, the UNFCCC, and UNECE/CLRTAP Conventions) or the economic accounts, the entire historical series is retroactively recalculated.
In 2024, the Italian chemical industry emitted 22.5 Mt of CO₂, 5.9 kt of SOx, 8.0 kt of NOx, 3.4 kt of NMVOCs, and 18.8 kt of CO. Comparing these quantities to the sector's added value (approximately €10.5 billion at 2020 prices), the emission intensities were 2,138 t of CO₂, 0.6 t of SOx, 0.8 t of NOx, 0.3 t of NMVOCs[SI5.1], and 1.8 t of CO per million euros (Table 1). Compared to 2023, emission intensity decreased for almost all pollutants (–16.8% CO₂, –1.6% NOx, –7.2% NMVOCs, and –28.4% CO), with the exception of SOx, whose intensity increased by 20%. Overall, the data show a reduction in emission intensity compared to the previous year and confirm the progress made over time, while still leaving room for further reduction in CO₂ emissions.
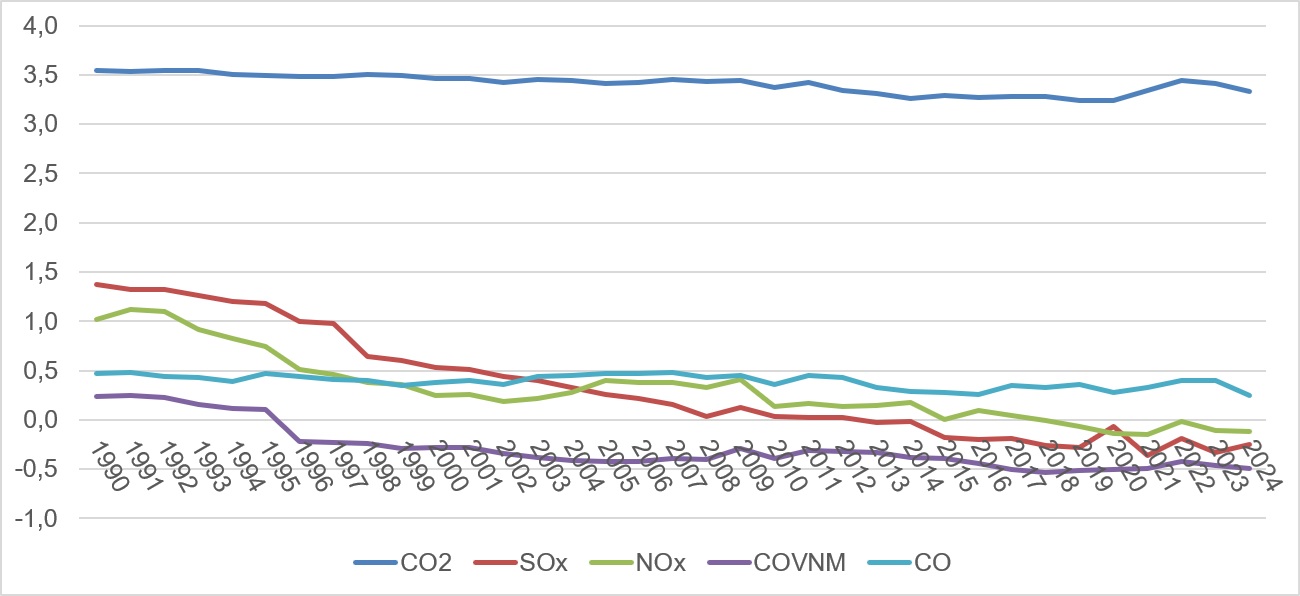
Since 1990, emissions intensity has decreased significantly for conventional pollutants: -97.6% SOx, -92.7% NOx, -81.5% NMVOCs. Carbon monoxide has seen a less pronounced reduction (-39.4%), while CO₂ has decreased by 38.1%. The fastest decreases in SOx, NOx, and NMVOCs occurred between the mid-1990s and the mid-2000s; while CO₂ has shown wider fluctuations, with a minimum in 2020 and a partial rebound in recent years.
| Allegati |
|---|
Titolo
Table 1: Atmospheric emission intensity in the chemical industry in Italy, compared to added value Fonte
ISPRA processing based on ISPRA data (CO2; SOx, NOx, NMVOC, and CO emissions) and Istat data (Value Added data). |
Thumbnail
Titolo
Figure 1: Emission intensity (log10 scale; CO₂, SOx, NOx, NMVOC, CO in t/M€) in the chemical industry Fonte
ISPRA processing based on ISPRA and Istat data |
Thumbnail
Titolo
Figure 2: Emission intensity, index 1990 = 100 for CO₂, SOx, NOx, NMVOC, CO in the chemical industry Fonte
ISPRA processing based on ISPRA and Istat data |
Thumbnail
Titolo
Figure 3: Emission intensity of CO₂, SOx, NOx, NMVOC, CO in t/M€ in the chemical industry (2024) Fonte
ISPRA processing based on ISPRA and Istat data |
Figure 1 clearly shows the difference between the intensity of CO₂ and that of other pollutants: while SOx, NOx and NMVOCs rapidly decrease to almost zero levels by the mid-2000s, CO₂ follows a more irregular trajectory, decreasing to a minimum in 2020 (around 1,729 t/M€), as reported in Table 1, and subsequently showing a partial increase; while carbon monoxide decreases only marginally and remains, after CO2, the pollutant with the highest emission intensity in terms of tonnes per million euros. In 2024, the emission intensity of SOx decreases by 2.4%, NOx by 7.3% and NMVOCs by 18.5%, while CO₂ by 61.9% and CO by 60.6% (Figure 2). The trend therefore highlights a sharp reduction in emission intensity for conventional pollutants, but remains incomplete for CO2 and CO; the reduction is more limited, perhaps because it is linked to different types of actions. Figure 3 confirms the difference between the intensities of CO2 (2,138 t/M€) and other pollutants, all less than 1 t/M€ except for CO (1.8 t/M€). In 2024, the chemical industry's emissions profile is dominated primarily by climate-altering emissions and, to a lesser extent, carbon monoxide, while the contribution of SOx, NOx, and NMVOCs is more limited.